L-Limonene Oil Market Forecast and Outlook (2025-2035)

The L-limonene oil market is expected to experience steady growth over the next decade, with a compound annual growth rate (CAGR) of 5.1%. Starting at USD 185.3 million in 2025, the market is projected to reach USD 304.7 million by 2035. In the 2025-2030 period, the market will witness gradual expansion, with values increasing from USD 185.3 million to USD 236.5 million by 2030. L-limonene, a key natural solvent and flavoring agent derived from citrus fruits, is becoming increasingly popular due to its multifaceted applications across various industries, including food and beverage, cosmetics, and cleaning products. The market is also benefiting from the rising demand for natural ingredients in products such as perfumes, air fresheners, and cleaning agents. As consumers increasingly shift toward more natural and eco-friendly alternatives, L-limonene's non-toxic, biodegradable, and renewable nature further positions it as a key player in the market.
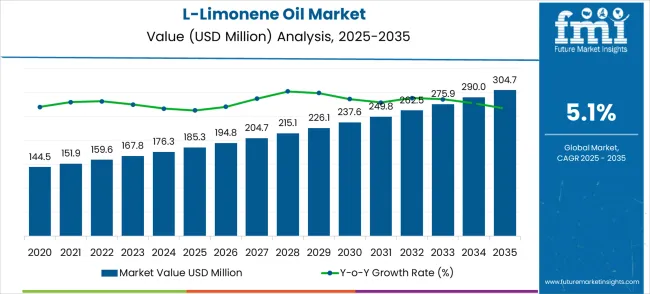
Quick Stats for L-Limonene Oil Market

  • L-Limonene Oil Market Value (2025): USD 185.3 million
  • L-Limonene Oil Market Forecast Value (2035): USD 304.7 million
  • L-Limonene Oil Market Forecast CAGR: 5.1%
  • Leading Purity Level in L-Limonene Oil Market: Purity 90%-95% (64.7%)
  • Key Growth Regions in L-Limonene Oil Market: Asia-Pacific, North America, and Europe
  • Top Key Players in L-Limonene Oil Market: Arora Aromatics Private Limited, Norex Flavours, Citrus Oleo, Kelvin Natural Mint Pvt. Ltd., Ganpati Agri Business Pvt. Ltd., Silverline Chemicals, Vdh Organics Pvt. Ltd., Hindustan Mint & Agro, F&F International

L Limonene Oil Market Market Value Analysis

The adoption of L-limonene oil is also being driven by growing awareness regarding the health benefits of plant-based ingredients, particularly in the food and beverage sector. As a natural antimicrobial and anti-inflammatory agent, L-limonene is finding use in both functional foods and supplements. Its antioxidant properties are being increasingly highlighted in the beauty and skincare markets, where it is used for its soothing and cleansing effects. The market will see further adoption as industries move away from synthetic chemicals and seek more natural alternatives to satisfy consumer preferences. Its potential in various industrial applications, such as cleaning products and degreasers, will continue to bolster its growth. As the market for L-limonene oil continues to expand, its versatility and natural appeal will remain a driving force for sustained growth, making it an integral part of the broader shift toward cleaner, greener alternatives in various sectors.

L-Limonene Oil Market Key Takeaways

Metric Value
Estimated Value in (2025E) USD 185.3 million
Forecast Value in (2035F) USD 304.7 million
Forecast CAGR (2025 to 2035) 5.1%

The L-limonene oil market has gained traction as a versatile and natural product across multiple industries. Within the essential oils market, this segment holds a share of approximately 5.6%, reflecting its use in aromatherapy and personal care applications. The natural fragrance market records a contribution of around 6.2%, as L-limonene oil is often used for its citrus aroma in perfumes and air fresheners. The organic chemicals market accounts for 4.9%, with L-limonene being a widely utilized bio-based solvent in industrial applications. In the personal care ingredients market, the share is 7.3%, as this oil is incorporated into cosmetic and skincare products for its refreshing scent and antioxidant properties. The food and beverage flavoring market contributes around 6.8%, given the demand for natural citrus flavoring in various products. Altogether, these parent markets represent 30.8%, illustrating the increasing importance of L-limonene oil across multiple sectors due to its natural, non-toxic, and versatile applications. The market is considered pivotal in driving natural alternatives in flavoring, fragrances, and chemical formulations.

Why is the L-Limonene Oil Market Growing?

Market expansion is being supported by the rapid increase in demand for natural and sustainable ingredients worldwide and the corresponding need for eco-friendly alternatives to synthetic chemicals. Modern consumer products rely on L-limonene oil for its dual functionality as both a flavoring agent and cleaning solvent, making it essential across food, cosmetic, and household product applications. The compound's biodegradable properties and FDA GRAS status ensure regulatory compliance while meeting consumer preferences for recognizable ingredients.

The growing complexity of formulation requirements and increasing focus on environmental sustainability are driving demand for high-quality L-limonene oil from certified suppliers with appropriate extraction technology and quality assurance. Food and beverage manufacturers are increasingly requiring natural citrus compounds that can provide authentic flavor profiles while maintaining product shelf life and stability. Regulatory requirements and industry standards are establishing standardized purity specifications that require advanced extraction processes and quality control systems.

Segmental Analysis

The market is segmented by purity level, application, and region. By purity level, the market is divided into Purity 90%-95%, Purity ≥97%, Purity ≥99%, and others. Based on application, the market is categorized into food flavorings, cosmetics, cleaning agents, and others. Regionally, the market is divided into North America, Europe, East Asia, South Asia Pacific, Latin America, and Middle East & Africa.
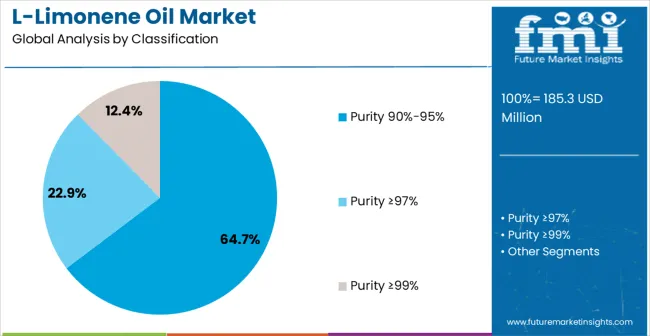
By Purity Level, Purity 90%-95% Segment Accounts for 64.7% Market Share

L Limonene Oil Market Analysis By Classification

Purity 90%-95% L-limonene oil is projected to account for 64.7% of the L-Limonene Oil market in 2025. This leading share is supported by the widespread adoption of this purity grade in food flavoring applications, which represent the majority of current market demand. Mid-range purity provides optimal cost-effectiveness while maintaining sufficient quality for most commercial applications including beverages, confectionery, and household cleaning products. The segment benefits from established extraction procedures and comprehensive supplier availability from multiple citrus processing facilities. This grade offers balanced performance characteristics for diverse industrial applications while ensuring consistent quality standards across production batches and maintaining competitive pricing.
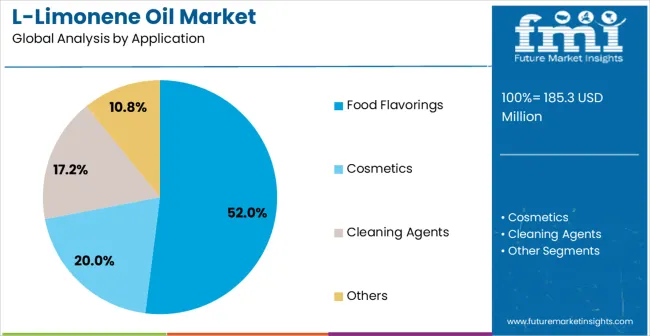
By Application, Food Flavorings Segment Accounts for 52% Market Share

L Limonene Oil Market Analysis By Application

Food flavorings applications are expected to represent 52% of L-limonene oil demand in 2025. This dominant share reflects the extensive use of citrus flavoring in beverage, confectionery, and processed food manufacturing that requires natural taste enhancement solutions. Modern food products increasingly feature multiple applications for L-limonene oil including flavor enhancement, preservation assistance, and natural antimicrobial properties for extended shelf life benefits. The segment benefits from growing consumer preference for natural ingredients and increasing regulatory requirements for clean label food formulations. Market expansion continues as manufacturers seek sustainable alternatives to synthetic flavoring compounds.

What are the Drivers, Restraints, and Key Trends of the L-Limonene Oil Market?

The L-limonene oil market is experiencing steady growth driven by increasing demand for natural solvents, fragrances, and cleaning agents. Its applications in food & beverages, cosmetics, and pharmaceuticals are expanding as consumers seek more natural, eco-friendly alternatives to synthetic chemicals. Trends indicate rising interest in L-limonene’s use in green chemistry, especially in solvent and extraction processes. However, challenges related to supply chain volatility, high production costs, and inconsistent quality remain as barriers to broader adoption in industrial applications.

Emerging Trends in L-Limonene’s Role in Green Chemistry

The L-limonene oil market is experiencing notable trends, particularly the growing use of this natural solvent in green chemistry applications. In opinion, its role in eco-friendly extraction processes for essential oils, biofuels, and natural compounds has become a focal point. Companies are increasingly turning to L-limonene due to its biodegradability and non-toxic properties, making it an attractive alternative to harmful synthetic solvents. As industries seek more sustainable and safer solutions for chemical processing, the demand for L-limonene is expected to grow, especially in food, cosmetics, and pharmaceuticals. The trend toward environmentally conscious production processes is driving the expansion of this market.

Challenges from Supply Chain Variability and Production Costs

The L-limonene oil market faces significant challenges, notably supply chain volatility and high production costs. In opinion, the market is dependent on citrus fruit cultivation, particularly orange production, making it vulnerable to fluctuations in agricultural yields and climate change. These factors can cause price volatility and disruptions in the availability of raw materials. Moreover, the extraction process of L-limonene oil requires significant energy and processing infrastructure, contributing to higher costs compared to synthetic alternatives. These challenges, combined with issues of quality inconsistency, may limit the widespread adoption of L-limonene in some industrial applications.
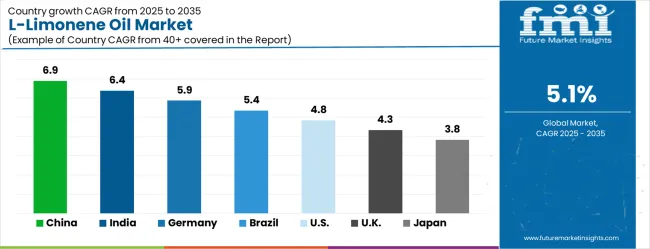
Analysis of L-Limonene Oil Market by Key Country

L Limonene Oil Market Cagr Analysis By Country

Country CAGR (2025-2035)
China 6.9%
India 6.4%
Germany 5.9%
Brazil 5.4%
United States 4.8%
United Kingdom 4.3%
Japan 3.8%

The L-limonene oil market is growing rapidly, with China leading at a 6.9% CAGR through 2035, driven by massive food processing expansion, growing consumer preference for natural ingredients, and comprehensive citrus cultivation programs. India follows at 6.4%, supported by expanding essential oil industry and increasing pharmaceutical applications requiring natural compounds. Germany records 5.9%, emphasizing precision extraction technology, advanced quality control, and stringent food safety standards. Brazil grows at 5.4%, leveraging abundant citrus resources and established processing infrastructure. The United States shows 4.8% growth, focusing on premium applications and organic certification. The United Kingdom and Japan demonstrate steady growth at 4.3% and 3.8% respectively, driven by specialty food applications and high-value cosmetic formulations. The report covers an in-depth analysis of 40+ countries; the top-performing countries are highlighted below.

Demand Assessment for L-Limonene Oil Market in China

The L-limonene oil market in China is growing at a CAGR of 6.9%, supported by increasing demand for natural flavoring and fragrance agents in food, cosmetics, and cleaning products. As China continues its industrial growth and enhances its focus on sustainability, the adoption of natural ingredients such as L-limonene oil in various consumer goods is gaining traction. The country's rising health consciousness and preference for plant-based ingredients also contribute to market expansion. Moreover, China’s large-scale production of citrus fruits provides an abundant supply of raw materials, further driving growth.

  • Consumer preference for natural ingredients fuels L-limonene oil demand in China.
  • Industrial growth and sustainability trends enhance market adoption.
  • Abundant citrus fruit production supports supply in China.

Sales Forecast for L-Limonene Oil Market in India

The L-limonene oil market in India is projected to grow at a CAGR of 6.4%, driven by rising demand for natural food additives, cosmetics ingredients, and cleaning solutions. India’s growing middle class and increasing consumer awareness of health and wellness are contributing to the adoption of natural and eco-friendly products. The country’s agricultural base, particularly citrus farming, continues to offer a steady supply of raw materials for L-limonene oil production. Government policies promoting the use of natural products further support market growth.

  • Demand for natural and eco-friendly products accelerates adoption in India.
  • Growing middle class and awareness of health drive market expansion.
  • Strong agricultural base in citrus farming ensures steady raw material supply.

Market Penetration Analysis for L-Limonene Oil Market in Germany

The L-limonene oil market in Germany is growing at a CAGR of 5.9%, with strong demand from the food, pharmaceutical, and cosmetic industries. Germany’s focus on sustainable, eco-friendly, and natural ingredients in product formulations drives the adoption of L-limonene oil. The country’s strict regulations on chemical ingredients in consumer products further enhance the demand for natural alternatives. L-limonene oil’s versatile applications in cleaning, as well as in fragrance and flavoring agents, support its steady growth in Germany’s market.

  • Sustainability and eco-friendly ingredient demand boost adoption in Germany.
  • Regulations on chemical ingredients promote the use of natural alternatives.
  • Versatile applications in cleaning, fragrance, and flavoring contribute to steady growth.

Growth Outlook for L-Limonene Oil Market in Brazil

The L-limonene oil market in Brazil is projected to grow at a CAGR of 5.4%, driven by expanding demand in food and beverage, personal care, and cleaning products. Brazil’s rich agricultural base, particularly citrus fruit production, supports the availability of raw materials for L-limonene oil. The country’s growing preference for natural and organic ingredients in consumer goods fuels the demand for this product. The rise in middle-class income and the focus on green, eco-friendly products continue to support L-limonene oil market growth in Brazil.

  • Brazil’s agricultural base strengthens L-limonene oil supply.
  • Preference for natural and organic ingredients drives demand.
  • Growing middle-class income supports the adoption of eco-friendly products.

In-depth Review of L-Limonene Oil Market in the US

The L-limonene oil market in the United States is growing at a CAGR of 4.8%, fueled by increasing demand for natural fragrances, cleaning agents, and food additives. The USA market emphasizes sustainability, and L-limonene oil fits into the growing trend for green products. The country’s increasing focus on wellness and natural ingredients in cosmetics, household products, and health-related goods continues to drive the adoption of L-limonene oil. Furthermore, the rise in eco-conscious consumer behavior supports its growth in various applications.

  • Demand for natural fragrances and cleaning agents drives market growth in the USA
  • Sustainability trends and eco-conscious consumer behavior enhance adoption.
  • Wellness and natural ingredient preferences fuel L-limonene oil demand.

Strategic Insights for L-Limonene Oil Market in the UK

The L-limonene oil market in the United Kingdom is growing at a CAGR of 4.3%, with adoption increasing in personal care, food, and cleaning products. The UK’s focus on sustainability and eco-friendly alternatives supports the use of L-limonene oil in various industries. The demand for natural ingredients in cosmetics, fragrances, and household products continues to rise as consumers become more conscious of the products they use. As regulations surrounding chemical ingredients in consumer goods tighten, L-limonene oil’s natural properties make it an attractive option.
  • Eco-conscious consumers drive the demand for natural ingredients in the UK
  • Sustainability regulations and eco-friendly product trends support growth.
  • Natural ingredient demand in cosmetics and food drives adoption in the UK

Opportunity Analysis for L-Limonene Oil Market in Japan

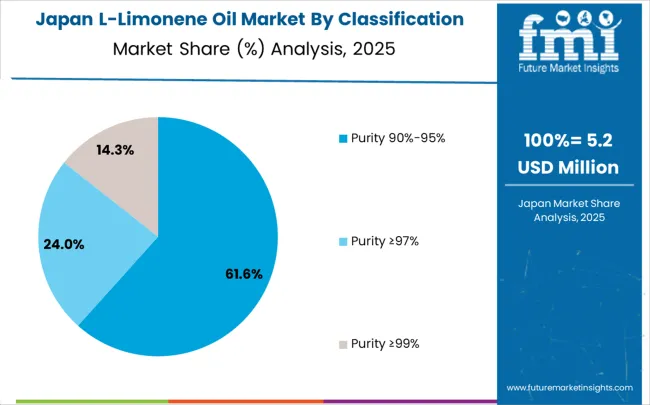
L Limonene Oil Market Japan Market Share Analysis By Classification

The L-limonene oil market in Japan is expanding at a CAGR of 3.8%, supported by increasing demand for natural cleaning agents, food additives, and cosmetic ingredients. Japan’s growing focus on wellness, health, and sustainability is enhancing the market for L-limonene oil. The country’s strict consumer product regulations, favoring natural and safe ingredients, further promote the adoption of L-limonene oil. The market remains steady, with key drivers coming from demand in personal care and home cleaning products.
  • Japan’s wellness and sustainability trends support L-limonene oil demand.
  • Regulations favoring natural ingredients boost market growth.
  • Increasing demand for eco-friendly products fuels steady adoption.

Europe Market Split by Country

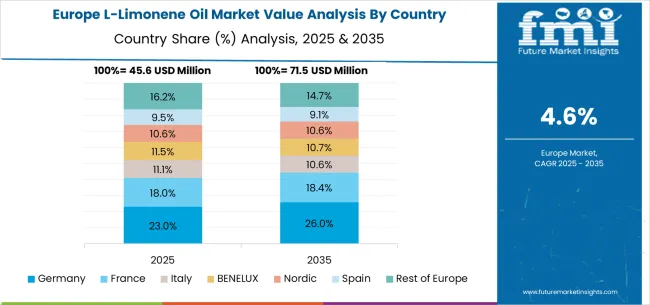
L Limonene Oil Market Europe Country Market Share Analysis, 2025 & 2035

The L-limonene oil market in Europe is projected to grow from USD 52.4 million in 2025 to USD 78.9 million by 2035, registering a CAGR of 4.2% over the forecast period. Germany is expected to maintain its leadership with a 28.5% share in 2025, supported by its extensive food processing industry and advanced extraction technology capabilities.

France is projected to hold 19.7% market share, followed by Italy at 16.3%. The United Kingdom and Spain account for 12.8% and 10.4% respectively. The Rest of Europe region represents 12.3% of the market, attributed to growing natural ingredient adoption in Eastern European countries and expanding organic food production capacity.

Competitive Landscape of L-Limonene Oil Market

The L-limonene oil market is defined by competition among specialized citrus processors, essential oil manufacturers, and natural ingredient suppliers. Companies are investing in advanced extraction technologies, quality assurance systems, organic certification capabilities, and supply chain optimization to deliver consistent, high-quality, and sustainable L-limonene oil solutions. Strategic partnerships, technological innovation, and geographic expansion are central to strengthening product portfolios and market presence.

Arora Aromatics Private Limited, India-based, offers high-quality L-limonene oil with focus on purity consistency, sustainable sourcing, and technical expertise. Norex Flavours, operating regionally, provides comprehensive L-limonene solutions integrated with flavor and fragrance ingredient systems. Citrus Oleo, Brazil, delivers technologically advanced extraction services with standardized procedures and quality integration. Kelvin Natural Mint Pvt. Ltd., India, emphasizes natural ingredient sourcing and comprehensive coverage for food and cosmetic applications.

Ganpati Agri Business Pvt. Ltd., India, offers L-limonene oil solutions integrated with comprehensive agricultural processing operations. Silverline Chemicals, India, provides specialized extraction equipment and technical capabilities. Vdh Organics Pvt. Ltd., India, delivers L-limonene oil alongside organic ingredient solutions. Hindustan Mint & Agro and F&F International offer specialized L-limonene oil expertise, standardized production procedures, and service reliability across regional and international networks.

L-Limonene Oil Market - Stakeholder Contribution Framework

L-limonene oil, a naturally occurring monoterpene derived primarily from citrus peels, represents a high-value bio-based chemical with applications spanning food flavoring, cosmetics, cleaning agents, and industrial solvents. With the market valued at $185.3 million in 2024 and projected to reach $304.7 million by 2030 at a 5.1% CAGR, this sector is driven by consumer demand for natural ingredients, sustainability initiatives, and the circular economy utilization of citrus processing waste. Success requires coordination between citrus processors, extraction technology providers, end-user industries, and regulatory bodies to ensure quality, supply stability, and market expansion.

How Governments Could Enhance Value Chain Development?

  • Citrus Waste Valorization Incentives: Provide tax credits and grants for citrus processing facilities that invest in limonene extraction equipment, transforming waste streams into valuable co-products and reducing environmental disposal costs.
  • Quality Standards and Certification: Establish national standards for limonene purity grades (90-95%, ≥97%, ≥99%) and implement certification programs that ensure consistent quality for food-grade and cosmetic applications, building consumer confidence.
  • Agricultural Support Programs: Include citrus cultivation in agricultural development schemes with specific provisions for varieties with high limonene content, supporting farmer income diversification beyond fresh fruit markets.
  • Export Facilitation: Create fast-track approval processes for limonene oil exports, including harmonized testing protocols and mutual recognition agreements with major importing countries to reduce trade barriers.
  • Sustainability Reporting Framework: Develop guidelines for carbon footprint calculation and lifecycle assessment of limonene production, enabling producers to meet increasingly stringent ESG requirements from downstream customers.

How Industry Associations Could Strengthen Market Infrastructure?

  • Analytical Standards Harmonization: Establish standardized testing methods for purity assessment, enantiomeric composition, and trace contaminant detection to ensure consistent quality evaluation across suppliers and applications.
  • Supply Chain Transparency: Create traceability systems that document citrus source regions, extraction methods, and handling practices to meet food safety requirements and enable premium positioning for sustainable products.
  • Technical Application Guidelines: Develop formulation guides for cosmetic chemists, flavor houses, and cleaning product manufacturers on optimal limonene grades, usage levels, and stability considerations for different applications.
  • Market Intelligence Platform: Provide regular analysis of citrus crop yields, seasonal pricing patterns, and emerging application trends to help stakeholders optimize procurement and production strategies.
  • Regulatory Advocacy: Coordinate with international regulatory bodies on GRAS (Generally Recognized As Safe) status maintenance, fragrance allergen classifications, and environmental safety assessments.

How Technology Providers Could Advance Processing Capabilities?

  • Extraction Efficiency Innovation: Develop advanced steam distillation, cold-pressing, and supercritical CO2 extraction systems optimized for maximum limonene yield while preserving optical purity and minimizing thermal degradation.
  • Integrated Processing Solutions: Design modular systems that can process multiple citrus varieties and seasonal variations while maintaining consistent product quality and adapting to varying feedstock compositions.
  • Purification and Fractionation Technology: Offer specialized distillation and chromatographic systems capable of achieving ≥99% purity grades required for high-value pharmaceutical and cosmetic applications.
  • Process Automation and Control: Provide sensor-based monitoring systems that track key quality parameters in real-time, ensuring batch consistency and enabling rapid adjustment to maintain target specifications.
  • Waste Stream Optimization: Develop integrated biorefineries that extract limonene alongside other valuable compounds from citrus peels, maximizing economic value from available biomass.

How Suppliers Could Navigate Market Dynamics?

  • Diversified Sourcing Strategy: Build relationships with citrus processors across multiple regions and varieties to ensure year-round supply continuity and mitigate risks from weather-related crop variations.
  • Product Portfolio Management: Develop differentiated offerings across purity levels with clear positioning - feed/industrial grade (90-95%), cosmetic grade (≥97%), and pharmaceutical grade (≥99%) - to capture value across market segments.
  • Vertical Integration Opportunities: Consider backward integration into citrus processing or forward integration into specialty chemical formulations to capture additional margin and ensure supply security.
  • Sustainability Credentials: Implement comprehensive sustainability programs including renewable energy use, waste minimization, and biodiversity protection to meet growing customer ESG requirements.
  • Technical Service Excellence: Provide application support, stability testing, and custom formulation assistance to help customers optimize limonene performance in their specific applications.

How End-User Industries Could Optimize Utilization?

  • Natural Product Formulations: Leverage limonene's dual functionality as both active ingredient and sustainable solvent in cleaning products, cosmetics, and food applications to meet clean-label consumer demands.
  • Supply Chain Partnerships: Develop long-term supply agreements with producers that include quality guarantees, seasonal price stabilization, and technical support to ensure consistent product performance.
  • Innovation Collaboration: Partner with suppliers and research institutions on new applications for limonene, including its potential as a green solvent, polymer precursor, and bioactive compound.
  • Regulatory Compliance Management: Maintain current understanding of evolving regulations around natural ingredients, allergen labeling, and environmental claims to ensure continued market access.

How Investors Could Support Market Evolution?

  • Processing Infrastructure Development: Finance citrus processing facility upgrades and new extraction plants, particularly in emerging citrus-growing regions where local value addition can capture higher margins.
  • Technology Innovation Funding: Support R&D initiatives focused on novel extraction methods, high-purity separation techniques, and alternative citrus waste valorization approaches.
  • Market Expansion Capital: Back established producers in geographic expansion and capacity scaling to meet growing global demand, particularly in Asia-Pacific markets.
  • Sustainability Transition Finance: Provide capital for renewable energy integration, circular economy initiatives, and environmental certification programs that enhance market positioning.
  • Vertical Integration Opportunities: Support strategic acquisitions that create integrated citrus-to-chemicals value chains, improving supply security and margin capture.

Key Players in the L-Limonene Oil Market

  • Arora Aromatics Private Limited
  • Norex Flavours
  • Citrus Oleo
  • Kelvin Natural Mint Pvt. Ltd.
  • Ganpati Agri Business Pvt. Ltd.
  • Silverline Chemicals
  • Vdh Organics Pvt. Ltd.
  • Hindustan Mint & Agro
  • F&F International

Scope of the Report

Item Value
Quantitative Units (2025) USD 185.3 million
Purity Level Purity 90%-95%, Purity ≥97%, Purity ≥99%, Others
Application Food Flavorings, Cosmetics, Cleaning Agents, Others
Regions Covered North America, Europe, Asia-Pacific, Latin America, Middle East & Africa
Countries Covered United States, Canada, United Kingdom, Germany, France, China, Japan, South Korea, India, Brazil, Australia and 40+ countries
Key Companies Profiled Arora Aromatics Private Limited, Norex Flavours, Citrus Oleo, Kelvin Natural Mint Pvt. Ltd., Ganpati Agri Business Pvt. Ltd., Silverline Chemicals, Vdh Organics Pvt. Ltd., Hindustan Mint & Agro, F&F International
Additional Attributes Dollar sales by purity level and application segments, regional demand trends across Asia-Pacific, North America, and Europe, competitive landscape with established processors and emerging specialty suppliers, customer preferences for organic versus conventional grades, integration with sustainable sourcing initiatives and circular economy platforms

L-Limonene Oil Market by Segments

Purity Level:

  • Purity 90%-95%
  • Purity ≥97%
  • Purity ≥99%
  • Others

Application:

  • Food Flavorings
  • Cosmetics
  • Cleaning Agents
  • Others

Region:

  • North America 
  • United States 
  • Canada 
  • Mexico 
  • Europe 
  • Germany 
  • United Kingdom 
  • France 
  • Italy 
  • Spain 
  • Nordic 
  • BENELUX 
  • Rest of Europe 
  • East Asia 
  • China 
  • Japan 
  • South Korea 
  • South Asia & Pacific 
  • India 
  • ASEAN 
  • Australia & New Zealand 
  • Rest of South Asia & Pacific 
  • Latin America 
  • Brazil 
  • Chile 
  • Rest of Latin America 
  • Middle East & Africa 
  • Kingdom of Saudi Arabia 
  • Other GCC Countries 
  • Turkiye 
  • South Africa 
  • Other African Union 
  • Rest of Middle East & Africa 

Table of Content

  1. Executive Summary
    • Global Market Outlook
    • Demand to side Trends
    • Supply to side Trends
    • Technology Roadmap Analysis
    • Analysis and Recommendations
  2. Market Overview
    • Market Coverage / Taxonomy
    • Market Definition / Scope / Limitations
  3. Market Background
    • Market Dynamics
      • Drivers
      • Restraints
      • Opportunity
      • Trends
    • Scenario Forecast
      • Demand in Optimistic Scenario
      • Demand in Likely Scenario
      • Demand in Conservative Scenario
    • Opportunity Map Analysis
    • Product Life Cycle Analysis
    • Supply Chain Analysis
    • Investment Feasibility Matrix
    • Value Chain Analysis
    • PESTLE and Porter’s Analysis
    • Regulatory Landscape
    • Regional Parent Market Outlook
    • Production and Consumption Statistics
    • Import and Export Statistics
  4. Global Market Analysis 2020 to 2024 and Forecast, 2025 to 2035
    • Historical Market Size Value (USD Million) Analysis, 2020 to 2024
    • Current and Future Market Size Value (USD Million) Projections, 2025 to 2035
      • Y to o to Y Growth Trend Analysis
      • Absolute $ Opportunity Analysis
  5. Global Market Pricing Analysis 2020 to 2024 and Forecast 2025 to 2035
  6. Global Market Analysis 2020 to 2024 and Forecast 2025 to 2035, By Classification
    • Introduction / Key Findings
    • Historical Market Size Value (USD Million) Analysis By Classification , 2020 to 2024
    • Current and Future Market Size Value (USD Million) Analysis and Forecast By Classification , 2025 to 2035
      • Purity 90%-95%
      • Purity ≥97%
      • Purity ≥99%
    • Y to o to Y Growth Trend Analysis By Classification , 2020 to 2024
    • Absolute $ Opportunity Analysis By Classification , 2025 to 2035
  7. Global Market Analysis 2020 to 2024 and Forecast 2025 to 2035, By Application
    • Introduction / Key Findings
    • Historical Market Size Value (USD Million) Analysis By Application, 2020 to 2024
    • Current and Future Market Size Value (USD Million) Analysis and Forecast By Application, 2025 to 2035
      • Food Flavorings
      • Cosmetics
      • Cleaning Agents
      • Others
    • Y to o to Y Growth Trend Analysis By Application, 2020 to 2024
    • Absolute $ Opportunity Analysis By Application, 2025 to 2035
  8. Global Market Analysis 2020 to 2024 and Forecast 2025 to 2035, By Region
    • Introduction
    • Historical Market Size Value (USD Million) Analysis By Region, 2020 to 2024
    • Current Market Size Value (USD Million) Analysis and Forecast By Region, 2025 to 2035
      • North America
      • Latin America
      • Western Europe
      • Eastern Europe
      • East Asia
      • South Asia and Pacific
      • Middle East & Africa
    • Market Attractiveness Analysis By Region
  9. North America Market Analysis 2020 to 2024 and Forecast 2025 to 2035, By Country
    • Historical Market Size Value (USD Million) Trend Analysis By Market Taxonomy, 2020 to 2024
    • Market Size Value (USD Million) Forecast By Market Taxonomy, 2025 to 2035
      • By Country
        • USA
        • Canada
        • Mexico
      • By Classification
      • By Application
    • Market Attractiveness Analysis
      • By Country
      • By Classification
      • By Application
    • Key Takeaways
  10. Latin America Market Analysis 2020 to 2024 and Forecast 2025 to 2035, By Country
    • Historical Market Size Value (USD Million) Trend Analysis By Market Taxonomy, 2020 to 2024
    • Market Size Value (USD Million) Forecast By Market Taxonomy, 2025 to 2035
      • By Country
        • Brazil
        • Chile
        • Rest of Latin America
      • By Classification
      • By Application
    • Market Attractiveness Analysis
      • By Country
      • By Classification
      • By Application
    • Key Takeaways
  11. Western Europe Market Analysis 2020 to 2024 and Forecast 2025 to 2035, By Country
    • Historical Market Size Value (USD Million) Trend Analysis By Market Taxonomy, 2020 to 2024
    • Market Size Value (USD Million) Forecast By Market Taxonomy, 2025 to 2035
      • By Country
        • Germany
        • UK
        • Italy
        • Spain
        • France
        • Nordic
        • BENELUX
        • Rest of Western Europe
      • By Classification
      • By Application
    • Market Attractiveness Analysis
      • By Country
      • By Classification
      • By Application
    • Key Takeaways
  12. Eastern Europe Market Analysis 2020 to 2024 and Forecast 2025 to 2035, By Country
    • Historical Market Size Value (USD Million) Trend Analysis By Market Taxonomy, 2020 to 2024
    • Market Size Value (USD Million) Forecast By Market Taxonomy, 2025 to 2035
      • By Country
        • Russia
        • Poland
        • Hungary
        • Balkan & Baltic
        • Rest of Eastern Europe
      • By Classification
      • By Application
    • Market Attractiveness Analysis
      • By Country
      • By Classification
      • By Application
    • Key Takeaways
  13. East Asia Market Analysis 2020 to 2024 and Forecast 2025 to 2035, By Country
    • Historical Market Size Value (USD Million) Trend Analysis By Market Taxonomy, 2020 to 2024
    • Market Size Value (USD Million) Forecast By Market Taxonomy, 2025 to 2035
      • By Country
        • China
        • Japan
        • South Korea
      • By Classification
      • By Application
    • Market Attractiveness Analysis
      • By Country
      • By Classification
      • By Application
    • Key Takeaways
  14. South Asia and Pacific Market Analysis 2020 to 2024 and Forecast 2025 to 2035, By Country
    • Historical Market Size Value (USD Million) Trend Analysis By Market Taxonomy, 2020 to 2024
    • Market Size Value (USD Million) Forecast By Market Taxonomy, 2025 to 2035
      • By Country
        • India
        • ASEAN
        • Australia & New Zealand
        • Rest of South Asia and Pacific
      • By Classification
      • By Application
    • Market Attractiveness Analysis
      • By Country
      • By Classification
      • By Application
    • Key Takeaways
  15. Middle East & Africa Market Analysis 2020 to 2024 and Forecast 2025 to 2035, By Country
    • Historical Market Size Value (USD Million) Trend Analysis By Market Taxonomy, 2020 to 2024
    • Market Size Value (USD Million) Forecast By Market Taxonomy, 2025 to 2035
      • By Country
        • Kingdom of Saudi Arabia
        • Other GCC Countries
        • Turkiye
        • South Africa
        • Other African Union
        • Rest of Middle East & Africa
      • By Classification
      • By Application
    • Market Attractiveness Analysis
      • By Country
      • By Classification
      • By Application
    • Key Takeaways
  16. Key Countries Market Analysis
    • USA
      • Pricing Analysis
      • Market Share Analysis, 2024
        • By Classification
        • By Application
    • Canada
      • Pricing Analysis
      • Market Share Analysis, 2024
        • By Classification
        • By Application
    • Mexico
      • Pricing Analysis
      • Market Share Analysis, 2024
        • By Classification
        • By Application
    • Brazil
      • Pricing Analysis
      • Market Share Analysis, 2024
        • By Classification
        • By Application
    • Chile
      • Pricing Analysis
      • Market Share Analysis, 2024
        • By Classification
        • By Application
    • Germany
      • Pricing Analysis
      • Market Share Analysis, 2024
        • By Classification
        • By Application
    • UK
      • Pricing Analysis
      • Market Share Analysis, 2024
        • By Classification
        • By Application
    • Italy
      • Pricing Analysis
      • Market Share Analysis, 2024
        • By Classification
        • By Application
    • Spain
      • Pricing Analysis
      • Market Share Analysis, 2024
        • By Classification
        • By Application
    • France
      • Pricing Analysis
      • Market Share Analysis, 2024
        • By Classification
        • By Application
    • India
      • Pricing Analysis
      • Market Share Analysis, 2024
        • By Classification
        • By Application
    • ASEAN
      • Pricing Analysis
      • Market Share Analysis, 2024
        • By Classification
        • By Application
    • Australia & New Zealand
      • Pricing Analysis
      • Market Share Analysis, 2024
        • By Classification
        • By Application
    • China
      • Pricing Analysis
      • Market Share Analysis, 2024
        • By Classification
        • By Application
    • Japan
      • Pricing Analysis
      • Market Share Analysis, 2024
        • By Classification
        • By Application
    • South Korea
      • Pricing Analysis
      • Market Share Analysis, 2024
        • By Classification
        • By Application
    • Russia
      • Pricing Analysis
      • Market Share Analysis, 2024
        • By Classification
        • By Application
    • Poland
      • Pricing Analysis
      • Market Share Analysis, 2024
        • By Classification
        • By Application
    • Hungary
      • Pricing Analysis
      • Market Share Analysis, 2024
        • By Classification
        • By Application
    • Kingdom of Saudi Arabia
      • Pricing Analysis
      • Market Share Analysis, 2024
        • By Classification
        • By Application
    • Turkiye
      • Pricing Analysis
      • Market Share Analysis, 2024
        • By Classification
        • By Application
    • South Africa
      • Pricing Analysis
      • Market Share Analysis, 2024
        • By Classification
        • By Application
  17. Market Structure Analysis
    • Competition Dashboard
    • Competition Benchmarking
    • Market Share Analysis of Top Players
      • By Regional
      • By Classification
      • By Application
  18. Competition Analysis
    • Competition Deep Dive
      • Arora Aromatics Private Limited
        • Overview
        • Product Portfolio
        • Profitability by Market Segments (Product/Age /Sales Channel/Region)
        • Sales Footprint
        • Strategy Overview
          • Marketing Strategy
          • Product Strategy
          • Channel Strategy
      • Norex Flavours
      • Citrus Oleo
      • Kelvin Natural Mint Pvt. Ltd.
      • Ganpati Agri Business Pvt. Ltd.
      • Silverline Chemicals
      • Vdh Organics Pvt. Ltd.
      • Hindustan Mint & Agro
      • F&F International
  19. Assumptions & Acronyms Used
  20. Research Methodology

List of Tables

  • Table 1: Global Market Value (USD Million) Forecast by Region, 2020 to 2035
  • Table 2: Global Market Value (USD Million) Forecast by Classification , 2020 to 2035
  • Table 3: Global Market Value (USD Million) Forecast by Application, 2020 to 2035
  • Table 4: North America Market Value (USD Million) Forecast by Country, 2020 to 2035
  • Table 5: North America Market Value (USD Million) Forecast by Classification , 2020 to 2035
  • Table 6: North America Market Value (USD Million) Forecast by Application, 2020 to 2035
  • Table 7: Latin America Market Value (USD Million) Forecast by Country, 2020 to 2035
  • Table 8: Latin America Market Value (USD Million) Forecast by Classification , 2020 to 2035
  • Table 9: Latin America Market Value (USD Million) Forecast by Application, 2020 to 2035
  • Table 10: Western Europe Market Value (USD Million) Forecast by Country, 2020 to 2035
  • Table 11: Western Europe Market Value (USD Million) Forecast by Classification , 2020 to 2035
  • Table 12: Western Europe Market Value (USD Million) Forecast by Application, 2020 to 2035
  • Table 13: Eastern Europe Market Value (USD Million) Forecast by Country, 2020 to 2035
  • Table 14: Eastern Europe Market Value (USD Million) Forecast by Classification , 2020 to 2035
  • Table 15: Eastern Europe Market Value (USD Million) Forecast by Application, 2020 to 2035
  • Table 16: East Asia Market Value (USD Million) Forecast by Country, 2020 to 2035
  • Table 17: East Asia Market Value (USD Million) Forecast by Classification , 2020 to 2035
  • Table 18: East Asia Market Value (USD Million) Forecast by Application, 2020 to 2035
  • Table 19: South Asia and Pacific Market Value (USD Million) Forecast by Country, 2020 to 2035
  • Table 20: South Asia and Pacific Market Value (USD Million) Forecast by Classification , 2020 to 2035
  • Table 21: South Asia and Pacific Market Value (USD Million) Forecast by Application, 2020 to 2035
  • Table 22: Middle East & Africa Market Value (USD Million) Forecast by Country, 2020 to 2035
  • Table 23: Middle East & Africa Market Value (USD Million) Forecast by Classification , 2020 to 2035
  • Table 24: Middle East & Africa Market Value (USD Million) Forecast by Application, 2020 to 2035

List of Figures

  • Figure 1: Global Market Pricing Analysis
  • Figure 2: Global Market Value (USD Million) Forecast 2020-2035
  • Figure 3: Global Market Value Share and BPS Analysis by Classification , 2025 and 2035
  • Figure 4: Global Market Y to o to Y Growth Comparison by Classification , 2025-2035
  • Figure 5: Global Market Attractiveness Analysis by Classification
  • Figure 6: Global Market Value Share and BPS Analysis by Application, 2025 and 2035
  • Figure 7: Global Market Y to o to Y Growth Comparison by Application, 2025-2035
  • Figure 8: Global Market Attractiveness Analysis by Application
  • Figure 9: Global Market Value (USD Million) Share and BPS Analysis by Region, 2025 and 2035
  • Figure 10: Global Market Y to o to Y Growth Comparison by Region, 2025-2035
  • Figure 11: Global Market Attractiveness Analysis by Region
  • Figure 12: North America Market Incremental Dollar Opportunity, 2025-2035
  • Figure 13: Latin America Market Incremental Dollar Opportunity, 2025-2035
  • Figure 14: Western Europe Market Incremental Dollar Opportunity, 2025-2035
  • Figure 15: Eastern Europe Market Incremental Dollar Opportunity, 2025-2035
  • Figure 16: East Asia Market Incremental Dollar Opportunity, 2025-2035
  • Figure 17: South Asia and Pacific Market Incremental Dollar Opportunity, 2025-2035
  • Figure 18: Middle East & Africa Market Incremental Dollar Opportunity, 2025-2035
  • Figure 19: North America Market Value Share and BPS Analysis by Country, 2025 and 2035
  • Figure 20: North America Market Value Share and BPS Analysis by Classification , 2025 and 2035
  • Figure 21: North America Market Y to o to Y Growth Comparison by Classification , 2025-2035
  • Figure 22: North America Market Attractiveness Analysis by Classification
  • Figure 23: North America Market Value Share and BPS Analysis by Application, 2025 and 2035
  • Figure 24: North America Market Y to o to Y Growth Comparison by Application, 2025-2035
  • Figure 25: North America Market Attractiveness Analysis by Application
  • Figure 26: Latin America Market Value Share and BPS Analysis by Country, 2025 and 2035
  • Figure 27: Latin America Market Value Share and BPS Analysis by Classification , 2025 and 2035
  • Figure 28: Latin America Market Y to o to Y Growth Comparison by Classification , 2025-2035
  • Figure 29: Latin America Market Attractiveness Analysis by Classification
  • Figure 30: Latin America Market Value Share and BPS Analysis by Application, 2025 and 2035
  • Figure 31: Latin America Market Y to o to Y Growth Comparison by Application, 2025-2035
  • Figure 32: Latin America Market Attractiveness Analysis by Application
  • Figure 33: Western Europe Market Value Share and BPS Analysis by Country, 2025 and 2035
  • Figure 34: Western Europe Market Value Share and BPS Analysis by Classification , 2025 and 2035
  • Figure 35: Western Europe Market Y to o to Y Growth Comparison by Classification , 2025-2035
  • Figure 36: Western Europe Market Attractiveness Analysis by Classification
  • Figure 37: Western Europe Market Value Share and BPS Analysis by Application, 2025 and 2035
  • Figure 38: Western Europe Market Y to o to Y Growth Comparison by Application, 2025-2035
  • Figure 39: Western Europe Market Attractiveness Analysis by Application
  • Figure 40: Eastern Europe Market Value Share and BPS Analysis by Country, 2025 and 2035
  • Figure 41: Eastern Europe Market Value Share and BPS Analysis by Classification , 2025 and 2035
  • Figure 42: Eastern Europe Market Y to o to Y Growth Comparison by Classification , 2025-2035
  • Figure 43: Eastern Europe Market Attractiveness Analysis by Classification
  • Figure 44: Eastern Europe Market Value Share and BPS Analysis by Application, 2025 and 2035
  • Figure 45: Eastern Europe Market Y to o to Y Growth Comparison by Application, 2025-2035
  • Figure 46: Eastern Europe Market Attractiveness Analysis by Application
  • Figure 47: East Asia Market Value Share and BPS Analysis by Country, 2025 and 2035
  • Figure 48: East Asia Market Value Share and BPS Analysis by Classification , 2025 and 2035
  • Figure 49: East Asia Market Y to o to Y Growth Comparison by Classification , 2025-2035
  • Figure 50: East Asia Market Attractiveness Analysis by Classification
  • Figure 51: East Asia Market Value Share and BPS Analysis by Application, 2025 and 2035
  • Figure 52: East Asia Market Y to o to Y Growth Comparison by Application, 2025-2035
  • Figure 53: East Asia Market Attractiveness Analysis by Application
  • Figure 54: South Asia and Pacific Market Value Share and BPS Analysis by Country, 2025 and 2035
  • Figure 55: South Asia and Pacific Market Value Share and BPS Analysis by Classification , 2025 and 2035
  • Figure 56: South Asia and Pacific Market Y to o to Y Growth Comparison by Classification , 2025-2035
  • Figure 57: South Asia and Pacific Market Attractiveness Analysis by Classification
  • Figure 58: South Asia and Pacific Market Value Share and BPS Analysis by Application, 2025 and 2035
  • Figure 59: South Asia and Pacific Market Y to o to Y Growth Comparison by Application, 2025-2035
  • Figure 60: South Asia and Pacific Market Attractiveness Analysis by Application
  • Figure 61: Middle East & Africa Market Value Share and BPS Analysis by Country, 2025 and 2035
  • Figure 62: Middle East & Africa Market Value Share and BPS Analysis by Classification , 2025 and 2035
  • Figure 63: Middle East & Africa Market Y to o to Y Growth Comparison by Classification , 2025-2035
  • Figure 64: Middle East & Africa Market Attractiveness Analysis by Classification
  • Figure 65: Middle East & Africa Market Value Share and BPS Analysis by Application, 2025 and 2035
  • Figure 66: Middle East & Africa Market Y to o to Y Growth Comparison by Application, 2025-2035
  • Figure 67: Middle East & Africa Market Attractiveness Analysis by Application
  • Figure 68: Global Market - Tier Structure Analysis
  • Figure 69: Global Market - Company Share Analysis

Frequently Asked Questions

How big is the l-limonene oil market in 2025?

The global l-limonene oil market is estimated to be valued at USD 185.3 million in 2025.

What will be the size of l-limonene oil market in 2035?

The market size for the l-limonene oil market is projected to reach USD 304.7 million by 2035.

How much will be the l-limonene oil market growth between 2025 and 2035?

The l-limonene oil market is expected to grow at a 5.1% CAGR between 2025 and 2035.

What are the key product types in the l-limonene oil market?

The key product types in l-limonene oil market are purity 90%-95%, purity ≥97% and purity ≥99%.

Which application segment to contribute significant share in the l-limonene oil market in 2025?

In terms of application, food flavorings segment to command 52.0% share in the l-limonene oil market in 2025.

Explore Similar Insights

Future Market Insights

L-Limonene Oil Market

Chat With

MaRIA

Hi There, I am MaRIA, Your Market Research Intelligence Assistant. How may I help you?