Mesquite Flour Market Forecast and Outlook 2025 to 2035

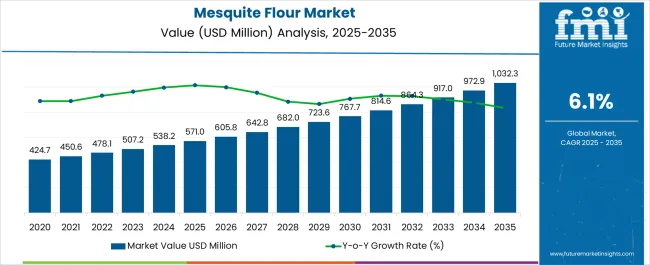
The mesquite flour market is estimated to be valued at USD 571 million in 2025. It is projected to reach USD 1,032.3 million by 2035, registering a CAGR of 6.1% over the forecast period. The market is expected to add an absolute dollar opportunity of USD 461.3 million over the forecast period.

Quick Stats for Mesquite Flour Market

  • Mesquite Flour Market Value (2025): USD 571 million
  • Mesquite Flour Market Forecast Value (2035): USD 1,032.3 million
  • Mesquite Flour Market Forecast CAGR: 6.1%
  • Leading Segment in Mesquite Flour Market in 2025: Bakery Products (40% market share)
  • Key Growth Regions in Mesquite Flour Market: North America, Europe, Asia-Pacific
  • Top Key Players in Mesquite Flour Market: San Xavier Co-op Farm, MRM, The Mesquitery, Casa Del Mesquite, Zint, Desert Harvesters, Food Conspiracy Co-op, Native Seeds/SEARCH, Skeleton Creek, Z Natural Foods, Health Link, Terrasoul Superfoods, Sunfood Super Foods, NatavaSuperFoods

Mesquite Flour Market

Metric Value
Estimated Size (2025E) USD 571 million
Projected Value (2035F) USD 1,032.3 million
CAGR (2025 to 2035) 6.1%

This reflects a 1.81 times growth at a CAGR of 6.1%. Rising demand for gluten-free and nutrient-rich alternative flours in the baking and food processing industries is anticipated to drive market growth.

By 2030, the market is likely to reach USD 767.7million, accounting for USD 196.7million in incremental value over the first half of the decade at a CAGR of 6.1%. The remaining USD 264.6 million is expected during the second half, suggesting a moderately balanced growth trajectory.

Companies such as Bob’s Red Mill and King Arthur Baking Company are strengthening their competitive positions through product innovation and expanding distribution channels. Investments in responsible sourcing and organic certifications are supporting growth, while partnerships with health food retailers are expanding market reach. Regulatory adherence and quality standards will continue to influence market dynamics.

The market holds a relatively small yet vital share within its parent industries, accounting for around 0.04% of the global food and beverages sector, driven by demand in functional foods, beverages, and processed products. In the pharmaceutical industry, it captures approximately 2.5%, primarily in oral formulations and pediatric medicines. Within nutraceuticals and dietary supplements, it represents about 3.8%, reflecting its importance in improving palatability. In personal care and cosmetics, its share is close to 1.5%, used in oral care products. Animal feed accounts for nearly 2%, helping mask unpalatable ingredients in livestock and pet nutrition.

The market is witnessing steady growth, driven by rising consumer preference for gluten-free and nutrient-rich foods. Increasing awareness of its low glycemic index and sustainable production practices is boosting adoption among health-conscious buyers. Product innovations, such as blends with ancient grains and incorporation into bakery, snacks, and beverage applications, are expanding its reach. Additionally, growing demand for clean-label and plant-based ingredients is encouraging manufacturers to invest in mesquite-based product lines. Regulatory approvals for food safety, coupled with organic certifications, are further enhancing consumer trust and enabling wider market penetration across global retail, specialty, and online distribution channels.

Why is the Mesquite Flour Market Growing?

The mesquite flour market is experiencing significant growth due to its exceptional nutritional benefits and increasing consumer focus on health and wellness. Being naturally gluten-free and rich in dietary fiber, protein, and antioxidants, mesquite flour has become a preferred choice for those seeking nutritious alternatives in bakery, snacks, and beverage products. The rising prevalence of gluten intolerance and diabetes has further accelerated its demand, as the flour offers a low glycemic index that supports blood sugar management.

In addition, the surge in clean-label and organic food trends has encouraged manufacturers to incorporate mesquite flour into their product lines. The sustainability aspect of mesquite trees, which require minimal water and thrive in arid environments, aligns well with growing environmental concerns. Innovation in product formulations and expanded distribution networks has also played a key role in broadening the market reach, ensuring mesquite flour’s presence across health-conscious and specialty food sectors worldwide.

Segmental Analysis

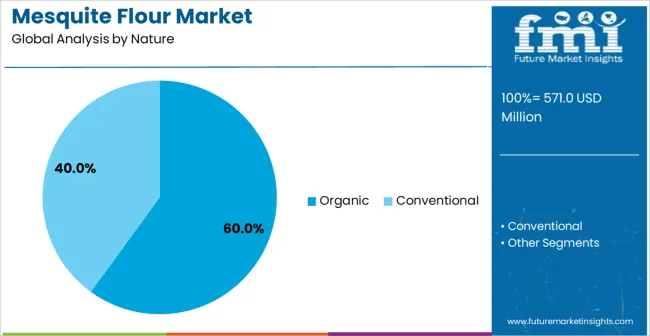
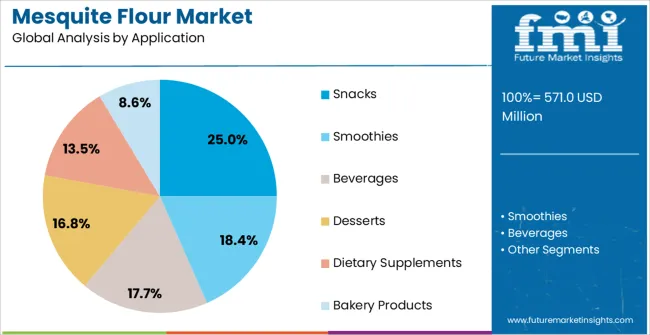
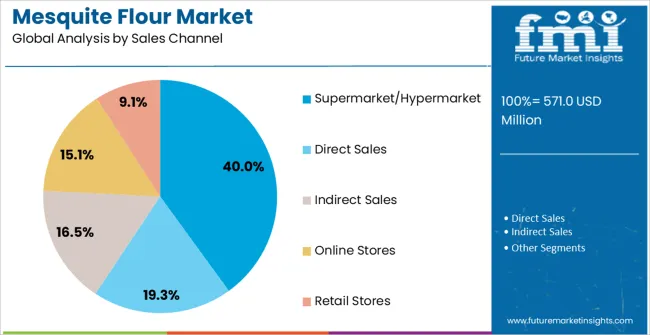
The market is segmented into nature, application, sales channels, and region. By nature, the market is bifurcated into organic and conventional. Based on application, the market is divided into smoothies, beverages, desserts, snacks, dietary supplements, and bakery products. In terms of sales channels, the market is classified into direct sales, indirect sales, supermarket/hypermarket, online stores, and retail stores. Regionally, the market is categorized into North America, Latin America, Europe, East Asia, South Asia, Oceania, the Middle East & Africa.

By Application, Bakery Products Segment Accounts for 40% of the Market Share

Mesquite Flour Market By Application

The bakery products segment holds a dominant position with 40% of the market share in the application category, driven by the increasing use of mesquite flour in gluten-free breads, cookies, and cakes. Its high fiber and protein content appeals to health-conscious consumers seeking nutrient-rich alternatives to wheat flour. The natural sweetness and functional properties of mesquite flour reduce the need for added sugars and fats, improving the nutritional profile of baked goods. Demand for clean-label and allergen-free bakery items is accelerating adoption, with manufacturers innovating new products to meet dietary trends. The premiumization of gluten-free baked goods is also contributing to sustained growth in this segment.

The bakery products segment benefits from rising consumer awareness about digestive health and plant-based diets. Its functional versatility allows integration into various baked goods without compromising texture or flavor. Expansion of distribution networks and product innovation are expected to drive further market share gains.

By Sales Channel, Supermarket/Hypermarket Segment Accounts for 37% of the Market Share

Mesquite Flour Market By Sales

The supermarket/hypermarket segment commands 37% of the sales channel share, owing to its wide consumer reach and trusted shopping environment. These retail formats provide consumers with convenient access to a broad range of mesquite flour products, including organic and blended variants. The availability of promotional campaigns and private-label products in supermarkets has enhanced product visibility and consumer trial. Supermarkets and hypermarkets are also investing in dedicated health food aisles that feature gluten-free and alternative flours, supporting mesquite flour’s growth.

Expanding health and wellness trends, combined with increasing demand for specialty ingredients in mainstream retail, underpin this segment’s prominence. Collaborations between manufacturers and retailers to develop exclusive product offerings are further strengthening market penetration through these channels.

What are the Drivers, Restraints, and Key Trends of the Mesquite Flour Market?

In 2024, the global mesquite flour market witnessed significant growth driven by increasing consumer awareness of gluten-free and nutrient-dense food options. Key applications include bakery and snack products utilizing plant-based, high-fiber, and protein-rich ingredients. Manufacturers are innovating with blends and organic-certified products to expand usage, supported by growing distribution through supermarkets and online retail channels. Mesquite flour’s natural sweetness, low glycemic index, and antioxidant properties make it a preferred choice among health-conscious consumers and individuals with dietary restrictions such as diabetes and celiac disease.

Health and Wellness Trends Propel Mesquite Flour Adoption

Consumers are increasingly seeking clean-label, functional ingredients that enhance nutrition without compromising taste, fueling demand for mesquite flour. Its gluten-free and sustainable attributes appeal to environmentally conscious buyers, while versatility in baking and beverages broadens market penetration. Innovations in processing technology improve texture and flavor profiles, enabling product diversification. Additionally, government initiatives promoting alternative crops and sustainable agriculture are positively impacting mesquite flour supply and production, reinforcing its market position.

Supply Chain Constraints, Competition, and Processing Challenges Limit Growth

Despite strong growth, the market faces restraints from limited consumer awareness in some regions and competition from established alternative flours such as almond and coconut. Processing complexities related to taste masking and flour standardization increase production costs. Supply chain challenges include seasonal availability of mesquite pods and variable raw material quality, limiting large-scale manufacturing. Price sensitivity among certain consumer segments and regulatory hurdles in new markets also slow rapid expansion. Addressing these issues through education, quality control, and supply chain optimization will be critical for sustained growth.

Mesquite Flour Market Analysis by Top Countries

Mesquite Flour Market By Country

Countries CAGR (2025 to 2035)
USA 6.1%
France 5.5%
Germany 4.8%
Japan 4.5%
UK 1.1%

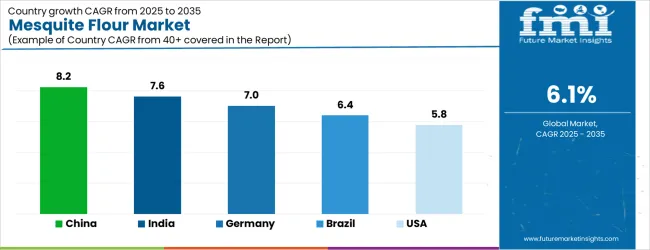
The mesquite flour market is expected to grow at varying rates across major countries between 2025 and 2035. The USA leads with a robust CAGR of 6.1%, driven by domestic demand and native crop availability. France follows with a strong CAGR of 5.5%, supported by growing interest in specialty gluten-free flours. Germany and Japan share similar growth trajectories at 4.8% and 4.5% respectively, reflecting regional trends in health foods and alternative flours. The UK shows more modest growth at 1.1%, constrained by mature flour markets and slower gluten-free adoption. Overall, the USA and France are positioned as growth engines in the mesquite flour landscape, while Germany and Japan represent steady, innovation-driven markets. The UK’s slower pace highlights market-specific challenges despite increasing awareness.

The report covers an in-depth analysis of 40+ countries; five top-performing OECD countries are highlighted below.

Market Expansion in the Mesquite Flour Market in the United States

The mesquite flour market in the USA is projected to grow at a CAGR of 6.1% from 2025 to 2035, supported by the country’s leadership in both production and consumption. Increasing demand for gluten-free, nutrient-dense, and sustainable food ingredients in health-conscious regions like California, Texas, and Arizona underpins growth. USA manufacturers are investing in organic certifications and product innovation, expanding applications in bakery, snacks, and beverages. The native presence of mesquite trees facilitates supply chain stability and cost advantages.

Key Statistics

  • 40% share of mesquite flour in the US gluten-free flour market in 2025
  • $500 million investment planned in mesquite processing technologies by 2027
  • Expansion of mesquite flour products in mainstream retail outlets by 35% annually

Growth Trajectory of Mesquite Flour Market in France

Sales of mesquite flour in France are expected to flourish at a CAGR of 5.5% through 2035, driven by strong consumer demand for specialty and artisanal gluten-free flours. Regions like Paris, Lyon, and Bordeaux have witnessed rising bakery innovation leveraging mesquite flour’s nutritional profile. The growing premium food sector and the growing demand for organic products support this expansion. Regulatory support for alternative crops and food quality standards also facilitates market penetration.

Key Statistics

  • 30% of specialty flour market share occupied by mesquite flour in 2025
  • 25% annual growth in artisan bakery applications incorporating mesquite flour
  • 45 partnership agreements between flour producers and retail chains by 2026

Innovation Leadership in the Mesquite Flour Market in Germany

Revenue from mesquite flour in Germany is anticipated to expand at a CAGR of 4.8% from 2025 to 2035, driven by functional food trends and clean-label ingredient demand. Major cities such as Berlin, Hamburg, and Frankfurt are hubs for product development and premium bakery goods utilizing mesquite flour. Partnerships between food technologists and agricultural producers are improving supply consistency and quality. German consumer preference for plant-based and health-oriented products fuels steady market expansion.

Key Statistics

  • 35% mesquite flour product adoption in clean-label bakery items in 2025
  • 60% increase in production capacity for specialty flours by 2028
  • 20% growth in export volume of mesquite flour products in 2027

Market Development in the Mesquite Flour Market in Japan

Demand for mesquite flour in Japan is poised to rise at a CAGR of 4.5% over the next decade, supported by increasing interest in alternative flours and plant-based nutrition. Urban centers such as Tokyo, Osaka, and Nagoya are driving demand for gluten-free baked goods and health supplements. The aging population and preference for low-glycemic foods enhance mesquite flour’s appeal. Japanese manufacturers focus on blending mesquite flour with traditional grains to optimize taste and nutrition.

Key Statistics

  • 28% of the alternative flour market share held by mesquite flour in 2025
  • 15% annual increase in product launches featuring mesquite flour
  • $150 million revenue generated from mesquite-based bakery products in 2025

Growth Assessment for Mesquite Flour Market in the United Kingdom

The mesquite flour market in the UK is expected to grow modestly at a CAGR of 1.1% from 2025 to 2035, reflecting mature flour markets and slower gluten-free adoption rates. While consumer interest in health and nutrition grows, competition from established flours and pricing challenges limit rapid expansion. London, Manchester, and Edinburgh are key urban markets where niche artisanal bakery and health food sectors are promoting mesquite flour. Government nutrition campaigns supporting alternative grains may enhance growth prospects.

Key Statistics

  • 10% penetration of mesquite flour in the gluten-free bakery segment in 2025
  • 8% annual growth in health food retail availability
  • 5 new product launches incorporating mesquite flour are expected annually through 2030

Competitive Landscape of the Mesquite Flour Market

Mesquite Flour Market By Company

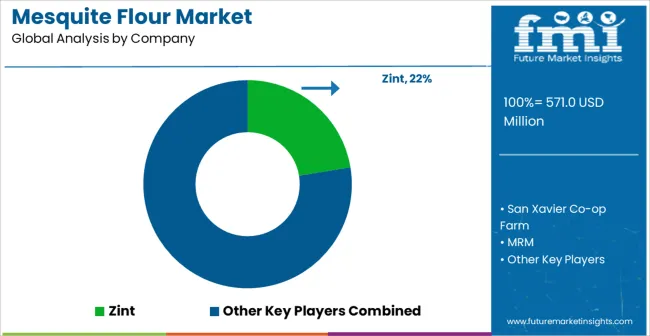
The mesquite flour market is moderately consolidated, comprising a blend of global ingredient suppliers, regional producers, and niche companies specializing in gluten-free and organic flours. Key players such as Bob’s Red Mill, King Arthur Baking Company and The Mesquite Company lead the market by offering certified organic and sustainably sourced mesquite flour. Their competitive advantage is rooted in established supply chains, product quality certifications, and extensive distribution networks that include mainstream retail and health food specialty stores. These companies focus on innovation through product diversification and expanding mesquite flour applications in bakery, snacks, and beverages.

Regional players and emerging producers emphasize sustainability, local sourcing, and traditional processing methods, catering to niche markets in North America, Latin America, and parts of Asia-Pacific. Strategic partnerships with agricultural cooperatives and investments in processing technologies aimed at improving taste and texture are helping smaller manufacturers increase market share. Private-label brands by major supermarkets also contribute to competitive dynamics by offering cost-effective alternatives that drive consumer adoption.

Barriers to entry remain notable due to the need for consistent raw material supply, quality standardization, and regulatory compliance related to gluten-free and organic certifications. Competitive advantage is increasingly tied to the ability to innovate with product formulations, maintain traceability in supply chains, and navigate regional food safety regulations. With growing consumer demand for sustainable and nutrient-rich alternative flours, companies investing in research and sustainable sourcing are well-positioned for long-term success in the mesquite flour market.

Scope of Report

Item Value
Quantitative Units USD 571 million
Nature Organic and Conventional
Application Smoothies, Beverages, Desserts, Snacks, Dietary Supplements, Bakery Products
Sales Channel Direct Sales/B2B, Indirect Sales/B2C, Intermediate/Bulk Distributors, Brick & Mortar Retailers, Online Retailers
Regions Covered North America, Latin America, Europe, East Asia, South Asia, Oceania, Middle East & Africa
Countries Covered United States, Canada, United Kingdom, Germany, France, China, Japan, South Korea, Brazil, Australia and 40+ countries
Key Companies Profiled San Xavier Co-op Farm, MRM, The Mesquitery, Casa Del Mesquite, Zint, Desert Harvesters, Food Conspiracy Co-op, Native Seeds/SEARCH, Skeleton Creek, Z Natural Foods, Health Link, Terrasoul Superfoods, Sunfood Super Foods, Natava SuperFoods
Additional Attributes Dollar sales by application and product type, regional demand trends, competitive landscape, consumer preferences for organic and sustainable ingredients, innovations in processing technology, and quality standardization for food and nutraceutical applications

Key Segments

By Nature:

  • Conventional
  • Organic

By Application:

  • Smoothies
  • Beverages
  • Desserts
  • Snacks
  • Dietary Supplements
  • Bakery Products

By Sales Channel:

  • Direct Sales
  • Indirect Sales
  • Supermarket/Hypermarket
  • Online Stores
  • Retail Stores

By Region:

  • North America
  • Latin America
  • Western Europe
  • Eastern Europe
  • East Asia
  • South Asia & Pacific
  • Middle East and Africa

Table of Content

  1. Executive Summary
    • Global Market Outlook
    • Demand-side Trends
    • Supply-side Trends
    • Technology Roadmap Analysis
    • Analysis and Recommendations
  2. Market Overview
    • Market Coverage / Taxonomy
    • Market Definition / Scope / Limitations
  3. Market Background
    • Market Dynamics
      • Drivers
      • Restraints
      • Opportunity
      • Trends
    • Scenario Forecast
      • Demand in Optimistic Scenario
      • Demand in Likely Scenario
      • Demand in Conservative Scenario
    • Opportunity Map Analysis
    • Product Life Cycle Analysis
    • Supply Chain Analysis
      • Supply Side Participants and their Roles
        • Producers
        • Mid-Level Participants (Traders/ Agents/ Brokers)
        • Wholesalers and Distributors
      • Value Added and Value Created at Node in the Supply Chain
      • List of Raw Material Suppliers
      • List of Existing and Potential Buyer’s
    • Investment Feasibility Matrix
    • Value Chain Analysis
      • Profit Margin Analysis
      • Wholesalers and Distributors
      • Retailers
    • PESTLE and Porter’s Analysis
    • Regulatory Landscape
      • By Key Regions
      • By Key Countries
    • Regional Parent Market Outlook
    • Production and Consumption Statistics
    • Import and Export Statistics
  4. Global Market Analysis 2020 to 2024 and Forecast, 2025 to 2035
    • Historical Market Size Value (USD Million) & Volume (Metric Tons) Analysis, 2020 to 2024
    • Current and Future Market Size Value (USD Million) & Volume (Metric Tons) Projections, 2025 to 2035
      • Y-o-Y Growth Trend Analysis
      • Absolute $ Opportunity Analysis
  5. Global Market Pricing Analysis 2020 to 2024 and Forecast 2025 to 2035
  6. Global Market Analysis 2020 to 2024 and Forecast 2025 to 2035, By Nature
    • Introduction / Key Findings
    • Historical Market Size Value (USD Million) & Volume (Metric Tons) Analysis By Nature, 2020 to 2024
    • Current and Future Market Size Value (USD Million) & Volume (Metric Tons) Analysis and Forecast By Nature, 2025 to 2035
      • Conventional
      • Organic
    • Y-o-Y Growth Trend Analysis By Nature, 2020 to 2024
    • Absolute $ Opportunity Analysis By Nature, 2025 to 2035
  7. Global Market Analysis 2020 to 2024 and Forecast 2025 to 2035, By Application
    • Introduction / Key Findings
    • Historical Market Size Value (USD Million) & Volume (Metric Tons) Analysis By Application, 2020 to 2024
    • Current and Future Market Size Value (USD Million) & Volume (Metric Tons) Analysis and Forecast By Application, 2025 to 2035
      • Smoothies
      • Beverages
      • Desserts
      • Snacks
      • Dietary Supplements
      • Bakery Products
    • Y-o-Y Growth Trend Analysis By Application, 2020 to 2024
    • Absolute $ Opportunity Analysis By Application, 2025 to 2035
  8. Global Market Analysis 2020 to 2024 and Forecast 2025 to 2035, By Sales Channel
    • Introduction / Key Findings
    • Historical Market Size Value (USD Million) & Volume (Metric Tons) Analysis By Sales Channel, 2020 to 2024
    • Current and Future Market Size Value (USD Million) & Volume (Metric Tons) Analysis and Forecast By Sales Channel, 2025 to 2035
      • Direct Sales
      • Indirect Sales
      • Supermarket/Hypermarket
      • Online Stores
      • Retail Stores
    • Y-o-Y Growth Trend Analysis By Sales Channel, 2020 to 2024
    • Absolute $ Opportunity Analysis By Sales Channel, 2025 to 2035
  9. Global Market Analysis 2020 to 2024 and Forecast 2025 to 2035, By Region
    • Introduction
    • Historical Market Size Value (USD Million) & Volume (Metric Tons) Analysis By Region, 2020 to 2024
    • Current Market Size Value (USD Million) & Volume (Metric Tons) Analysis and Forecast By Region, 2025 to 2035
      • North America
      • Latin America
      • Western Europe
      • Eastern Europe
      • East Asia
      • South Asia & Pacific
      • Middle East and Africa
    • Market Attractiveness Analysis By Region
  10. North America Market Analysis 2020 to 2024 and Forecast 2025 to 2035, By Country
    • Historical Market Size Value (USD Million) & Volume (Metric Tons) Trend Analysis By Market Taxonomy, 2020 to 2024
    • Market Size Value (USD Million) & Volume (Metric Tons) Forecast By Market Taxonomy, 2025 to 2035
      • By Country
        • USA
        • Canada
        • Mexico
      • By Nature
      • By Application
      • By Sales Channel
    • Market Attractiveness Analysis
      • By Country
      • By Nature
      • By Application
      • By Sales Channel
    • Key Takeaways
  11. Latin America Market Analysis 2020 to 2024 and Forecast 2025 to 2035, By Country
    • Historical Market Size Value (USD Million) & Volume (Metric Tons) Trend Analysis By Market Taxonomy, 2020 to 2024
    • Market Size Value (USD Million) & Volume (Metric Tons) Forecast By Market Taxonomy, 2025 to 2035
      • By Country
        • Brazil
        • Argentina
        • Rest of LATAM
      • By Nature
      • By Application
      • By Sales Channel
    • Market Attractiveness Analysis
      • By Country
      • By Nature
      • By Application
      • By Sales Channel
    • Key Takeaways
  12. Western Europe Market Analysis 2020 to 2024 and Forecast 2025 to 2035, By Country
    • Historical Market Size Value (USD Million) & Volume (Metric Tons) Trend Analysis By Market Taxonomy, 2020 to 2024
    • Market Size Value (USD Million) & Volume (Metric Tons) Forecast By Market Taxonomy, 2025 to 2035
      • By Country
        • Germany
        • Italy
        • France
        • UK
        • Spain
        • BENELUX
        • Nordic
        • Rest of W.Europe
      • By Nature
      • By Application
      • By Sales Channel
    • Market Attractiveness Analysis
      • By Country
      • By Nature
      • By Application
      • By Sales Channel
    • Key Takeaways
  13. Eastern Europe Market Analysis 2020 to 2024 and Forecast 2025 to 2035, By Country
    • Historical Market Size Value (USD Million) & Volume (Metric Tons) Trend Analysis By Market Taxonomy, 2020 to 2024
    • Market Size Value (USD Million) & Volume (Metric Tons) Forecast By Market Taxonomy, 2025 to 2035
      • By Country
        • Russia
        • Hungary
        • Poland
        • Balkan & Baltics
        • Rest of E. Europe
      • By Nature
      • By Application
      • By Sales Channel
    • Market Attractiveness Analysis
      • By Country
      • By Nature
      • By Application
      • By Sales Channel
    • Key Takeaways
  14. East Asia Market Analysis 2020 to 2024 and Forecast 2025 to 2035, By Country
    • Historical Market Size Value (USD Million) & Volume (Metric Tons) Trend Analysis By Market Taxonomy, 2020 to 2024
    • Market Size Value (USD Million) & Volume (Metric Tons) Forecast By Market Taxonomy, 2025 to 2035
      • By Country
        • China
        • Japan
        • South Korea
      • By Nature
      • By Application
      • By Sales Channel
    • Market Attractiveness Analysis
      • By Country
      • By Nature
      • By Application
      • By Sales Channel
    • Key Takeaways
  15. South Asia & Pacific Market Analysis 2020 to 2024 and Forecast 2025 to 2035, By Country
    • Historical Market Size Value (USD Million) & Volume (Metric Tons) Trend Analysis By Market Taxonomy, 2020 to 2024
    • Market Size Value (USD Million) & Volume (Metric Tons) Forecast By Market Taxonomy, 2025 to 2035
      • By Country
        • India
        • Australia & New Zealand
        • ASEAN
        • Rest of SAP
      • By Nature
      • By Application
      • By Sales Channel
    • Market Attractiveness Analysis
      • By Country
      • By Nature
      • By Application
      • By Sales Channel
    • Key Takeaways
  16. Middle East and Africa Market Analysis 2020 to 2024 and Forecast 2025 to 2035, By Country
    • Historical Market Size Value (USD Million) & Volume (Metric Tons) Trend Analysis By Market Taxonomy, 2020 to 2024
    • Market Size Value (USD Million) & Volume (Metric Tons) Forecast By Market Taxonomy, 2025 to 2035
      • By Country
        • GCC Countries
        • Northern Africa
        • South Africa
        • Turkiye
        • Rest of MEA
      • By Nature
      • By Application
      • By Sales Channel
    • Market Attractiveness Analysis
      • By Country
      • By Nature
      • By Application
      • By Sales Channel
    • Key Takeaways
  17. Key Countries Market Analysis
    • USA
      • Pricing Analysis
      • Market Share Analysis, 2024
        • By Nature
        • By Application
        • By Sales Channel
    • Canada
      • Pricing Analysis
      • Market Share Analysis, 2024
        • By Nature
        • By Application
        • By Sales Channel
    • Brazil
      • Pricing Analysis
      • Market Share Analysis, 2024
        • By Nature
        • By Application
        • By Sales Channel
    • Mexico
      • Pricing Analysis
      • Market Share Analysis, 2024
        • By Nature
        • By Application
        • By Sales Channel
    • Argentina
      • Pricing Analysis
      • Market Share Analysis, 2024
        • By Nature
        • By Application
        • By Sales Channel
  18. Market Structure Analysis
    • Competition Dashboard
    • Competition Benchmarking
    • Market Share Analysis of Top Players
      • By Regional
      • By Nature
      • By Application
      • By Sales Channel
  19. Competition Analysis
    • Competition Deep Dive
      • San Xavier Co-op Farm
        • Overview
        • Product Portfolio
        • Profitability by Market Segments (Product/Age /Sales Channel/Region)
        • Sales Footprint
        • Strategy Overview
          • Marketing Strategy
          • Product Strategy
          • Channel Strategy
      • MRM
        • Overview
        • Product Portfolio
        • Profitability by Market Segments (Product/Age /Sales Channel/Region)
        • Sales Footprint
        • Strategy Overview
          • Marketing Strategy
          • Product Strategy
          • Channel Strategy
      • The Mesquitery
        • Overview
        • Product Portfolio
        • Profitability by Market Segments (Product/Age /Sales Channel/Region)
        • Sales Footprint
        • Strategy Overview
          • Marketing Strategy
          • Product Strategy
          • Channel Strategy
      • Casa Del Mesquite
        • Overview
        • Product Portfolio
        • Profitability by Market Segments (Product/Age /Sales Channel/Region)
        • Sales Footprint
        • Strategy Overview
          • Marketing Strategy
          • Product Strategy
          • Channel Strategy
      • Zint
        • Overview
        • Product Portfolio
        • Profitability by Market Segments (Product/Age /Sales Channel/Region)
        • Sales Footprint
        • Strategy Overview
          • Marketing Strategy
          • Product Strategy
          • Channel Strategy
      • Desert Harvesters
        • Overview
        • Product Portfolio
        • Profitability by Market Segments (Product/Age /Sales Channel/Region)
        • Sales Footprint
        • Strategy Overview
          • Marketing Strategy
          • Product Strategy
          • Channel Strategy
      • Food Conspiracy Co-op.
        • Overview
        • Product Portfolio
        • Profitability by Market Segments (Product/Age /Sales Channel/Region)
        • Sales Footprint
        • Strategy Overview
          • Marketing Strategy
          • Product Strategy
          • Channel Strategy
      • Native Seeds/SEARCH
        • Overview
        • Product Portfolio
        • Profitability by Market Segments (Product/Age /Sales Channel/Region)
        • Sales Footprint
        • Strategy Overview
          • Marketing Strategy
          • Product Strategy
          • Channel Strategy
      • Skeleton Creek
        • Overview
        • Product Portfolio
        • Profitability by Market Segments (Product/Age /Sales Channel/Region)
        • Sales Footprint
        • Strategy Overview
          • Marketing Strategy
          • Product Strategy
          • Channel Strategy
      • Z Natural Foods
        • Overview
        • Product Portfolio
        • Profitability by Market Segments (Product/Age /Sales Channel/Region)
        • Sales Footprint
        • Strategy Overview
          • Marketing Strategy
          • Product Strategy
          • Channel Strategy
      • Health Link
        • Overview
        • Product Portfolio
        • Profitability by Market Segments (Product/Age /Sales Channel/Region)
        • Sales Footprint
        • Strategy Overview
          • Marketing Strategy
          • Product Strategy
          • Channel Strategy
      • Terrasoul Superfoods
        • Overview
        • Product Portfolio
        • Profitability by Market Segments (Product/Age /Sales Channel/Region)
        • Sales Footprint
        • Strategy Overview
          • Marketing Strategy
          • Product Strategy
          • Channel Strategy
      • Sunfood Super Foods
        • Overview
        • Product Portfolio
        • Profitability by Market Segments (Product/Age /Sales Channel/Region)
        • Sales Footprint
        • Strategy Overview
          • Marketing Strategy
          • Product Strategy
          • Channel Strategy
      • Natava SuperFoods
        • Overview
        • Product Portfolio
        • Profitability by Market Segments (Product/Age /Sales Channel/Region)
        • Sales Footprint
        • Strategy Overview
          • Marketing Strategy
          • Product Strategy
          • Channel Strategy
  20. Assumptions & Acronyms Used
  21. Research Methodology

List of Tables

  • Table 1: Global Market Value (USD Million) Forecast by Region, 2020-2035
  • Table 2: Global Market Volume (Metric Tons) Forecast by Region, 2020-2035
  • Table 3: Global Market Value (USD Million) Forecast by Nature, 2020-2035
  • Table 4: Global Market Volume (Metric Tons) Forecast by Nature, 2020-2035
  • Table 5: Global Market Value (USD Million) Forecast by Application, 2020-2035
  • Table 6: Global Market Volume (Metric Tons) Forecast by Application, 2020-2035
  • Table 7: Global Market Value (USD Million) Forecast by Sales Channel, 2020-2035
  • Table 8: Global Market Volume (Metric Tons) Forecast by Sales Channel, 2020-2035
  • Table 9: North America Market Value (USD Million) Forecast by Country, 2020-2035
  • Table 10: North America Market Volume (Metric Tons) Forecast by Country, 2020-2035
  • Table 11: North America Market Value (USD Million) Forecast by Nature, 2020-2035
  • Table 12: North America Market Volume (Metric Tons) Forecast by Nature, 2020-2035
  • Table 13: North America Market Value (USD Million) Forecast by Application, 2020-2035
  • Table 14: North America Market Volume (Metric Tons) Forecast by Application, 2020-2035
  • Table 15: North America Market Value (USD Million) Forecast by Sales Channel, 2020-2035
  • Table 16: North America Market Volume (Metric Tons) Forecast by Sales Channel, 2020-2035
  • Table 17: Latin America Market Value (USD Million) Forecast by Country, 2020-2035
  • Table 18: Latin America Market Volume (Metric Tons) Forecast by Country, 2020-2035
  • Table 19: Latin America Market Value (USD Million) Forecast by Nature, 2020-2035
  • Table 20: Latin America Market Volume (Metric Tons) Forecast by Nature, 2020-2035
  • Table 21: Latin America Market Value (USD Million) Forecast by Application, 2020-2035
  • Table 22: Latin America Market Volume (Metric Tons) Forecast by Application, 2020-2035
  • Table 23: Latin America Market Value (USD Million) Forecast by Sales Channel, 2020-2035
  • Table 24: Latin America Market Volume (Metric Tons) Forecast by Sales Channel, 2020-2035
  • Table 25: Western Europe Market Value (USD Million) Forecast by Country, 2020-2035
  • Table 26: Western Europe Market Volume (Metric Tons) Forecast by Country, 2020-2035
  • Table 27: Western Europe Market Value (USD Million) Forecast by Nature, 2020-2035
  • Table 28: Western Europe Market Volume (Metric Tons) Forecast by Nature, 2020-2035
  • Table 29: Western Europe Market Value (USD Million) Forecast by Application, 2020-2035
  • Table 30: Western Europe Market Volume (Metric Tons) Forecast by Application, 2020-2035
  • Table 31: Western Europe Market Value (USD Million) Forecast by Sales Channel, 2020-2035
  • Table 32: Western Europe Market Volume (Metric Tons) Forecast by Sales Channel, 2020-2035
  • Table 33: Eastern Europe Market Value (USD Million) Forecast by Country, 2020-2035
  • Table 34: Eastern Europe Market Volume (Metric Tons) Forecast by Country, 2020-2035
  • Table 35: Eastern Europe Market Value (USD Million) Forecast by Nature, 2020-2035
  • Table 36: Eastern Europe Market Volume (Metric Tons) Forecast by Nature, 2020-2035
  • Table 37: Eastern Europe Market Value (USD Million) Forecast by Application, 2020-2035
  • Table 38: Eastern Europe Market Volume (Metric Tons) Forecast by Application, 2020-2035
  • Table 39: Eastern Europe Market Value (USD Million) Forecast by Sales Channel, 2020-2035
  • Table 40: Eastern Europe Market Volume (Metric Tons) Forecast by Sales Channel, 2020-2035
  • Table 41: East Asia Market Value (USD Million) Forecast by Country, 2020-2035
  • Table 42: East Asia Market Volume (Metric Tons) Forecast by Country, 2020-2035
  • Table 43: East Asia Market Value (USD Million) Forecast by Nature, 2020-2035
  • Table 44: East Asia Market Volume (Metric Tons) Forecast by Nature, 2020-2035
  • Table 45: East Asia Market Value (USD Million) Forecast by Application, 2020-2035
  • Table 46: East Asia Market Volume (Metric Tons) Forecast by Application, 2020-2035
  • Table 47: East Asia Market Value (USD Million) Forecast by Sales Channel, 2020-2035
  • Table 48: East Asia Market Volume (Metric Tons) Forecast by Sales Channel, 2020-2035
  • Table 49: South Asia & Pacific Market Value (USD Million) Forecast by Country, 2020-2035
  • Table 50: South Asia & Pacific Market Volume (Metric Tons) Forecast by Country, 2020-2035
  • Table 51: South Asia & Pacific Market Value (USD Million) Forecast by Nature, 2020-2035
  • Table 52: South Asia & Pacific Market Volume (Metric Tons) Forecast by Nature, 2020-2035
  • Table 53: South Asia & Pacific Market Value (USD Million) Forecast by Application, 2020-2035
  • Table 54: South Asia & Pacific Market Volume (Metric Tons) Forecast by Application, 2020-2035
  • Table 55: South Asia & Pacific Market Value (USD Million) Forecast by Sales Channel, 2020-2035
  • Table 56: South Asia & Pacific Market Volume (Metric Tons) Forecast by Sales Channel, 2020-2035
  • Table 57: Middle East and Africa Market Value (USD Million) Forecast by Country, 2020-2035
  • Table 58: Middle East and Africa Market Volume (Metric Tons) Forecast by Country, 2020-2035
  • Table 59: Middle East and Africa Market Value (USD Million) Forecast by Nature, 2020-2035
  • Table 60: Middle East and Africa Market Volume (Metric Tons) Forecast by Nature, 2020-2035
  • Table 61: Middle East and Africa Market Value (USD Million) Forecast by Application, 2020-2035
  • Table 62: Middle East and Africa Market Volume (Metric Tons) Forecast by Application, 2020-2035
  • Table 63: Middle East and Africa Market Value (USD Million) Forecast by Sales Channel, 2020-2035
  • Table 64: Middle East and Africa Market Volume (Metric Tons) Forecast by Sales Channel, 2020-2035

List of Figures

  • Figure 1: Global Market Volume (Metric Tons) Forecast 2020-2035
  • Figure 2: Global Market Pricing Analysis
  • Figure 3: Global Market Value (USD Million) Forecast 2020-2035
  • Figure 4: Global Market Value Share and BPS Analysis by Nature, 2025 and 2035
  • Figure 5: Global Market Y-o-Y Growth Comparison by Nature, 2025-2035
  • Figure 6: Global Market Attractiveness Analysis by Nature
  • Figure 7: Global Market Value Share and BPS Analysis by Application, 2025 and 2035
  • Figure 8: Global Market Y-o-Y Growth Comparison by Application, 2025-2035
  • Figure 9: Global Market Attractiveness Analysis by Application
  • Figure 10: Global Market Value Share and BPS Analysis by Sales Channel, 2025 and 2035
  • Figure 11: Global Market Y-o-Y Growth Comparison by Sales Channel, 2025-2035
  • Figure 12: Global Market Attractiveness Analysis by Sales Channel
  • Figure 13: Global Market Value (USD Million) Share and BPS Analysis by Region, 2025 and 2035
  • Figure 14: Global Market Y-o-Y Growth Comparison by Region, 2025-2035
  • Figure 15: Global Market Attractiveness Analysis by Region
  • Figure 16: North America Market Incremental $ Opportunity, 2025-2035
  • Figure 17: Latin America Market Incremental $ Opportunity, 2025-2035
  • Figure 18: Western Europe Market Incremental $ Opportunity, 2025-2035
  • Figure 19: Eastern Europe Market Incremental $ Opportunity, 2025-2035
  • Figure 20: East Asia Market Incremental $ Opportunity, 2025-2035
  • Figure 21: South Asia & Pacific Market Incremental $ Opportunity, 2025-2035
  • Figure 22: Middle East and Africa Market Incremental $ Opportunity, 2025-2035
  • Figure 23: North America Market Value Share and BPS Analysis by Country, 2025 and 2035
  • Figure 24: North America Market Value Share and BPS Analysis by Nature, 2025 and 2035
  • Figure 25: North America Market Y-o-Y Growth Comparison by Nature, 2025-2035
  • Figure 26: North America Market Attractiveness Analysis by Nature
  • Figure 27: North America Market Value Share and BPS Analysis by Application, 2025 and 2035
  • Figure 28: North America Market Y-o-Y Growth Comparison by Application, 2025-2035
  • Figure 29: North America Market Attractiveness Analysis by Application
  • Figure 30: North America Market Value Share and BPS Analysis by Sales Channel, 2025 and 2035
  • Figure 31: North America Market Y-o-Y Growth Comparison by Sales Channel, 2025-2035
  • Figure 32: North America Market Attractiveness Analysis by Sales Channel
  • Figure 33: Latin America Market Value Share and BPS Analysis by Country, 2025 and 2035
  • Figure 34: Latin America Market Value Share and BPS Analysis by Nature, 2025 and 2035
  • Figure 35: Latin America Market Y-o-Y Growth Comparison by Nature, 2025-2035
  • Figure 36: Latin America Market Attractiveness Analysis by Nature
  • Figure 37: Latin America Market Value Share and BPS Analysis by Application, 2025 and 2035
  • Figure 38: Latin America Market Y-o-Y Growth Comparison by Application, 2025-2035
  • Figure 39: Latin America Market Attractiveness Analysis by Application
  • Figure 40: Latin America Market Value Share and BPS Analysis by Sales Channel, 2025 and 2035
  • Figure 41: Latin America Market Y-o-Y Growth Comparison by Sales Channel, 2025-2035
  • Figure 42: Latin America Market Attractiveness Analysis by Sales Channel
  • Figure 43: Western Europe Market Value Share and BPS Analysis by Country, 2025 and 2035
  • Figure 44: Western Europe Market Value Share and BPS Analysis by Nature, 2025 and 2035
  • Figure 45: Western Europe Market Y-o-Y Growth Comparison by Nature, 2025-2035
  • Figure 46: Western Europe Market Attractiveness Analysis by Nature
  • Figure 47: Western Europe Market Value Share and BPS Analysis by Application, 2025 and 2035
  • Figure 48: Western Europe Market Y-o-Y Growth Comparison by Application, 2025-2035
  • Figure 49: Western Europe Market Attractiveness Analysis by Application
  • Figure 50: Western Europe Market Value Share and BPS Analysis by Sales Channel, 2025 and 2035
  • Figure 51: Western Europe Market Y-o-Y Growth Comparison by Sales Channel, 2025-2035
  • Figure 52: Western Europe Market Attractiveness Analysis by Sales Channel
  • Figure 53: Eastern Europe Market Value Share and BPS Analysis by Country, 2025 and 2035
  • Figure 54: Eastern Europe Market Value Share and BPS Analysis by Nature, 2025 and 2035
  • Figure 55: Eastern Europe Market Y-o-Y Growth Comparison by Nature, 2025-2035
  • Figure 56: Eastern Europe Market Attractiveness Analysis by Nature
  • Figure 57: Eastern Europe Market Value Share and BPS Analysis by Application, 2025 and 2035
  • Figure 58: Eastern Europe Market Y-o-Y Growth Comparison by Application, 2025-2035
  • Figure 59: Eastern Europe Market Attractiveness Analysis by Application
  • Figure 60: Eastern Europe Market Value Share and BPS Analysis by Sales Channel, 2025 and 2035
  • Figure 61: Eastern Europe Market Y-o-Y Growth Comparison by Sales Channel, 2025-2035
  • Figure 62: Eastern Europe Market Attractiveness Analysis by Sales Channel
  • Figure 63: East Asia Market Value Share and BPS Analysis by Country, 2025 and 2035
  • Figure 64: East Asia Market Value Share and BPS Analysis by Nature, 2025 and 2035
  • Figure 65: East Asia Market Y-o-Y Growth Comparison by Nature, 2025-2035
  • Figure 66: East Asia Market Attractiveness Analysis by Nature
  • Figure 67: East Asia Market Value Share and BPS Analysis by Application, 2025 and 2035
  • Figure 68: East Asia Market Y-o-Y Growth Comparison by Application, 2025-2035
  • Figure 69: East Asia Market Attractiveness Analysis by Application
  • Figure 70: East Asia Market Value Share and BPS Analysis by Sales Channel, 2025 and 2035
  • Figure 71: East Asia Market Y-o-Y Growth Comparison by Sales Channel, 2025-2035
  • Figure 72: East Asia Market Attractiveness Analysis by Sales Channel
  • Figure 73: South Asia & Pacific Market Value Share and BPS Analysis by Country, 2025 and 2035
  • Figure 74: South Asia & Pacific Market Value Share and BPS Analysis by Nature, 2025 and 2035
  • Figure 75: South Asia & Pacific Market Y-o-Y Growth Comparison by Nature, 2025-2035
  • Figure 76: South Asia & Pacific Market Attractiveness Analysis by Nature
  • Figure 77: South Asia & Pacific Market Value Share and BPS Analysis by Application, 2025 and 2035
  • Figure 78: South Asia & Pacific Market Y-o-Y Growth Comparison by Application, 2025-2035
  • Figure 79: South Asia & Pacific Market Attractiveness Analysis by Application
  • Figure 80: South Asia & Pacific Market Value Share and BPS Analysis by Sales Channel, 2025 and 2035
  • Figure 81: South Asia & Pacific Market Y-o-Y Growth Comparison by Sales Channel, 2025-2035
  • Figure 82: South Asia & Pacific Market Attractiveness Analysis by Sales Channel
  • Figure 83: Middle East and Africa Market Value Share and BPS Analysis by Country, 2025 and 2035
  • Figure 84: Middle East and Africa Market Value Share and BPS Analysis by Nature, 2025 and 2035
  • Figure 85: Middle East and Africa Market Y-o-Y Growth Comparison by Nature, 2025-2035
  • Figure 86: Middle East and Africa Market Attractiveness Analysis by Nature
  • Figure 87: Middle East and Africa Market Value Share and BPS Analysis by Application, 2025 and 2035
  • Figure 88: Middle East and Africa Market Y-o-Y Growth Comparison by Application, 2025-2035
  • Figure 89: Middle East and Africa Market Attractiveness Analysis by Application
  • Figure 90: Middle East and Africa Market Value Share and BPS Analysis by Sales Channel, 2025 and 2035
  • Figure 91: Middle East and Africa Market Y-o-Y Growth Comparison by Sales Channel, 2025-2035
  • Figure 92: Middle East and Africa Market Attractiveness Analysis by Sales Channel
  • Figure 93: Global Market - Tier Structure Analysis
  • Figure 94: Global Market - Company Share Analysis

Frequently Asked Questions

How big is the mesquite flour market in 2025?

The global mesquite flour market is estimated to be valued at USD 571 million in 2025.

What will be the size of the mesquite flour market in 2035?

The mesquite flour market size is projected to reach USD 1,032.3 million by 2035.

How much will be the mesquite flour market growth between 2025 and 2035?

The mesquite flour market is expected to grow at a 6.1% CAGR between 2025 and 2035.

Which application segment is projected to lead in the mesquite flour market in 2025?

The bakery products segment is projected to lead in the mesquite flour market with 40% market share in 2025.

Which sales channel is set to contribute significant share in the mesquite flour market in 2025?

In terms of sales channel, the supermarket/hypermarket segment is expected to command 37% share in the mesquite flour market in 2025.

Explore Similar Insights

Future Market Insights

Mesquite Flour Market