Micro Printing Market Overview

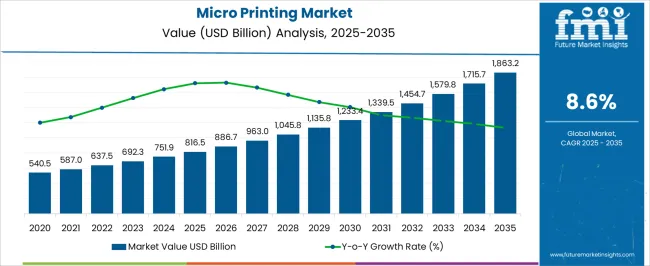
The Micro Printing Market revenue totalled US$ 595.8 Mn in 2021 and is estimated to reach US$ 1,459.2 Mn by 2032, growing at a CAGR of 8.6% for 2022 – 2032.

Attributes Details
Estimated year (2022) Market Value US$ 637.5 Million
Projected year (2032) Value US$ 1,459.2 Million
CAGR% (2022 to 2032) 8.6%
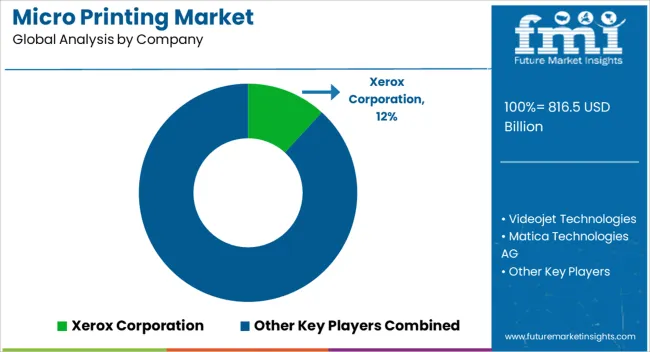
Top 5 Vendor Market Share Around 35%

Micro Printing is mainly used for consumer electronics packaging to print product information. Microprinting is an anti-counterfeiting process for printing small text or numbers on stamps, bank checks, currency and other similar items. These traces are invisible to the naked eye. The purpose of using micro printing for these documents is to improvise a defence of their authenticity. Copiers and computer scanners cannot see microtext without a high-resolution image sensor.

In the future, micro printing will make it difficult for scanners and copiers to reproduce these documents. Micro printing is one of the key technologies used to prevent fraudulent activities such as document, currency and check counterfeiting. Micro printing is the printing of extremely small characters that could not be read by the naked eye. Documents which contains micro printed characters could not be copied because these characters appear as a series of dots or solid lines when printed.

2017-2021 Micro Printing Market Demand Outlook Compared to 2022-2032 Forecast

The micro printing market demand is estimated to grow at an 8.6% CAGR between 2022 and 2032 in comparison with 2.8% CAGR registered during the historic period (2017-2021).

The micro-printing process is widely accepted in various industries, especially for improving the security of employee ID cards and driver's licenses, thus boosting the growth of the micro printing market. Currencies and stamps are both obvious growths in the micro printing market. Various government policies and agencies aimed at improving the security of currency and certificates are boosting the growth of the micro-printing market. In addition, advances in ingenious Micro printing coupled with cost-effective techniques have enhanced their applications in various industries. These factors are likely to boost the growth of the micro printing market.

Cost-effective Printing of The Micro Printing System to Appeal Corporate Organizations as well as Governments

Micro printing is gaining momentum in the development of the characters and identical patterns with the advent of the new printers such as copiers, image scanning systems and pantographs.

There has been a significant increase in R&D activity to extend and innovate the range of micro printing systems. Players in the micro printing market have strived to increase the attractiveness of their products by balancing budget constraints that affect system sales.

As a result, a low-cost micro-printing technology was developed that reduced the cost per print and increased the print speed per hour. This has impacted the adoption rate of these printers and is expected to remain so for the next few years and contributing to the growing size of the microprinting market.

Regional Analysis

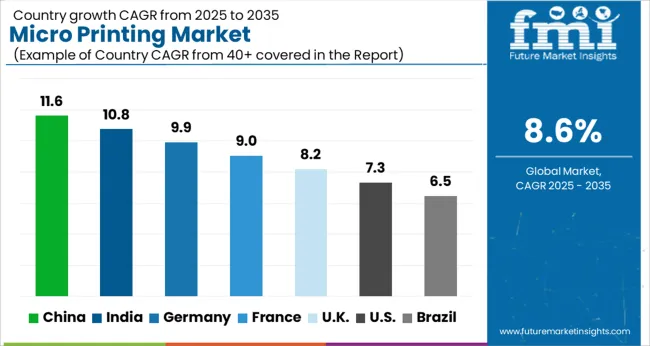
The East Asian regional market is estimated to grow by CAGR of 10.1% during the forecast period of 2022-2032 and the largest market share was held by North America of 23.3% in 2021.

East Asia's micro printing market held over 21.1% revenue share in 2021. This is due to the increased adoption of technology in various industries such as banking and finance, government agencies and corporate organizations. Demand for security and anti-counterfeiting solutions is expected to increase in education, enterprise, and government sectors, thereby driving the growth of the regional market.

North America has a large population, with strong economic conditions and has a large market for consumer electronics, packaging and ID cards.

Country-wise Insights

China is one of the leading country in the East Asia region

The China micro printing market accounted for the highest market share of 17.8% in 2021. This is due to the biggest population with increased adoption of e-commerce sector which emphasises risk for fraud and introduction of counterfeit currency are the factors driving the growth of the micro printing market in China.

Rising sales of consumer electronics in China coupled with exports to numerous countries are expected to increase the acceptance rate of micro-printing systems for labelling products and their packaging. In addition, China's established banking sector uses these systems extensively for printing currency and designing check books.

Customer base in India is showing the tremendous growth in the world.

The market for micro printing in India is estimated to grow at highest CAGR of 10.4% during the forecast period. owing to growing demand for microprinting of official and government documents such as ID cards, driver's licenses, passports, etc. The Indian market is booming due to the growing demand for microprinting to prevent fraud and the introduction of counterfeit currency in banks, financial institutions, government agencies and businesses.

Rise in financial fraud activities using counterfeit currency has increased the need for micro-printing devices, which is expected to provide lucrative growth opportunities for the Indian micro-printing market.
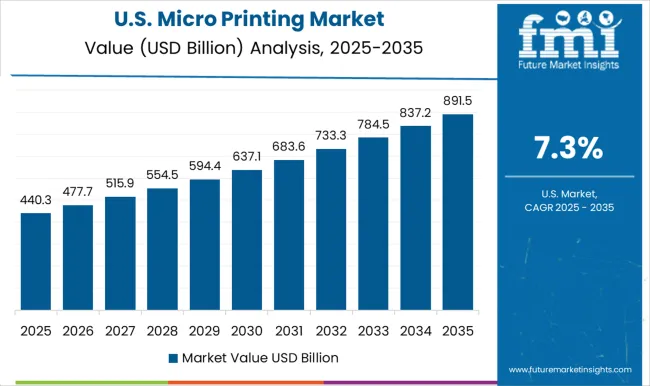
Implementation of the microprinting technology in USA is increasing rapidly for product security and traceability

The USA is predicted to remain the most attractive market during the forecast period. According to the study, the USA micro-printing market is set to account for nearly 12.5% market share of total North America region.

The USA is home to many banks, government financial institutions, and corporate organizations, which has increased the use of printers based on micro printing technology. Increased development activities and rapid economic expansion in the USA are expected to witness high growth of the micro printing market. In addition, banking sector standards and regulations, expanding e-commerce sector, and technological advancements in micro-printing technology in the BFSI sector are key factors driving the growth of the USA micro-printing market.

Category-wise Insights

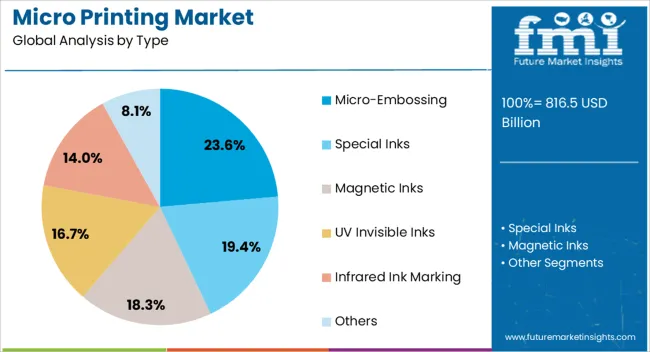
Why demand for the UV invisible ink is fuelling the growth of Micro Printing Market?

The market for UV invisible ink in micro printing is estimated to grow at highest CAGR of 9.8% during the forecast period. UV invisible ink are fluorescent. That is these inks are invisible to naked eye but appear to glow under blacklight or UV.

In recent years, UV invisible ink which is also known as invisible ink has rapidly developed. Moreover, micro printing is widely used for anti-counterfeiting with UV Invisible Inks playing an important role in the micro printing of stamps and currency. The consistent growth in printing currency, postage stamps and bank documents has also helped UV invisible inks micro printing grow at a significant rate.

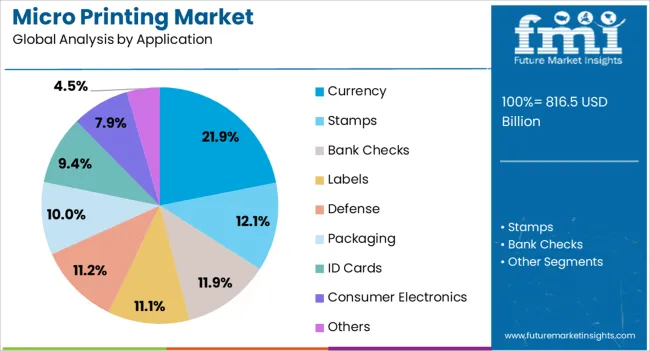
How Packaging Application is supporting the overall growth of the Micro Printing Market?

Packaging application to hold largest market share of micro printing market during forecast period which is accounted for 17.5% in 2021. Micro printing is currently implemented on packages, boxes, tags, and labels used in packaging applications. Packaging applications require high-quality printing, security, rapid product identification and fast print turnaround times. All industries need product security and brand protection as counterfeit products can impact annual sales.

Therefore, industry players are now focused on implementing the micro printing in packaging applications to enable product security and avoid product duplication. Therefore, the micro printing market for packaging applications is expected to drive the market for micro printing.
Competitive Landscape

Acquisitions and mergers are the default expansion strategies of players operating in the micro printing market. In the micro printing market, we are also seeing trends in the development of novel printers that utilize cutting-edge technology and eco-friendly printers. For instance,
  • In May 2022, Matica, is a leading provider of the secure issuance and digital identity solutions Matica announced the acquisition of the NBS Technologies and UbiQ software from Ai Holdings. The addition of NBS hardware solutions which includes Horizon and Imagemaster and Javelin, which strengthens Matica’s secure issuance range.
  • In March 2022, Ricoh Company, Ltd. announced the launch of three industrial grade inkjet printheads: RICOH MH5442, RICOH MH5422 and RICOH MH5422. It can be used as a key component in digital printing systems. New printheads provide superior image quality and productivity.

Scope of report

Attribute Details
Market Value in 2022 US$ 637.5 Million
Market CAGR 2022 to 2032 8.6%
Share of top 5 players Around 35%
Forecast Period 2022 to 2032
Historical Data Available for 2017 to 2021
Market Analysis USD Million for Value
Key Region Covered North America, Latin America, Europe, East Asia, South Asia & Pacific, and the Middle East & Africa
Key Countries Covered USA, Canada, Germany, UK, France, Italy, Spain, Russia, China, Japan, South Korea, India, Malaysia, Indonesia, Singapore, Australia & New Zealand, GCC Countries, Turkey, Northern Africa, and South Africa
Key Segments Covered Type, Application and Region
Key Companies Profiled
Report Coverage Market Forecast, Company Share Analysis, Competition Intelligence, DROT Analysis, Market Dynamics and Challenges, and Strategic Growth Initiatives
Customization & Pricing Available upon Request

Micro Printing Market by Category

Type:

  • Micro-Embossing
  • Special Inks
  • Magnetic Inks
  • UV Invisible Inks
  • Infrared Ink Marking
  • Others

Application:

  • Currency
  • Stamps
  • Bank Checks
  • Labels
  • Defense
  • Packaging
  • ID Cards
  • Consumer Electronics
  • Others

Region:

  • North America
  • Latin America
  • Europe
  • East Asia
  • South Asia & Pacific
  • Middle East and Africa (MEA)

Table of Content

  1. Executive Summary - Micro Printing Market
    • Global Market Outlook
    • Demand-side Trends
    • Supply-side Trends
    • Technology Roadmap Analysis
    • Analysis and Recommendations
  2. Market Overview
    • Market Coverage / Taxonomy
    • Market Definition / Scope / Limitations
    • Inclusion and Exclusion
  3. Value Added Insights
    • Opportunity Map Analysis
    • Product Life Cycle Analysis
    • Supply Chain Analysis
      • Supply Side Participants and their Roles
        • Producers
        • Mid-Level Participants (Traders/ Agents/ Brokers)
        • Wholesalers and Distributors
      • Value Added and Value Created at Node in the Supply Chain
      • List of Raw Material Suppliers
      • List of Existing and Potential Buyers
    • Pricing Analysis of Micro Printing Market
      • Pricing Analysis By Region
      • Pricing Analysis By Country
      • Pricing Analysis By End Use
      • Pricing Analysis By Distributor
      • Pricing Analysis By Application
    • Value Chain Analysis
      • Profit Margin Analysis
      • Wholesalers and Distributors
      • Retailers
    • Product Portfolio Analysis
    • Regulatory Landscape
      • By Key Regions
      • By Key Countries
    • Regional Parent Market Outlook
    • Production and Consumption Statistics
    • Import and Export Statistics
    • Investment Feasibility Matrix
    • PESTLE Analysis
      • Political Factors
        • Government stability and change
        • Taxation policy and incentives
        • Trade tariffs and import/export regulations
        • Political risk and corruption levels
      • Economic Factors
        • GDP growth and economic cycles
        • Inflation and interest rates
        • Exchange rate fluctuations
        • Unemployment and consumer spending power
      • Social Factors
        • Demographic trends (age, population growth)
        • Cultural attitudes and lifestyle changes
        • Education levels and workforce skills
        • Health consciousness and social values
      • Technological Factors
        • Rate of technological innovation
        • R&D activity and automation trends
        • Digital infrastructure and connectivity
        • Intellectual property protection
      • Legal Factors
        • Employment and labor laws
        • Health & safety regulations
        • Consumer protection laws
        • Data privacy and antitrust legislation
      • Environmental Factors
        • Environmental regulations and compliance
        • Climate change impacts and carbon footprint
        • Resource availability and sustainability practices
        • Waste management and recycling initiatives
    • Market Background and Dynamics
      • Market Dynamics
        • Drivers
        • Restraints
        • Opportunity
        • Trends
      • SWOT Analysis of Global Micro Printing Market
        • Strengths
        • Weaknesses
        • Opportunities
        • Threats
  4. Global Micro Printing Market Analysis 2020-2024 and Forecast, 2025-2035
    • Historical Market Size Value (USD Mn) & Volume (Units) Analysis, 2020-2024
    • Current and Future Market Size Value (USD Mn) & Volume (Units) Projections, 2025-2035
      • Y-o-Y Growth Trend Analysis
      • Absolute $ Opportunity Analysis
    • Revenue Forecast Scenario, 2020-2035
      • Conservative Scenario
      • Likely Scenario
      • Optimistic Scenario
  5. Global Micro Printing Market Analysis 2020-2024 and Forecast 2025-2035, By Application
    • Introduction / Key Findings
    • Historical Market Size Value (USD Mn) & Volume (Units) Analysis By Application, 2020-2024
    • Current and Future Market Size Value (USD Mn) & Volume (Units) Analysis and Forecast By Application, 2025-2035
    • Y-o-Y Growth Trend Analysis By Application, 2020-2024
    • Absolute $ Opportunity Analysis By Application, 2025-2035
    • Market Attractiveness Analysis By Application, 2025-2035
  6. Global Micro Printing Market Analysis 2020-2024 and Forecast 2025-2035, By End Use
    • Introduction / Key Findings
    • Historical Market Size Value (USD Mn) & Volume (Units) Analysis By End Use, 2020-2024
    • Current and Future Market Size Value (USD Mn) & Volume (Units) Analysis and Forecast By End Use, 2025-2035
    • Y-o-Y Growth Trend Analysis By End Use, 2020-2024
    • Absolute $ Opportunity Analysis By End Use, 2025-2035
    • Market Attractiveness Analysis By End Use, 2025-2035
  7. Global Micro Printing Market Analysis 2020-2024 and Forecast 2025-2035, By Region
    • Introduction
    • Historical Market Size Value (USD Mn) & Volume (Units) Analysis By Region, 2020-2024
    • Current Market Size Value (USD Mn) & Volume (Units) Analysis and Forecast By Region, 2025-2035
      • North America
      • Latin America
      • Western Europe
      • Eastern Europe
      • East Asia
      • South Asia and Pacific & Pacific
      • MEA
    • Market Attractiveness Analysis By Region
  8. North America Micro Printing Market Analysis 2020-2024 and Forecast 2025-2035
    • Introduction
    • Historical Market Size Value (USD Mn) & Volume (Units) Trend Analysis By Market Taxonomy, 2020-2024
    • Current and Future Market Size Value (USD Mn) & Volume (Units) Analysis and Forecast By Market Taxonomy, 2025-2035
    • By Country
      • USA
      • Canada
    • By Application
    • By End Use
    • Market Attractiveness Analysis
      • By Country
      • By Application
      • By End Use
    • Market Trends
    • Key Market Participants - Intensity Mapping
    • Drivers and Restraints - Impact Analysis
    • Country Level Analysis & Forecast
      • USA Micro Printing Market
        • Introduction
        • Market Analysis and Forecast by Market Taxonomy
        • By Application
        • By End Use
      • Canada Micro Printing Market
        • Introduction
        • Market Analysis and Forecast by Market Taxonomy
        • By Application
        • By End Use
      • Mexico Micro Printing Market
        • Introduction
        • Market Analysis and Forecast by Market Taxonomy
        • By Application
        • By End Use
  9. Latin America Micro Printing Market Analysis 2020-2024 and Forecast 2025-2035, By Country
    • Historical Market Size Value (USD Mn) & Volume (Units) Trend Analysis By Market Taxonomy, 2020-2024
    • Market Size Value (USD Mn) & Volume (Units) Forecast By Market Taxonomy, 2025-2035
    • By Country
      • Brazil
      • Argentina
      • Chile
      • Rest of Latin America
    • By Application
    • By End Use
    • Market Attractiveness Analysis
      • By Country
      • By Application
      • By End Use
    • Market Trends
    • Key Market Participants - Intensity Mapping
    • Drivers and Restraints - Impact Analysis
    • Country Level Analysis & Forecast
      • Brazil Micro Printing Market
        • Introduction
        • Market Analysis and Forecast by Market Taxonomy
        • By Application
        • By End Use
      • Argentina Micro Printing Market
        • Introduction
        • Market Analysis and Forecast by Market Taxonomy
        • By Application
        • By End Use
      • Chile Micro Printing Market
        • Introduction
        • Market Analysis and Forecast by Market Taxonomy
        • By Application
        • By End Use
      • Rest of Latin America Micro Printing Market
        • Introduction
        • Market Analysis and Forecast by Market Taxonomy
        • By Application
        • By End Use
  10. Western Europe Micro Printing Market Analysis 2020-2024 and Forecast 2025-2035, By Country
    • Historical Market Size Value (USD Mn) & Volume (Units) Trend Analysis By Market Taxonomy, 2020-2024
    • Market Size Value (USD Mn) & Volume (Units) Forecast By Market Taxonomy, 2025-2035
    • By Country
      • Germany
      • UK
      • Italy
      • Spain
      • France
      • Nordic
      • BENELUX
      • Rest of Western Europe
    • By Application
    • By End Use
    • Market Attractiveness Analysis
      • By Country
      • By Application
      • By End Use
    • Key Takeaways
    • Market Trends
    • Key Market Participants - Intensity Mapping
    • Drivers and Restraints - Impact Analysis
    • Country Level Analysis & Forecast
      • Germany Micro Printing Market
        • Introduction
        • Market Analysis and Forecast by Market Taxonomy
        • By Application
        • By End Use
      • UK Micro Printing Market
        • Introduction
        • Market Analysis and Forecast by Market Taxonomy
        • By Application
        • By End Use
      • Italy Micro Printing Market
        • Introduction
        • Market Analysis and Forecast by Market Taxonomy
        • By Application
        • By End Use
      • Spain Micro Printing Market
        • Introduction
        • Market Analysis and Forecast by Market Taxonomy
        • By Application
        • By End Use
      • France Micro Printing Market
        • Introduction
        • Market Analysis and Forecast by Market Taxonomy
        • By Application
        • By End Use
      • Nordic Micro Printing Market
        • Introduction
        • Market Analysis and Forecast by Market Taxonomy
        • By Application
        • By End Use
      • BENELUX Micro Printing Market
        • Introduction
        • Market Analysis and Forecast by Market Taxonomy
        • By Application
        • By End Use
      • Rest of Western Europe Micro Printing Market
        • Introduction
        • Market Analysis and Forecast by Market Taxonomy
        • By Application
        • By End Use
  11. Eastern Europe Micro Printing Market Analysis 2020-2024 and Forecast 2025-2035, By Country
    • Historical Market Size Value (USD Mn) & Volume (Units) Trend Analysis By Market Taxonomy, 2020-2024
    • Market Size Value (USD Mn) & Volume (Units) Forecast By Market Taxonomy, 2025-2035
    • By Country
      • Russia
      • Poland
      • Hungary
      • Balkan & Baltic
      • Rest of Eastern Europe
    • By Application
    • By End Use
    • Market Attractiveness Analysis
      • By Country
      • By Application
      • By End Use
    • Key Takeaways
    • Market Trends
    • Key Market Participants - Intensity Mapping
    • Drivers and Restraints - Impact Analysis
    • Country Level Analysis & Forecast
      • Russia Micro Printing Market
        • Introduction
        • Market Analysis and Forecast by Market Taxonomy
        • By Application
        • By End Use
      • Poland Micro Printing Market
        • Introduction
        • Market Analysis and Forecast by Market Taxonomy
        • By Application
        • By End Use
      • Hungary Micro Printing Market
        • Introduction
        • Market Analysis and Forecast by Market Taxonomy
        • By Application
        • By End Use
      • Balkan & Baltic Micro Printing Market
        • Introduction
        • Market Analysis and Forecast by Market Taxonomy
        • By Application
        • By End Use
      • Rest of Eastern Europe Micro Printing Market
        • Introduction
        • Market Analysis and Forecast by Market Taxonomy
        • By Application
        • By End Use
  12. East Asia Micro Printing Market Analysis 2020-2024 and Forecast 2025-2035, By Country
    • Historical Market Size Value (USD Mn) & Volume (Units) Trend Analysis By Market Taxonomy, 2020-2024
    • Market Size Value (USD Mn) & Volume (Units) Forecast By Market Taxonomy, 2025-2035
    • By Country
      • China
      • Japan
      • South Korea
    • By Application
    • By End Use
    • Market Attractiveness Analysis
      • By Country
      • By Application
      • By End Use
    • Key Takeaways
    • Market Trends
    • Key Market Participants - Intensity Mapping
    • Drivers and Restraints - Impact Analysis
    • Country Level Analysis & Forecast
      • China Micro Printing Market
        • Introduction
        • Market Analysis and Forecast by Market Taxonomy
        • By Application
        • By End Use
      • Japan Micro Printing Market
        • Introduction
        • Market Analysis and Forecast by Market Taxonomy
        • By Application
        • By End Use
      • South Korea Micro Printing Market
        • Introduction
        • Market Analysis and Forecast by Market Taxonomy
        • By Application
        • By End Use
  13. South Asia and Pacific Micro Printing Market Analysis 2020-2024 and Forecast 2025-2035, By Country
    • Historical Market Size Value (USD Mn) & Volume (Units) Trend Analysis By Market Taxonomy, 2020-2024
    • Market Size Value (USD Mn) & Volume (Units) Forecast By Market Taxonomy, 2025-2035
    • By Country
      • India
      • ASEAN
      • Australia & New Zealand
      • Rest of South Asia and Pacific
    • By Application
    • By End Use
    • Market Attractiveness Analysis
      • By Country
      • By Application
      • By End Use
    • Key Takeaways
    • Market Trends
    • Key Market Participants - Intensity Mapping
    • Drivers and Restraints - Impact Analysis
    • Country Level Analysis & Forecast
      • India Micro Printing Market
        • Introduction
        • Market Analysis and Forecast by Market Taxonomy
        • By Application
        • By End Use
      • ASEAN Micro Printing Market
        • Introduction
        • Market Analysis and Forecast by Market Taxonomy
        • By Application
        • By End Use
      • Australia & New Zealand Micro Printing Market
        • Introduction
        • Market Analysis and Forecast by Market Taxonomy
        • By Application
        • By End Use
      • Rest of South Asia and Pacific Micro Printing Market
        • Introduction
        • Market Analysis and Forecast by Market Taxonomy
        • By Application
        • By End Use
  14. MEA Micro Printing Market Analysis 2020-2024 and Forecast 2025-2035, By Country
    • Historical Market Size Value (USD Mn) & Volume (Units) Trend Analysis By Market Taxonomy, 2020-2024
    • Market Size Value (USD Mn) & Volume (Units) Forecast By Market Taxonomy, 2025-2035
    • By Country
      • Kingdom of Saudi Arabia
      • Other GCC Countries
      • Turkiye
      • South Africa
      • Other African Union
      • Rest of Middle East & Africa
    • By Application
    • By End Use
    • Market Attractiveness Analysis
      • By Country
      • By Application
      • By End Use
    • Key Takeaways
    • Market Trends
    • Key Market Participants - Intensity Mapping
    • Drivers and Restraints - Impact Analysis
    • Country Level Analysis & Forecast
      • Kingdom of Saudi Arabia Micro Printing Market
        • Introduction
        • Market Analysis and Forecast by Market Taxonomy
        • By Application
        • By End Use
      • Other GCC Countries Micro Printing Market
        • Introduction
        • Market Analysis and Forecast by Market Taxonomy
        • By Application
        • By End Use
      • Turkiye Micro Printing Market
        • Introduction
        • Market Analysis and Forecast by Market Taxonomy
        • By Application
        • By End Use
      • South Africa Micro Printing Market
        • Introduction
        • Market Analysis and Forecast by Market Taxonomy
        • By Application
        • By End Use
      • South Africa Micro Printing Market
        • Introduction
        • Market Analysis and Forecast by Market Taxonomy
        • By Application
        • By End Use
      • Rest of MEA Micro Printing Market
        • Introduction
        • Market Analysis and Forecast by Market Taxonomy
        • By Application
        • By End Use
      • Rest of MEA Micro Printing Market
        • Introduction
        • Market Analysis and Forecast by Market Taxonomy
        • By Application
        • By End Use
  15. Market Structure Analysis
    • Competition Dashboard
    • Competition Benchmarking
    • Market Share Analysis of Top Players
      • By Region
      • By Application
      • By End Use
    • Competition Analysis
    • Competition Deep Dive
      • Global Key Players
      • Key Players by Region
      • Key Players by Country
  16. Assumptions & Acronyms Used
  17. Research Methodology

List of Tables

  • Table 1: Global Micro Printing Market Value (US$ Mn) Forecast by Region, 2020-2035
  • Table 2: Global Micro Printing Market Volume (Units) Forecast by Region, 2020-2035
  • Table 3: Global Micro Printing Market Value (US$ Mn) Forecast by Application, 2020-2035
  • Table 4: Global Micro Printing Market Volume (Units) Forecast by Application, 2020-2035
  • Table 5: Global Micro Printing Market Value (US$ Mn) Forecast by End Use, 2020-2035
  • Table 6: Global Micro Printing Market Volume (Units) Forecast by End Use, 2020-2035
  • Table 7: North America Micro Printing Market Value (US$ Mn) Forecast by Country, 2020-2035
  • Table 8: North America Micro Printing Market Volume (Units) Forecast by Country, 2020-2035
  • Table 9: North America Micro Printing Market Value (US$ Mn) Forecast by Application, 2020-2035
  • Table 10: North America Micro Printing Market Volume (Units) Forecast by Application, 2020-2035
  • Table 11: North America Micro Printing Market Value (US$ Mn) Forecast by End Use, 2020-2035
  • Table 12: North America Micro Printing Market Volume (Units) Forecast by End Use, 2020-2035
  • Table 13: Latin America Micro Printing Market Value (US$ Mn) Forecast by Country, 2020-2035
  • Table 14: Latin America Micro Printing Market Volume (Units) Forecast by Country, 2020-2035
  • Table 15: Latin America Micro Printing Market Value (US$ Mn) Forecast by Application, 2020-2035
  • Table 16: Latin America Micro Printing Market Volume (Units) Forecast by Application, 2020-2035
  • Table 17: Latin America Micro Printing Market Value (US$ Mn) Forecast by End Use, 2020-2035
  • Table 18: Latin America Micro Printing Market Volume (Units) Forecast by End Use, 2020-2035
  • Table 19: Europe Micro Printing Market Value (US$ Mn) Forecast by Country, 2020-2035
  • Table 20: Europe Micro Printing Market Volume (Units) Forecast by Country, 2020-2035
  • Table 21: Europe Micro Printing Market Value (US$ Mn) Forecast by Application, 2020-2035
  • Table 22: Europe Micro Printing Market Volume (Units) Forecast by Application, 2020-2035
  • Table 23: Europe Micro Printing Market Value (US$ Mn) Forecast by End Use, 2020-2035
  • Table 24: Europe Micro Printing Market Volume (Units) Forecast by End Use, 2020-2035
  • Table 25: East Asia Micro Printing Market Value (US$ Mn) Forecast by Country, 2020-2035
  • Table 26: East Asia Micro Printing Market Volume (Units) Forecast by Country, 2020-2035
  • Table 27: East Asia Micro Printing Market Value (US$ Mn) Forecast by Application, 2020-2035
  • Table 28: East Asia Micro Printing Market Volume (Units) Forecast by Application, 2020-2035
  • Table 29: East Asia Micro Printing Market Value (US$ Mn) Forecast by End Use, 2020-2035
  • Table 30: East Asia Micro Printing Market Volume (Units) Forecast by End Use, 2020-2035
  • Table 31: South Asia Micro Printing Market Value (US$ Mn) Forecast by Country, 2020-2035
  • Table 32: South Asia Micro Printing Market Volume (Units) Forecast by Country, 2020-2035
  • Table 33: South Asia Micro Printing Market Value (US$ Mn) Forecast by Application, 2020-2035
  • Table 34: South Asia Micro Printing Market Volume (Units) Forecast by Application, 2020-2035
  • Table 35: South Asia Micro Printing Market Value (US$ Mn) Forecast by End Use, 2020-2035
  • Table 36: South Asia Micro Printing Market Volume (Units) Forecast by End Use, 2020-2035
  • Table 37: Oceania Micro Printing Market Value (US$ Mn) Forecast by Country, 2020-2035
  • Table 38: Oceania Micro Printing Market Volume (Units) Forecast by Country, 2020-2035
  • Table 39: Oceania Micro Printing Market Value (US$ Mn) Forecast by Application, 2020-2035
  • Table 40: Oceania Micro Printing Market Volume (Units) Forecast by Application, 2020-2035
  • Table 41: Oceania Micro Printing Market Value (US$ Mn) Forecast by End Use, 2020-2035
  • Table 42: Oceania Micro Printing Market Volume (Units) Forecast by End Use, 2020-2035
  • Table 43: MEA Micro Printing Market Value (US$ Mn) Forecast by Country, 2020-2035
  • Table 44: MEA Micro Printing Market Volume (Units) Forecast by Country, 2020-2035
  • Table 45: MEA Micro Printing Market Value (US$ Mn) Forecast by Application, 2020-2035
  • Table 46: MEA Micro Printing Market Volume (Units) Forecast by Application, 2020-2035
  • Table 47: MEA Micro Printing Market Value (US$ Mn) Forecast by End Use, 2020-2035
  • Table 48: MEA Micro Printing Market Volume (Units) Forecast by End Use, 2020-2035

List of Figures

  • Figure 1: Global Micro Printing Market Value (US$ Mn) by Application, 2020-2035
  • Figure 2: Global Micro Printing Market Value (US$ Mn) by End Use, 2020-2035
  • Figure 3: Global Micro Printing Market Value (US$ Mn) by Region, 2020-2035
  • Figure 4: Global Micro Printing Market Value (US$ Mn) Analysis by Region, 2020-2035
  • Figure 5: Global Micro Printing Market Volume (Units) Analysis by Region, 2020-2035
  • Figure 6: Global Micro Printing Market Value Share (%) and BPS Analysis by Region, 2020-2035
  • Figure 7: Global Micro Printing Market Y-o-Y Growth (%) Projections by Region, 2020-2035
  • Figure 8: Global Micro Printing Market Value (US$ Mn) Analysis by Application, 2020-2035
  • Figure 9: Global Micro Printing Market Volume (Units) Analysis by Application, 2020-2035
  • Figure 10: Global Micro Printing Market Value Share (%) and BPS Analysis by Application, 2020-2035
  • Figure 11: Global Micro Printing Market Y-o-Y Growth (%) Projections by Application, 2020-2035
  • Figure 12: Global Micro Printing Market Value (US$ Mn) Analysis by End Use, 2020-2035
  • Figure 13: Global Micro Printing Market Volume (Units) Analysis by End Use, 2020-2035
  • Figure 14: Global Micro Printing Market Value Share (%) and BPS Analysis by End Use, 2020-2035
  • Figure 15: Global Micro Printing Market Y-o-Y Growth (%) Projections by End Use, 2020-2035
  • Figure 16: Global Micro Printing Market Attractiveness by Application, 2020-2035
  • Figure 17: Global Micro Printing Market Attractiveness by End Use, 2020-2035
  • Figure 18: Global Micro Printing Market Attractiveness by Region, 2020-2035
  • Figure 19: North America Micro Printing Market Value (US$ Mn) by Application, 2020-2035
  • Figure 20: North America Micro Printing Market Value (US$ Mn) by End Use, 2020-2035
  • Figure 21: North America Micro Printing Market Value (US$ Mn) by Country, 2020-2035
  • Figure 22: North America Micro Printing Market Value (US$ Mn) Analysis by Country, 2020-2035
  • Figure 23: North America Micro Printing Market Volume (Units) Analysis by Country, 2020-2035
  • Figure 24: North America Micro Printing Market Value Share (%) and BPS Analysis by Country, 2020-2035
  • Figure 25: North America Micro Printing Market Y-o-Y Growth (%) Projections by Country, 2020-2035
  • Figure 26: North America Micro Printing Market Value (US$ Mn) Analysis by Application, 2020-2035
  • Figure 27: North America Micro Printing Market Volume (Units) Analysis by Application, 2020-2035
  • Figure 28: North America Micro Printing Market Value Share (%) and BPS Analysis by Application, 2020-2035
  • Figure 29: North America Micro Printing Market Y-o-Y Growth (%) Projections by Application, 2020-2035
  • Figure 30: North America Micro Printing Market Value (US$ Mn) Analysis by End Use, 2020-2035
  • Figure 31: North America Micro Printing Market Volume (Units) Analysis by End Use, 2020-2035
  • Figure 32: North America Micro Printing Market Value Share (%) and BPS Analysis by End Use, 2020-2035
  • Figure 33: North America Micro Printing Market Y-o-Y Growth (%) Projections by End Use, 2020-2035
  • Figure 34: North America Micro Printing Market Attractiveness by Application, 2020-2035
  • Figure 35: North America Micro Printing Market Attractiveness by End Use, 2020-2035
  • Figure 36: North America Micro Printing Market Attractiveness by Country, 2020-2035
  • Figure 37: Latin America Micro Printing Market Value (US$ Mn) by Application, 2020-2035
  • Figure 38: Latin America Micro Printing Market Value (US$ Mn) by End Use, 2020-2035
  • Figure 39: Latin America Micro Printing Market Value (US$ Mn) by Country, 2020-2035
  • Figure 40: Latin America Micro Printing Market Value (US$ Mn) Analysis by Country, 2020-2035
  • Figure 41: Latin America Micro Printing Market Volume (Units) Analysis by Country, 2020-2035
  • Figure 42: Latin America Micro Printing Market Value Share (%) and BPS Analysis by Country, 2020-2035
  • Figure 43: Latin America Micro Printing Market Y-o-Y Growth (%) Projections by Country, 2020-2035
  • Figure 44: Latin America Micro Printing Market Value (US$ Mn) Analysis by Application, 2020-2035
  • Figure 45: Latin America Micro Printing Market Volume (Units) Analysis by Application, 2020-2035
  • Figure 46: Latin America Micro Printing Market Value Share (%) and BPS Analysis by Application, 2020-2035
  • Figure 47: Latin America Micro Printing Market Y-o-Y Growth (%) Projections by Application, 2020-2035
  • Figure 48: Latin America Micro Printing Market Value (US$ Mn) Analysis by End Use, 2020-2035
  • Figure 49: Latin America Micro Printing Market Volume (Units) Analysis by End Use, 2020-2035
  • Figure 50: Latin America Micro Printing Market Value Share (%) and BPS Analysis by End Use, 2020-2035
  • Figure 51: Latin America Micro Printing Market Y-o-Y Growth (%) Projections by End Use, 2020-2035
  • Figure 52: Latin America Micro Printing Market Attractiveness by Application, 2020-2035
  • Figure 53: Latin America Micro Printing Market Attractiveness by End Use, 2020-2035
  • Figure 54: Latin America Micro Printing Market Attractiveness by Country, 2020-2035
  • Figure 55: Europe Micro Printing Market Value (US$ Mn) by Application, 2020-2035
  • Figure 56: Europe Micro Printing Market Value (US$ Mn) by End Use, 2020-2035
  • Figure 57: Europe Micro Printing Market Value (US$ Mn) by Country, 2020-2035
  • Figure 58: Europe Micro Printing Market Value (US$ Mn) Analysis by Country, 2020-2035
  • Figure 59: Europe Micro Printing Market Volume (Units) Analysis by Country, 2020-2035
  • Figure 60: Europe Micro Printing Market Value Share (%) and BPS Analysis by Country, 2020-2035
  • Figure 61: Europe Micro Printing Market Y-o-Y Growth (%) Projections by Country, 2020-2035
  • Figure 62: Europe Micro Printing Market Value (US$ Mn) Analysis by Application, 2020-2035
  • Figure 63: Europe Micro Printing Market Volume (Units) Analysis by Application, 2020-2035
  • Figure 64: Europe Micro Printing Market Value Share (%) and BPS Analysis by Application, 2020-2035
  • Figure 65: Europe Micro Printing Market Y-o-Y Growth (%) Projections by Application, 2020-2035
  • Figure 66: Europe Micro Printing Market Value (US$ Mn) Analysis by End Use, 2020-2035
  • Figure 67: Europe Micro Printing Market Volume (Units) Analysis by End Use, 2020-2035
  • Figure 68: Europe Micro Printing Market Value Share (%) and BPS Analysis by End Use, 2020-2035
  • Figure 69: Europe Micro Printing Market Y-o-Y Growth (%) Projections by End Use, 2020-2035
  • Figure 70: Europe Micro Printing Market Attractiveness by Application, 2020-2035
  • Figure 71: Europe Micro Printing Market Attractiveness by End Use, 2020-2035
  • Figure 72: Europe Micro Printing Market Attractiveness by Country, 2020-2035
  • Figure 73: East Asia Micro Printing Market Value (US$ Mn) by Application, 2020-2035
  • Figure 74: East Asia Micro Printing Market Value (US$ Mn) by End Use, 2020-2035
  • Figure 75: East Asia Micro Printing Market Value (US$ Mn) by Country, 2020-2035
  • Figure 76: East Asia Micro Printing Market Value (US$ Mn) Analysis by Country, 2020-2035
  • Figure 77: East Asia Micro Printing Market Volume (Units) Analysis by Country, 2020-2035
  • Figure 78: East Asia Micro Printing Market Value Share (%) and BPS Analysis by Country, 2020-2035
  • Figure 79: East Asia Micro Printing Market Y-o-Y Growth (%) Projections by Country, 2020-2035
  • Figure 80: East Asia Micro Printing Market Value (US$ Mn) Analysis by Application, 2020-2035
  • Figure 81: East Asia Micro Printing Market Volume (Units) Analysis by Application, 2020-2035
  • Figure 82: East Asia Micro Printing Market Value Share (%) and BPS Analysis by Application, 2020-2035
  • Figure 83: East Asia Micro Printing Market Y-o-Y Growth (%) Projections by Application, 2020-2035
  • Figure 84: East Asia Micro Printing Market Value (US$ Mn) Analysis by End Use, 2020-2035
  • Figure 85: East Asia Micro Printing Market Volume (Units) Analysis by End Use, 2020-2035
  • Figure 86: East Asia Micro Printing Market Value Share (%) and BPS Analysis by End Use, 2020-2035
  • Figure 87: East Asia Micro Printing Market Y-o-Y Growth (%) Projections by End Use, 2020-2035
  • Figure 88: East Asia Micro Printing Market Attractiveness by Application, 2020-2035
  • Figure 89: East Asia Micro Printing Market Attractiveness by End Use, 2020-2035
  • Figure 90: East Asia Micro Printing Market Attractiveness by Country, 2020-2035
  • Figure 91: South Asia Micro Printing Market Value (US$ Mn) by Application, 2020-2035
  • Figure 92: South Asia Micro Printing Market Value (US$ Mn) by End Use, 2020-2035
  • Figure 93: South Asia Micro Printing Market Value (US$ Mn) by Country, 2020-2035
  • Figure 94: South Asia Micro Printing Market Value (US$ Mn) Analysis by Country, 2020-2035
  • Figure 95: South Asia Micro Printing Market Volume (Units) Analysis by Country, 2020-2035
  • Figure 96: South Asia Micro Printing Market Value Share (%) and BPS Analysis by Country, 2020-2035
  • Figure 97: South Asia Micro Printing Market Y-o-Y Growth (%) Projections by Country, 2020-2035
  • Figure 98: South Asia Micro Printing Market Value (US$ Mn) Analysis by Application, 2020-2035
  • Figure 99: South Asia Micro Printing Market Volume (Units) Analysis by Application, 2020-2035
  • Figure 100: South Asia Micro Printing Market Value Share (%) and BPS Analysis by Application, 2020-2035
  • Figure 101: South Asia Micro Printing Market Y-o-Y Growth (%) Projections by Application, 2020-2035
  • Figure 102: South Asia Micro Printing Market Value (US$ Mn) Analysis by End Use, 2020-2035
  • Figure 103: South Asia Micro Printing Market Volume (Units) Analysis by End Use, 2020-2035
  • Figure 104: South Asia Micro Printing Market Value Share (%) and BPS Analysis by End Use, 2020-2035
  • Figure 105: South Asia Micro Printing Market Y-o-Y Growth (%) Projections by End Use, 2020-2035
  • Figure 106: South Asia Micro Printing Market Attractiveness by Application, 2020-2035
  • Figure 107: South Asia Micro Printing Market Attractiveness by End Use, 2020-2035
  • Figure 108: South Asia Micro Printing Market Attractiveness by Country, 2020-2035
  • Figure 109: Oceania Micro Printing Market Value (US$ Mn) by Application, 2020-2035
  • Figure 110: Oceania Micro Printing Market Value (US$ Mn) by End Use, 2020-2035
  • Figure 111: Oceania Micro Printing Market Value (US$ Mn) by Country, 2020-2035
  • Figure 112: Oceania Micro Printing Market Value (US$ Mn) Analysis by Country, 2020-2035
  • Figure 113: Oceania Micro Printing Market Volume (Units) Analysis by Country, 2020-2035
  • Figure 114: Oceania Micro Printing Market Value Share (%) and BPS Analysis by Country, 2020-2035
  • Figure 115: Oceania Micro Printing Market Y-o-Y Growth (%) Projections by Country, 2020-2035
  • Figure 116: Oceania Micro Printing Market Value (US$ Mn) Analysis by Application, 2020-2035
  • Figure 117: Oceania Micro Printing Market Volume (Units) Analysis by Application, 2020-2035
  • Figure 118: Oceania Micro Printing Market Value Share (%) and BPS Analysis by Application, 2020-2035
  • Figure 119: Oceania Micro Printing Market Y-o-Y Growth (%) Projections by Application, 2020-2035
  • Figure 120: Oceania Micro Printing Market Value (US$ Mn) Analysis by End Use, 2020-2035
  • Figure 121: Oceania Micro Printing Market Volume (Units) Analysis by End Use, 2020-2035
  • Figure 122: Oceania Micro Printing Market Value Share (%) and BPS Analysis by End Use, 2020-2035
  • Figure 123: Oceania Micro Printing Market Y-o-Y Growth (%) Projections by End Use, 2020-2035
  • Figure 124: Oceania Micro Printing Market Attractiveness by Application, 2020-2035
  • Figure 125: Oceania Micro Printing Market Attractiveness by End Use, 2020-2035
  • Figure 126: Oceania Micro Printing Market Attractiveness by Country, 2020-2035
  • Figure 127: MEA Micro Printing Market Value (US$ Mn) by Application, 2020-2035
  • Figure 128: MEA Micro Printing Market Value (US$ Mn) by End Use, 2020-2035
  • Figure 129: MEA Micro Printing Market Value (US$ Mn) by Country, 2020-2035
  • Figure 130: MEA Micro Printing Market Value (US$ Mn) Analysis by Country, 2020-2035
  • Figure 131: MEA Micro Printing Market Volume (Units) Analysis by Country, 2020-2035
  • Figure 132: MEA Micro Printing Market Value Share (%) and BPS Analysis by Country, 2020-2035
  • Figure 133: MEA Micro Printing Market Y-o-Y Growth (%) Projections by Country, 2020-2035
  • Figure 134: MEA Micro Printing Market Value (US$ Mn) Analysis by Application, 2020-2035
  • Figure 135: MEA Micro Printing Market Volume (Units) Analysis by Application, 2020-2035
  • Figure 136: MEA Micro Printing Market Value Share (%) and BPS Analysis by Application, 2020-2035
  • Figure 137: MEA Micro Printing Market Y-o-Y Growth (%) Projections by Application, 2020-2035
  • Figure 138: MEA Micro Printing Market Value (US$ Mn) Analysis by End Use, 2020-2035
  • Figure 139: MEA Micro Printing Market Volume (Units) Analysis by End Use, 2020-2035
  • Figure 140: MEA Micro Printing Market Value Share (%) and BPS Analysis by End Use, 2020-2035
  • Figure 141: MEA Micro Printing Market Y-o-Y Growth (%) Projections by End Use, 2020-2035
  • Figure 142: MEA Micro Printing Market Attractiveness by Application, 2020-2035
  • Figure 143: MEA Micro Printing Market Attractiveness by End Use, 2020-2035
  • Figure 144: MEA Micro Printing Market Attractiveness by Country, 2020-2035

Frequently Asked Questions

How much is the Micro Printing Market worth?

The micro printing market was valued at US$ 595.8 Mn in 2021 and is estimated to grow at CAGR of 8.6% during the forecast period, which will reach the market value of US$ 1459.2 Mn by 2032.

Which country is expected to display highest growth rate in Micro Printing Market demand during the forecast period?

China market is expected to show a rapid growth during the forecast period, where it will represent a CAGR of around 10.4%.

What is the India micro printing market share outlook in 2021?

The micro printing market share in India was around 8.0% in 2021.

At what rate did the demand for micro printing market grow during 2022-2032?

The micro printing market growth between 2022 and 2032 is around 8.6%.

What are the top 3 countries driving demand?

The top 3 countries driving demand for cloud integration include the China, India and USA

Who are some of the leading companies offering Micro Printing solutions?

Some of the leading companies in this landscape are Xerox Corporation, Videojet Technologies, Matica Technologies AG, Team NiSCA , Ricoh Company Ltd. among others.

What will be the last 5-year micro printing market CAGR?

The market in last 5 years (2017 – 2021) has grown by a CAGR of 2.8%.

Which is the leading type segment in micro printing market?

UV invisible inks segment is expected to dominate the market in the year 2021, generating a maximum revenue, by the end of 2032.

What is the growth rate of currency in the application category, over the forecast period?

Currency has the CAGR of 5.5% for the forecast period.

What is the estimated market value of micro printing market for 2023?

The estimated market value for micro printing market for the year 2023 is US$ 683.9 Mn.

What is the growth rate for East Asia for micro printing market for the forecast period?

For East Asia region, the CAGR for the forecast period is estimated to be 10.1%.

Explore Similar Insights

Future Market Insights

Micro Printing Market