

- Market Size (2026)
- USD 271.5 Mn
- Forecast (2036)
- USD 619.5 Mn
- CAGR (2026 to 2036)
- 8.6%
How big is the micronutrient uptake boosters market in 2026?
Demand for micronutrient uptake boosters is projected to expand at 8.6% CAGR between 2026 and 2036. Industry value grows from USD 250.0 million in 2025 to USD 271.5 million in 2026 and is projected to reach USD 619.5 million by 2036.
Changing soil and water pH can make applied micronutrients unavailable to crops. FMI forecasts micronutrient uptake boosters market to increase from USD 250.0 million in 2025 to USD 271.5 million in 2026, before reaching USD 619.5 million by 2036 at 8.6% CAGR. Chelating products keep iron, zinc, manganese and copper soluble across fertigation, foliar or soil programs. USDA ERS projects U.S. expenditure on fertilizers, lime and soil conditioners at USD 39.8 billion in 2026.[1] This is likely to improve evaluation of synthetic chelates and plant-based chelators, although crop response and treatment cost can impede repeat use.
Controlled application creates different growth conditions across the USA and South Korea. The USA is expected to expand at 8.4% CAGR during 2026 to 2036, whereas South Korea is anticipated to record 8.1%. The USA had 23,060 horticulture operations with USD 18.3 billion in 2024, giving micronutrients scope across protected crops.[11] South Korea plans smart systems across 35% of 55,000 greenhouse hectares by 2029, supporting automated delivery but requiring trained services.[15] FMI expects compatible formulations with stated pH range to receive preference. USA opportunity rests on an established horticulture base, while South Korean growth will depend more on smart-farming installation and technical support.
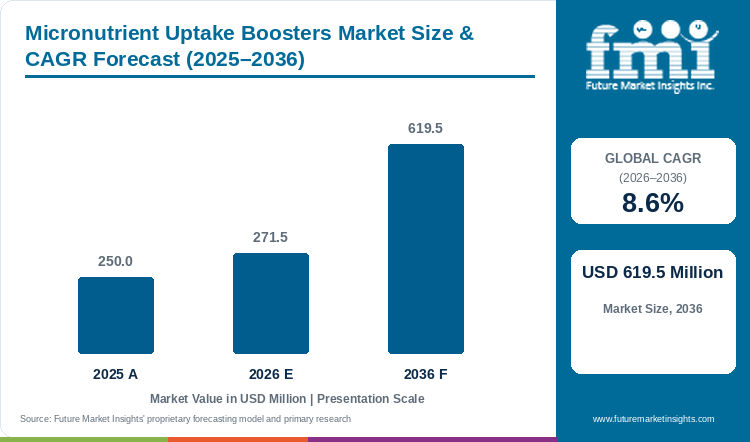
Micronutrient Uptake Boosters Market Size & CAGR Forecast (2025-2036)
| Year | Basis | Market value (USD million) |
|---|---|---|
| 2025 | Actual | 250.0 |
| 2026 | Estimate | 271.5 |
| 2036 | Forecast | 619.5 |
| CAGR, 2026 to 2036 | 8.6% | |
Source: Future Market Insights proprietary forecasting model and primary research.
Key Takeaways
- The market is valued at USD 271.5 million in 2026 and is projected to reach USD 619.5 million by 2036, owing to increasing use of soluble micronutrients.
- EDTA and synthetic chelates are projected to hold 47.6% share, while iron is estimated to account for 38.2% in 2026.
- Cereals and grains are likely to account for 35.9% share in 2026, backed by large acreage and regular fertilizer application.
- Fertigation is expected to hold 46.8% share in 2026 as it enables timed application of soluble micronutrients through irrigation systems.
- Agri-input distributors are set to hold 43.5% share in 2026, supported by local product availability and application guidance.
- The USA and South Korea are projected to expand at 8.4% and 8.1% CAGR respectively through 2036.
Analyst Perspective
“I see demand moving towards formulations which remain available inside the actual water, pH and crop conditions used by growers. Adoption will become wider where suppliers connect dose with crop stage and provide guidance that can be followed on farm.”
- Nikhil Kaitwade, Principal Consultant, Future Market Insights.
How is the micronutrient uptake boosters market segmented?
Micronutrient uptake boosters market is segmented by chelating or complexing agent, nutrient, crop type, application method, sales channel and region. In 2026, EDTA and synthetic chelates are projected at 47.6%, iron at 38.2%, cereals and grains at 35.9%, fertigation at 46.8% and agri-input distributors at 43.5%.
Micronutrient uptake boosters market is segmented by chelating or complexing agent, nutrient, crop type, application method, sales channel and region.
By chelating or complexing agent: EDTA and synthetic chelates, amino acid complexes, organic acid complexes, and lignosulfonates and others.
By nutrient: iron, zinc, manganese and copper, boron, molybdenum, and multi-nutrient, and others.
By crop type: cereals and grains, fruits and vegetables, oilseeds and pulses, turf and ornamentals, and others.
By application method: fertigation, foliar, soil, and others.
By sales channel: agri-input distributors, cooperatives, agri-retail chains, online or direct-to-farm, and others.
By region: North America, Latin America, Western Europe, Eastern Europe, East Asia, South Asia and Pacific, and Middle East and Africa.
What makes EDTA and synthetic chelates central to the chelating or complexing agent category?
EDTA and synthetic chelates are projected to account for 47.6% in 2026, supported by established specifications across soil, foliar, hydroponic, and fertigation applications.
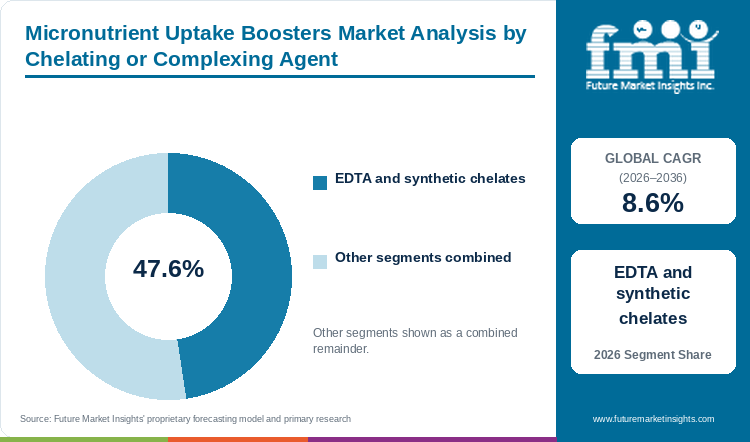
| Agent type | Share (2026) |
|---|---|
| EDTA and synthetic chelates | 47.6% |
| Other segments combined | 52.4%* |
| Total | 100.0% |
| Metric | Value |
|---|---|
| Global CAGR (2026-2036) | 8.6% |
| Leading segment | EDTA and synthetic chelates |
Synthetic chelates are facing higher preference where soil, water or growth-medium pH can reduce the availability of micronutrients. Nouryon offers EDTA, DTPA, EDDHA, HEDTA and HBED options for soil, foliar, hydroponic and fertigation applications.[3] FMI research indicates that synthetic chelates provide stable metal binding across wide pH variations, giving formulators flexibility across application systems. Alongside synthetic ligands, formulators also evaluate lignosulfonate chelates for sustainable programs. Therefore, formulators can select the chemistry according to crop and application route, rather than using one chelate across every pH condition.
- EDTA and synthetic chelates are projected to hold 47.6% of chelating or complexing agent demand in 2026, supported by established specifications across soil, foliar, hydroponic, and fertigation applications.
- Product selection: growers consider chelate stability, nutrient concentration, application method and crop requirement before regular use.
Why does iron anchor the nutrient category?
By nutrient, iron is estimated to hold 38.2% in 2026, owing to visible deficiency symptoms and strong sensitivity to pH conditions.
Iron deficiency becomes visible through crop symptoms, but adding more iron does not always mean that the plant can use it. Under alkaline soil and water conditions, iron availability reduces quickly and the deficiency can continue after application.[4] Commercial programs also incorporate gluconate crop chelates to improve trace element mobility under alkaline conditions. This is moving growers towards products carrying a defined stability range, as the selected chelate has to suit the crop, application method and growth-medium pH.
- Iron is estimated to account for 38.2% of nutrient demand in 2026, driven by visible chlorosis symptoms and high sensitivity to soil alkalinity.
- Product selection: soluble form, active pH range, dose and crop response remain important for iron-based formulations.
What supports cereals and grains as a preferred crop category?
Cereals and grains are likely to capture 35.9% share in 2026, attributable to broad acreage and repeatable fertilizer passes.
Cereals and grains create large product demand as a smaller treatment rate is applied across broad cultivated area. These crops already receive regular fertilizer passes, due to which micronutrient correction can be added without creating a separate field operation. USDA continues to track fertilizer use and cost across major field crops, supporting targeted use where soil or tissue testing has identified the deficiency.[5] Broad-acre growers increasingly combine standard inputs with specialty fertilizers to balance micronutrient levels. However, treatment cost and diagnosed deficiency will decide whether broad-acre programs continue with routine booster applications.
- Cereals and grains are likely to capture 35.9% share in 2026, attributable to broad acreage and repeatable fertilizer passes.
- Product selection: treatment cost, diagnosed deficiency and compatibility with existing fertilizer passes influence broad-acre use.
How does fertigation meet application method needs?
In 2026, fertigation is expected to lead application method with 46.8% share, driven by scheduled delivery through irrigation systems.
Fertigation is gaining preference as soluble micronutrients can be delivered with irrigation water in smaller doses at different crop stages. Growers can also change the feeding program according to crop response instead of applying the complete quantity at one time. In February 2025, Haifa Group launched fertigation-grade soluble solutions designed for precise nutrient uptake across drip systems.[6] Drip delivery is often complemented by mineral solubilizer blends to prevent nozzle clogging and maintain active trace element availability. However, tank compatibility and water pH continue to dictate commercial adoption.
- Fertigation is expected to lead application method with 46.8% share in 2026, driven by scheduled delivery through irrigation systems.
- Product selection: solubility, tank compatibility and operation of irrigation equipment influence fertigation use.
Which conditions keep agri-input distributors relevant in sales channels?
Agri-input distributors are set to lead sales channel with 43.5% share in 2026, supported by local diagnosis and application guidance.
Micronutrient boosters require growers to select the nutrient form, dose, crop stage and correct mixing order before the product is applied. Agri-input distributors remain important as they provide local inventory along with guidance suited to the crop and application method. The Fertilizer Institute reported in August 2026 that 65 million acres of U.S. cropland are managed under 4R Nutrient Stewardship, highlighting the role of retail crop advisers in precision micronutrient recommendations.[7] Retail agronomists also educate growers on pairing chelates with agricultural surfactants for improved foliar uptake. Consequently, local agronomy coverage continues to anchor channel preference.
- Agri-input distributors are set to lead sales channel with 43.5% share in 2026, supported by local diagnosis and application guidance.
- Product selection: local inventory, product knowledge and application support influence distributor-led sales.
What are the drivers, restraints, and opportunities in the micronutrient uptake boosters market?
Restricted nutrient availability is driving demand, higher formulation cost is restraining wider use, while controlled dosing is creating growth opportunities.
- Driver: Restricted nutrient availability in soil and water continues to support corrective uptake booster demand through 2036.
- Restraint: Higher chelating chemistry and formulation costs will continue to restrict wider adoption across lower-value crops through 2036.
- Opportunity: Controlled dosing through smart irrigation and automated systems is expected to create growth opportunities through 2036.
Nutrient Accessibility Supports Corrective Use
Micronutrients can remain in the soil and still become unavailable to plants because pH, irrigation water and other nutrients affect their movement. This difference between applied and available nutrient is creating the need for products which keep the selected element soluble. An FMI analyst notes that rising focus on nutrient use efficiency continues to encourage targeted uptake booster adoption. In November 2025, USDA ERS documented that precision nutrient-management practices improve plant uptake efficiency while minimizing field nutrient losses.[8] Formulators are also pairing chelated nutrients with citrate mineral blends to stabilize nutrient access across root zones. Therefore, boosters carrying a stated pH range are facing higher demand, while soil, tissue and water analysis continues to decide which nutrient requires correction.
Chelate Costs Narrow Eligible Uses
Chelating chemistry carries a higher cost, which restricts wider use where the crop value is lower or the deficiency is not properly diagnosed. In June 2026, BASF announced a USD 0.33 per kilogram price increase for selected Trilon chelating agents in North America, owing to higher raw material, energy and logistics costs.[9] Such price movement raises formulation cost and keeps stronger adoption around valuable crops, protected cultivation and deficiencies where the crop response can support added expense. Cost-conscious growers frequently compare synthetic chelates against inorganic alternatives like zinc sulphate before committing to multi-pass programs. Operating margins will therefore continue to dictate the speed of broad-acre adoption through 2036.
Controlled Dosing Expands Repeatable Programs
Smart irrigation and automated dosing systems are creating wider application opportunities for soluble micronutrient formulations. In September 2026, researchers demonstrated automated sensor-guided fertigation systems in PLOS ONE that calibrate nutrient dosing directly to canopy growth, cutting application waste while stabilizing plant nutrition.[10] Automated platforms are increasingly integrated with advanced inputs such as nano fertilizers to optimize uptake rates. Growers using these systems can apply smaller quantities at the required crop stage and change the nutrient program during the production cycle. However, products must remain soluble in local water and work with installed equipment, otherwise automation alone will not result in regular adoption.
Which country CAGRs are profiled in the micronutrient uptake boosters market?
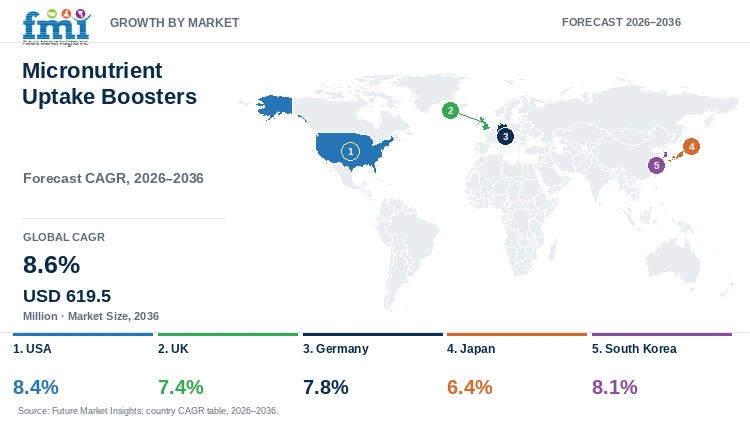
| Country | CAGR, 2026-2036 |
|---|---|
| USA | 8.4% |
| UK | 7.4% |
| Germany | 7.8% |
| Japan | 6.4% |
| South Korea | 8.1% |
How do country-level CAGRs compare in the micronutrient uptake boosters market?
As per the analysis from FMI, country growth rates differ through 2036 because regulatory frameworks, protected cultivation density, and irrigation infrastructures vary across markets. The USA and South Korea lead projected growth above 8.0 per cent, while Germany, the UK, and Japan follow distinct agricultural structures.
- USA demand gains from expanding protected horticulture and established agronomic distribution channels.
- The UK combines high-input arable production with national regulatory reforms governing fertilising products.
- Germany relies on intensive vegetable cultivation and demanding documentation for commercial crop nutrition.
- Japan emphasizes labor-saving agricultural technology, automated water management, and strict application standards.
- South Korea benefits from national smart-farming targets and automated nutrient delivery across greenhouse hectares.
Full report country CAGRs cover: North America; Latin America; Western Europe; Eastern Europe; East Asia; South Asia and Pacific; Middle East and Africa.
Country-wise Analysis
- By 2036, USA demand is projected to grow at 8.4% CAGR, owing to increasing protected horticulture and availability of established agronomy channels. USDA reported 23,060 horticulture operations and USD 18.3 billion sales in 2024.[11] Food crops grown under protection reached USD 1.01 billion, up 44% from 2019. U.S. growers frequently combine chelated micronutrients with biostimulant formulations to relieve environmental crop stress. This protected production enables adjustment of irrigation and crop nutrition at different stages, which is supporting soluble micronutrient products. However, adoption across broad-acre crops will remain dependent on diagnosed deficiency and acceptable treatment cost.
- The UK micronutrient uptake boosters outlook is anticipated to advance at 7.4% CAGR, influenced by changes in fertilising-product regulation. Defra opened reform proposals in March 2026 and reported 83 consultation responses after the consultation was closed.[12] The framework covers conformity assessment, market access and technical requirements for a wider product range. This will support products carrying clear nutrient form, use rate and application instructions. Agri-input distributors will remain important as growers require guidance during selection and application.
- Micronutrient uptake booster demand in Germany is forecast to rise at 7.8% CAGR, supported by intensive vegetable cultivation. Destatis reported 4.3 million tonnes of outdoor vegetables from 130,448.9 hectares in 2025.[13] Large vegetable production is increasing the requirement for crop-specific nutrient correction, especially where pH restricts iron and other micronutrients. Soluble formulations will face higher adoption where water quality, mixing behavior and crop requirement are known before application.
- Adoption of micronutrient uptake boosters in Japan is estimated to expand at 6.4% CAGR through 2036, attributable to increasing use of labor-saving agriculture technology. MAFF reported that smart agriculture demonstrations have been conducted across 217 districts in Japan.[14] FMI data suggests that automated water management and cultivation monitoring support controlled application of soluble micronutrients. However, local trials, Japanese application instructions and compatibility with existing equipment will continue to influence product adoption.
- South Korea is estimated to post 8.1% CAGR over the forecast period, backed by national smart-farming targets. MAFRA plans smart systems across 35% of about 55,000 greenhouse hectares by 2029 and at least one smart technology across 20% of major field-crop areas.[15] Automated irrigation and nutrient delivery will support repeated dosing of soluble micronutrients. However, shortage of trained specialists and local service providers can affect adoption outside established production clusters.
Who are the notable companies in the micronutrient uptake boosters market?
Brandt, Rovensa Next, BASF, Nouryon, Yara International, ICL Group, Haifa Group, and Valagro are notable companies in the market.
In the FMI report, supplier positioning is linked to chelate stability, water solubility, and crop-specific agronomic guidance. Companies are participating through chelating chemistry, water-soluble fertilizers, foliar formulations and crop-specific bionutrition products. BASF and Nouryon provide chemistry for keeping micronutrients available, whereas Yara, ICL and Haifa connect soluble nutrition with fertigation and foliar use. Brandt, Rovensa Next and Valagro are focusing more towards crop-specific nutrition and bionutrition programs. Product range, regional availability, crop evidence and support provided after sale are therefore becoming important in their market presence.
- Chelating chemistry suppliers: BASF and Nouryon provide synthetic chelates and complexing agents for agricultural formulations.
- Soluble fertilizer and fertigation specialists: Yara International, ICL Group, and Haifa Group connect water-soluble nutrition with irrigation systems.
- Foliar nutrition and bionutrition platforms: Brandt, Rovensa Next, and Valagro emphasize crop-specific foliar delivery and plant nutrition programs.
Competitive Benchmarking: Micronutrient Uptake Boosters Market
| Company | Chelate stability | Application fit | Current activity | Reach |
|---|---|---|---|---|
| Brandt | Medium | High | High | Medium |
| Rovensa Next | High | High | High | High |
| BASF | High | High | High | High |
| Nouryon | High | High | High | High |
| Yara International | High | High | High | High |
| ICL Group | High | High | High | High |
| Haifa Group | High | High | High | High |
| Valagro | High | High | High | High |
High represents broad public evidence across the stated capability, Medium represents narrower evidence, and Low represents limited documented breadth. These ratings describe public company capability and do not indicate product quality, revenue share or company ranking.
Key Developments in the Micronutrient Uptake Boosters Market
- In June 2026, BASF announced a price adjustment for selected Trilon chelating agents in North America in response to input and logistics costs.
- In March 2026, ICL Group opened a 28,000-square-meter specialty and water-soluble fertilizer manufacturing facility in Maharashtra, India.
- In December 2025, Rovensa Next launched Myndra in Europe following regulatory recognition under the EU Fertilising Products Regulation.
- In February 2025, Haifa Group introduced fertigation-grade soluble solutions designed for balanced crop nutrition and precise drip application.
Key Players in the Micronutrient Uptake Boosters Market
Chelating chemistry and formulation suppliers
- BASF
- Nouryon
Water-soluble and specialty fertilizer specialists
- Yara International
- ICL Group
- Haifa Group
Foliar nutrition and biologicals platforms
- Brandt
- Rovensa Next
- Valagro
Micronutrient Uptake Boosters Market - Report Scope
| Coverage field | Report scope |
|---|---|
| Market breakdown | Chelating or complexing agent; nutrient; crop type; application method; sales channel; region. |
| Quantitative units | USD million. |
| Market definition | Supplier revenue from agricultural formulations intended to keep trace nutrients available for plant uptake. |
| Exclusions | Bulk macronutrient fertilizers, crop revenue, non-agricultural chelants, and adjacent products without micronutrient-uptake function. |
| Forecast period | 2026 to 2036. |
| Validation note | Market values, segment shares, and country growth rates cover the 2026 to 2036 forecast period. |
Micronutrient Uptake Boosters Market - Research Methodology
| Method | Approach |
|---|---|
| Primary Research | Analysts gathered input from manufacturers, service providers, technology developers, distributors, end users, procurement teams, and subject-matter experts. Interviews examined purchasing decisions, product evaluation, adoption barriers, approval requirements, pricing, and technical support. |
| Desk Research | Desk research covered government statistics, regulatory publications, trade data, industry associations, technical literature, standards, company filings, product information, and official corporate announcements. Sources were checked for date, geography, and direct market relevance. |
| Market Sizing and Forecasting | The model combined the baseline value with historical performance, segment structure, pricing and volume indicators, adoption levels, company participation, and country demand conditions. Forecast assumptions included regulation, technology use, purchasing cycles, and supply availability. |
| Data Validation | Estimates were checked against public data, company activity, trade patterns, and primary-research findings. Adjacent categories, unsupported claims, overlapping revenue, and activities outside the defined market were excluded. |
Micronutrient Uptake Boosters Market by Segments
Micronutrient Uptake Boosters Market segmented by Chelating or Complexing Agent:
- EDTA and synthetic chelates
- Amino acid complexes
- Organic acid complexes
- Lignosulfonates and others
Micronutrient Uptake Boosters Market segmented by Nutrient:
- Iron
- Zinc
- Manganese and copper
- Boron, molybdenum, and multi-nutrient
- Others
Micronutrient Uptake Boosters Market segmented by Crop Type:
- Cereals and grains
- Fruits and vegetables
- Oilseeds and pulses
- Turf and ornamentals
- Others
Micronutrient Uptake Boosters Market segmented by Application Method:
- Fertigation
- Foliar
- Soil
- Others
Micronutrient Uptake Boosters Market segmented by Sales Channel:
- Agri-input distributors
- Cooperatives
- Agri-retail chains
- Online or direct-to-farm
- Others
Micronutrient Uptake Boosters Market by Region
- North America
- United States
- Canada
- Latin America
- Brazil
- Mexico
- Argentina
- Chile
- Western Europe
- Germany
- France
- United Kingdom
- Italy
- Spain
- Benelux
- Nordics
- Eastern Europe
- Poland
- Czech Republic
- Romania
- Hungary
- East Asia
- China
- Japan
- South Korea
- South Asia and Pacific
- India
- ASEAN
- Australia and New Zealand
- Middle East and Africa
- GCC Countries
- South Africa
- Türkiye
- Israel
Research Sources and Bibliography
- [1] U.S. Department of Agriculture, Economic Research Service. (2026, September 3). Farm sector income forecast: Production expenses.
- [2] Food and Agriculture Organization of the United Nations. (2026, June 8). FAO urges open trade on all agricultural inputs and efficient fertilizer use amid global food production risks.
- [3] Nouryon. (Accessed 2026, October 6). Crop nutrition for improved crop quality.
- [4] Nouryon. (Accessed 2026, October 6). High performance chelated micronutrients.
- [5] U.S. Department of Agriculture, Economic Research Service. (2025, December 30). Fertilizer use and price.
- [6] Haifa Group. (2025, February). Haifa Soluble DUA fertigation-grade crop nutrition solutions.
- [7] The Fertilizer Institute. (2026, August 25). Fertilizer industry celebrates the grower-retailer partnerships driving nutrient stewardship forward.
- [8] U.S. Department of Agriculture, Economic Research Service. (2025, November 13). Fertilizers and pesticides.
- [9] BASF. (2026, June 5). BASF to adjust prices for select Trilon chelating agents in North America.
- [10] Son, S., Wei-Kocsis, J., Deering, A., Hoagland, L., & Nemali, K. (2026, September 3). Automated fertilizer application based on plant growth using digital imaging. PLOS ONE, 21(9), e0357482.
- [11] U.S. Department of Agriculture, National Agricultural Statistics Service. (2026, February 26). U.S. horticulture operations report USD 18.3 billion in sales. https://www.nass.usda.gov/Newsroom/2026/02-26-2026.php
- [12] Department for Environment, Food & Rural Affairs. (2026, September 9). Marketing fertilising products in the UK: regulatory reform. https://www.gov.uk/government/consultations/marketing-fertilising-products-in-the-uk-regulatory-reform
- [13] German Federal Statistical Office. (2026, February 26). Vegetable farms, cultivation areas, yields, and harvest volumes in 2025. https://www.destatis.de/DE/Themen/Branchen-Unternehmen/Landwirtschaft-Forstwirtschaft-Fischerei/Obst-Gemuese-Gartenbau/Tabellen/betriebe-anbau-erntemenge-gemuese.html
- [14] Ministry of Agriculture, Forestry and Fisheries of Japan. (2025, October). Promotion of Smart Agriculture. https://www.maff.go.jp/e/policies/tech_res/smaagri/PDF/Promotion_of_SmartAgriculture_250131.pdf
- [15] Ministry of Agriculture, Food and Rural Affairs, Republic of Korea. (2025, February 27). First master plan for promotion of the growth of the smart-farming industry for 2025-2029.
- [16] ICL Group. (2026, March 18). ICL Group opens specialty fertilizer manufacturing facility in India.
- [17] Rovensa Next. (2025, December 9). Rovensa Next launches Myndra in Europe.
- [18] Yara International. (2025, November). Yara expands water-soluble fertilizer capacity in North America.
This bibliography is provided for reader reference. The full report contains the complete reference list and detailed citations.
This Report Answers
- What is Micronutrient Uptake Boosters Market worth during 2026?
- What value is Micronutrient Uptake Boosters Market projected by 2036?
- Which chelating or complexing agent holds notable Micronutrient Uptake Boosters Market share?
- Which nutrient holds notable Micronutrient Uptake Boosters Market share?
- Which countries have notable Micronutrient Uptake Boosters Market growth?
- Which companies are notable in Micronutrient Uptake Boosters Market today?
Frequently Asked Questions
How large is the Micronutrient Uptake Boosters Market expected to be in 2026?
Future Market Insights estimates that the micronutrient uptake boosters market will reach USD 271.5 million in 2026. The market is projected to expand further and reach USD 619.5 million by 2036 as soluble formulations enter more crop programs.
What CAGR is forecast for the Micronutrient Uptake Boosters Market through 2036?
As per FMI, the micronutrient uptake boosters market is projected to grow at an 8.6% CAGR from 2026 to 2036. Growth is supported by demand for soluble micronutrients suited to crop, pH and application conditions.
Which chelating or complexing agent holds a notable micronutrient uptake boosters demand share in 2026?
Future Market Insights projects EDTA and synthetic chelates to hold 47.6% of chelating or complexing agent demand in 2026. The segment benefits from established use across soil, foliar, hydroponic and fertigation applications.
Which nutrient segment holds a notable micronutrient uptake boosters share in 2026?
FMI finds that iron will hold 38.2% of nutrient demand in 2026. Demand is supported by visible deficiency and the requirement for keeping iron available under changing pH conditions.
Which country has a notable micronutrient uptake boosters expansion outlook during the forecast period?
Future Market Insights predicts the USA to expand at an 8.4% CAGR during the 2026 to 2036 assessment period. Growth is supported by protected horticulture, distributor coverage and wider use of measured crop-nutrition programs.
Which companies are active in the Micronutrient Uptake Boosters Market during 2026?
As per FMI analysis, notable companies include Brandt, Rovensa Next, BASF, Nouryon, Yara International, ICL Group, Haifa Group, and Valagro. These companies are focusing on chelating chemistry, soluble nutrition, foliar programs, local production and crop-specific support.
Preview the report firsthand - request a free sample
Get SampleGet the brochure for pricing and purchase details.
Get PDFTable of Content
- Key Takeaways
- Market Size and CAGR
- Top Growth Driver
- Fastest Growing Segment
- Leading Region
- Key Companies
- Emerging Opportunities
- Executive Summary
- Global Market Outlook
- Demand-side Trends
- Supply-side Trends
- Technology Roadmap Analysis
- Analysis and Recommendations
- Analyst Perspective (What is happening? Why now? What should investors know?)
- Key Questions Answered
- How large is the market?
- What is the CAGR?
- What are key trends?
- Which region dominates?
- Who are the leaders?
- Market Overview
- Market Coverage / Taxonomy
- Market Definition / Scope / Limitations
- Research Methodology
- Chapter Orientation
- Analytical Lens and Working Hypotheses
- Market Structure, Signals, and Trend Drivers
- Benchmarking and Cross-market Comparability
- Market Sizing, Forecasting, and Opportunity Mapping
- Research Design and Evidence Framework
- Desk Research Programme (Secondary Evidence)
- Expert Input and Fieldwork (Primary Evidence)
- Tooling, Models, and Reference Databases
- Data Engineering and Model Build
- Quality Assurance and Audit Trail
- Market Background
- Market Dynamics (Drivers, Restraints, Opportunity, Trends)
- Scenario Forecast (Optimistic, Likely, Conservative)
- Impact Analysis
- AI Impact
- Sustainability Impact
- Regulatory Impact
- Technology Impact
- Consumer / Buyer Analysis
- Purchase Drivers
- Adoption Barriers
- Buyer Journey
- Opportunity Map Analysis
- Product Life Cycle Analysis
- Supply Chain Analysis
- Investment Feasibility Matrix
- Value Chain Analysis
- PESTLE and Porter's Analysis
- Regulatory Landscape
- Regional Parent Market Outlook
- Production and Consumption Statistics
- Import and Export Statistics
- Global Market Analysis and Forecast, 2021 to 2036
- Historical Market Size Value (USD Million) Analysis, 2021 to 2025
- Current and Future Market Size Value (USD Million) Projections, 2026 to 2036
- Y-o-Y Growth Trend Analysis
- Absolute $ Opportunity Analysis
- Global Market Pricing Analysis, 2021 to 2036
- Global Market Analysis and Forecast, By Chelating or Complexing Agent, 2021 to 2036
- Introduction / Key Findings
- Historical Market Size Value (USD Million) Analysis By Chelating or Complexing Agent, 2021 to 2025
- Current and Future Market Size Value (USD Million) Analysis and Forecast By Chelating or Complexing Agent, 2026 to 2036
- EDTA and synthetic chelates
- Amino acid complexes
- Organic acid complexes
- Lignosulfonates and others
- Y-o-Y Growth Trend Analysis By Chelating or Complexing Agent, 2021 to 2025
- Absolute $ Opportunity Analysis By Chelating or Complexing Agent, 2026 to 2036
- Global Market Analysis and Forecast, By Nutrient, 2021 to 2036
- Introduction / Key Findings
- Historical Market Size Value (USD Million) Analysis By Nutrient, 2021 to 2025
- Current and Future Market Size Value (USD Million) Analysis and Forecast By Nutrient, 2026 to 2036
- Iron
- Zinc
- Manganese and copper
- Boron, molybdenum, and multi-nutrient
- Others
- Y-o-Y Growth Trend Analysis By Nutrient, 2021 to 2025
- Absolute $ Opportunity Analysis By Nutrient, 2026 to 2036
- Global Market Analysis and Forecast, By Crop Type, 2021 to 2036
- Introduction / Key Findings
- Historical Market Size Value (USD Million) Analysis By Crop Type, 2021 to 2025
- Current and Future Market Size Value (USD Million) Analysis and Forecast By Crop Type, 2026 to 2036
- Cereals and grains
- Fruits and vegetables
- Oilseeds and pulses
- Turf and ornamentals
- Others
- Y-o-Y Growth Trend Analysis By Crop Type, 2021 to 2025
- Absolute $ Opportunity Analysis By Crop Type, 2026 to 2036
- Global Market Analysis and Forecast, By Application Method, 2021 to 2036
- Introduction / Key Findings
- Historical Market Size Value (USD Million) Analysis By Application Method, 2021 to 2025
- Current and Future Market Size Value (USD Million) Analysis and Forecast By Application Method, 2026 to 2036
- Fertigation
- Foliar
- Soil
- Others
- Y-o-Y Growth Trend Analysis By Application Method, 2021 to 2025
- Absolute $ Opportunity Analysis By Application Method, 2026 to 2036
- Global Market Analysis and Forecast, By Sales Channel, 2021 to 2036
- Introduction / Key Findings
- Historical Market Size Value (USD Million) Analysis By Sales Channel, 2021 to 2025
- Current and Future Market Size Value (USD Million) Analysis and Forecast By Sales Channel, 2026 to 2036
- Agri-input distributors
- Cooperatives
- Agri-retail chains
- Online or direct-to-farm
- Others
- Y-o-Y Growth Trend Analysis By Sales Channel, 2021 to 2025
- Absolute $ Opportunity Analysis By Sales Channel, 2026 to 2036
- Global Market Analysis and Forecast, By Region, 2021 to 2036
- Introduction
- Historical Market Size Value (USD Million) Analysis By Region, 2021 to 2025
- Current Market Size Value (USD Million) Analysis and Forecast By Region, 2026 to 2036
- North America
- Latin America
- Western Europe
- Eastern Europe
- East Asia
- South Asia and Pacific
- Middle East and Africa
- Market Attractiveness Analysis By Region
- North America Market Analysis and Forecast, By Country, 2021 to 2036
- Historical Market Size Value (USD Million) Trend Analysis By Market Taxonomy, 2021 to 2025
- Market Size Value (USD Million) Forecast By Market Taxonomy, 2026 to 2036
- By Country
- United States
- Canada
- By Chelating or Complexing Agent
- By Nutrient
- By Crop Type
- By Application Method
- By Sales Channel
- By Country
- Market Attractiveness Analysis
- By Country
- By Chelating or Complexing Agent
- By Nutrient
- By Crop Type
- By Application Method
- By Sales Channel
- Key Takeaways
- Latin America Market Analysis and Forecast, By Country
- Historical Market Size Value (USD Million) Trend Analysis By Market Taxonomy, 2021 to 2025
- Market Size Value (USD Million) Forecast By Market Taxonomy, 2026 to 2036
- By Country
- Brazil
- Mexico
- Argentina
- Chile
- By Chelating or Complexing Agent
- By Nutrient
- By Crop Type
- By Application Method
- By Sales Channel
- By Country
- Market Attractiveness Analysis
- By Country
- By Chelating or Complexing Agent
- By Nutrient
- By Crop Type
- By Application Method
- By Sales Channel
- Key Takeaways
- Western Europe Market Analysis and Forecast, By Country
- Historical Market Size Value (USD Million) Trend Analysis By Market Taxonomy, 2021 to 2025
- Market Size Value (USD Million) Forecast By Market Taxonomy, 2026 to 2036
- By Country
- Germany
- France
- United Kingdom
- Italy
- Spain
- Benelux
- Nordics
- By Chelating or Complexing Agent
- By Nutrient
- By Crop Type
- By Application Method
- By Sales Channel
- By Country
- Market Attractiveness Analysis
- By Country
- By Chelating or Complexing Agent
- By Nutrient
- By Crop Type
- By Application Method
- By Sales Channel
- Key Takeaways
- Eastern Europe Market Analysis and Forecast, By Country
- Historical Market Size Value (USD Million) Trend Analysis By Market Taxonomy, 2021 to 2025
- Market Size Value (USD Million) Forecast By Market Taxonomy, 2026 to 2036
- By Country
- Poland
- Czech Republic
- Romania
- Hungary
- By Chelating or Complexing Agent
- By Nutrient
- By Crop Type
- By Application Method
- By Sales Channel
- By Country
- Market Attractiveness Analysis
- By Country
- By Chelating or Complexing Agent
- By Nutrient
- By Crop Type
- By Application Method
- By Sales Channel
- Key Takeaways
- East Asia Market Analysis and Forecast, By Country
- Historical Market Size Value (USD Million) Trend Analysis By Market Taxonomy, 2021 to 2025
- Market Size Value (USD Million) Forecast By Market Taxonomy, 2026 to 2036
- By Country
- China
- Japan
- South Korea
- By Chelating or Complexing Agent
- By Nutrient
- By Crop Type
- By Application Method
- By Sales Channel
- By Country
- Market Attractiveness Analysis
- By Country
- By Chelating or Complexing Agent
- By Nutrient
- By Crop Type
- By Application Method
- By Sales Channel
- Key Takeaways
- South Asia and Pacific Market Analysis and Forecast, By Country
- Historical Market Size Value (USD Million) Trend Analysis By Market Taxonomy, 2021 to 2025
- Market Size Value (USD Million) Forecast By Market Taxonomy, 2026 to 2036
- By Country
- India
- ASEAN
- Australia and New Zealand
- By Chelating or Complexing Agent
- By Nutrient
- By Crop Type
- By Application Method
- By Sales Channel
- By Country
- Market Attractiveness Analysis
- By Country
- By Chelating or Complexing Agent
- By Nutrient
- By Crop Type
- By Application Method
- By Sales Channel
- Key Takeaways
- Middle East and Africa Market Analysis and Forecast, By Country
- Historical Market Size Value (USD Million) Trend Analysis By Market Taxonomy, 2021 to 2025
- Market Size Value (USD Million) Forecast By Market Taxonomy, 2026 to 2036
- By Country
- GCC Countries
- South Africa
- Türkiye
- Israel
- By Chelating or Complexing Agent
- By Nutrient
- By Crop Type
- By Application Method
- By Sales Channel
- By Country
- Market Attractiveness Analysis
- By Country
- By Chelating or Complexing Agent
- By Nutrient
- By Crop Type
- By Application Method
- By Sales Channel
- Key Takeaways
- Key Countries Market Analysis
- United States
- Pricing Analysis
- Market Share Analysis, 2025
- By Chelating or Complexing Agent
- By Nutrient
- By Crop Type
- By Application Method
- By Sales Channel
- Canada
- Pricing Analysis
- Market Share Analysis, 2025
- By Chelating or Complexing Agent
- By Nutrient
- By Crop Type
- By Application Method
- By Sales Channel
- Mexico
- Pricing Analysis
- Market Share Analysis, 2025
- By Chelating or Complexing Agent
- By Nutrient
- By Crop Type
- By Application Method
- By Sales Channel
- Brazil
- Pricing Analysis
- Market Share Analysis, 2025
- By Chelating or Complexing Agent
- By Nutrient
- By Crop Type
- By Application Method
- By Sales Channel
- Chile
- Pricing Analysis
- Market Share Analysis, 2025
- By Chelating or Complexing Agent
- By Nutrient
- By Crop Type
- By Application Method
- By Sales Channel
- Germany
- Pricing Analysis
- Market Share Analysis, 2025
- By Chelating or Complexing Agent
- By Nutrient
- By Crop Type
- By Application Method
- By Sales Channel
- United Kingdom
- Pricing Analysis
- Market Share Analysis, 2025
- By Chelating or Complexing Agent
- By Nutrient
- By Crop Type
- By Application Method
- By Sales Channel
- Italy
- Pricing Analysis
- Market Share Analysis, 2025
- By Chelating or Complexing Agent
- By Nutrient
- By Crop Type
- By Application Method
- By Sales Channel
- Spain
- Pricing Analysis
- Market Share Analysis, 2025
- By Chelating or Complexing Agent
- By Nutrient
- By Crop Type
- By Application Method
- By Sales Channel
- France
- Pricing Analysis
- Market Share Analysis, 2025
- By Chelating or Complexing Agent
- By Nutrient
- By Crop Type
- By Application Method
- By Sales Channel
- India
- Pricing Analysis
- Market Share Analysis, 2025
- By Chelating or Complexing Agent
- By Nutrient
- By Crop Type
- By Application Method
- By Sales Channel
- ASEAN
- Pricing Analysis
- Market Share Analysis, 2025
- By Chelating or Complexing Agent
- By Nutrient
- By Crop Type
- By Application Method
- By Sales Channel
- Australia and New Zealand
- Pricing Analysis
- Market Share Analysis, 2025
- By Chelating or Complexing Agent
- By Nutrient
- By Crop Type
- By Application Method
- By Sales Channel
- China
- Pricing Analysis
- Market Share Analysis, 2025
- By Chelating or Complexing Agent
- By Nutrient
- By Crop Type
- By Application Method
- By Sales Channel
- Japan
- Pricing Analysis
- Market Share Analysis, 2025
- By Chelating or Complexing Agent
- By Nutrient
- By Crop Type
- By Application Method
- By Sales Channel
- South Korea
- Pricing Analysis
- Market Share Analysis, 2025
- By Chelating or Complexing Agent
- By Nutrient
- By Crop Type
- By Application Method
- By Sales Channel
- Poland
- Pricing Analysis
- Market Share Analysis, 2025
- By Chelating or Complexing Agent
- By Nutrient
- By Crop Type
- By Application Method
- By Sales Channel
- Hungary
- Pricing Analysis
- Market Share Analysis, 2025
- By Chelating or Complexing Agent
- By Nutrient
- By Crop Type
- By Application Method
- By Sales Channel
- Türkiye
- Pricing Analysis
- Market Share Analysis, 2025
- By Chelating or Complexing Agent
- By Nutrient
- By Crop Type
- By Application Method
- By Sales Channel
- South Africa
- Pricing Analysis
- Market Share Analysis, 2025
- By Chelating or Complexing Agent
- By Nutrient
- By Crop Type
- By Application Method
- By Sales Channel
- United States
- Market Structure Analysis
- Competition Dashboard
- Competition Benchmarking
- Market Share Analysis of Top Players
- By Regional
- By Chelating or Complexing Agent
- By Nutrient
- By Crop Type
- By Application Method
- By Sales Channel
- Emerging Startups
- Innovation Benchmarking
- Competition Analysis
- Competition Deep Dive
- Brandt
- Overview
- Product Portfolio
- Profitability by Market Segments
- Sales Footprint
- Strategy Overview
- Marketing Strategy
- Product Strategy
- Channel Strategy
- Rovensa Next
- BASF
- Nouryon
- Yara International
- ICL Group
- Haifa Group
- Valagro
- Brandt
- Case Studies
- Success Stories
- Recent Developments
- Competition Deep Dive
- Assumptions & Acronyms Used


