Shale Oil Market Overview

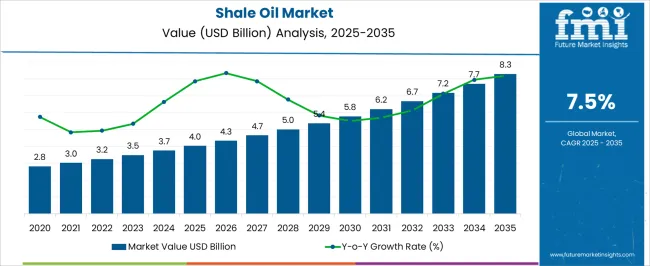
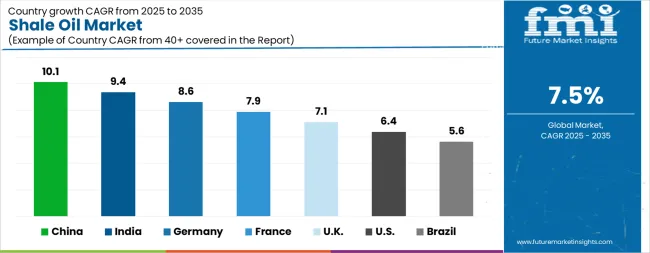
The shale oil market is estimated to secure an aggressive CAGR of 7.5% during the forecast period. The market is estimated to reach a valuation of US$ 3.24 Bn in 2022 and is likely to be valued at US$ 6.68 Bn by 2032.

Attributes Details
Market CAGR (2022 to 2032) 7.5%
Market Value (2022) US$ 3.24 Billion
Market Value (2032) US$ 6.68 Billion

The current market is growing at a moderate pace by registering a healthy CAGR during the foreseen time. The rising consumption of shale oil and growing end-use industries, including the petrochemical sector, are accelerating the demand for shale oil during the forecast period. The growing adoption of shale oil in the petrochemical industry due to producing chemical components and refining the fuel is increasing the shale oil market size.

Moreover, shale oil is a substitute for fuels, including LPG (Liquid Petroleum Gas), diesel, gasoline, and others, which is accelerating the demand for shale oil in recent years. Prominent company manufacturers are increasing the adoption of shale oil to produce several commercial products, such as sulfur and ammonia, during the forecast period.

The growing innovation and rising advanced technology, such as horizontal drilling, is anticipated to make reservoirs for shale oil and is thus increasing the market opportunities. However, the high cost and governments' strict regulation to control the adoption of shale oil as it pollutes the environment is declining the market growth.

In 2019, Reliance Industries invested around INR 700 Billion to set up a crude-to-chemical project in Gujarat. In addition, as an oil-to-chemical strategy, the company integrated petrochemical and petroleum refinery for petrochemical production. The growing investment by large-scale industries is increasing the market size during the forecast period.

North America dominates the global market by securing the maximum share during the forecast period. Rising production of shale oil, growing infrastructure, and the presence of key players are driving the North American shale oil market during the forecast period.

The US dominates the global market by producing 50% of the total market for shale oil during the forecast period. Several developing countries import shale oil from the US due to rising demand for shale oil for several purposes during the forecast period.

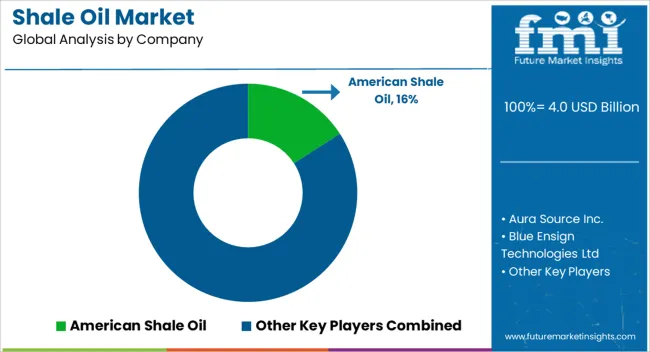
The number of prominent players plays a crucial role by contributing the maximum share by achieving their goals during the forecast period. These key players are focusing on petrochemical plants to fulfill the needs of end-user industries during the forecast period. However, these factors are likely to increase the sales of oil shale during the forecast period.

On the other hand, the market players are indulging in several marketing methodologies to uplift the market during the forecast period.

Oil shale contains organic matter which is converted into synthetic oil by pyrolysis and hydrogenation or thermal dissolution. U.S. have the largest proved shale oil reserve followed by Russia. Despite of high production cost and low market price of oil, shale oil market accounted for more than 50% of total oil market in the U.S. in 2015. U.S. is the largest consumer and a major importer of oil.

Presently, around 35% of total US energy demands are fulfilled by petroleum products. In the U.S. from Jan 2016- July 2016, total imports of crude oil have increased significantly. To fulfill its growing energy demand, the U.S. is majorly dependent on Canada and OPEC. Canada’s energy demand have been constant but production has increased to meet US oil consumption.

In Nov 2014, OPEC reduced its oil prices and increased its production to discourage shale oil manufacturers of world, this resulted production freeze among shale producers. This caused a major setback for world shale oil market. This also drastically increased the number of drilled out uncompleted wells (DUCs).

These reasons forced American oil companies to become innovative and efficient. Now, Oil companies are cutting their production cost, deploying efficient oil rigs and increasing their production. Since July 2016, there has been 20% increase in oil rig counts. Oil producers have also increased their exports to India. These trends are declaring the redemption of U.S. shale oil. Shale oil market is expected to gain momentum from mid-2017.

Reserves: U.S. have significant proved shale oil reserves. Since 2010, there have been a regular increase in proved oil reserves. Presently the largest proved recoverable shale formation is the Monterey play in southern California (USA). The next largest recoverable shale oil plays are in Eagle Ford and Bakken.

Green River Formation in Colorado, Wyoming, and Utah, are among the biggest oil shale deposits in the world. But these deposits are not economically recoverable with current technology. In Canada, Bakken (stretches across southern Saskatchewan to Manitoba) and Cardium formation in Alberta are two shale oil plays.
North America shale oil market: Drivers

Energy requirement for U.S. in increasing and new environmental reforms are limiting the use of coal as an energy source. This has increased energy dependency on petroleum and natural gas. In 2015, there was about 3% rise in energy fulfilled by petroleum based products in USA. Efficient working of shale oil producers and growing world energy demand are major drivers for shale oil market.

Moreover U.S. oil imports are causing cash flow towards Middle East. Government are developing reforms to help shale oil and gas producers within the region. Technological advancements in drilling techniques are increasing the number of recoverable oil reserves.

North America shale oil market: Restraints

OPEC is over supplying the oil market and keeping its price low. OPEC produces oil for about $10 per barrel whereas shale oil costs around $25 a barrel. This has caused many smaller shale oil producers to cut down productions. This has created intense price pressure in the international market.

North America shale oil market:  Key Players

U.S.

Apache Corporation, Chevron Corporation, ConocoPhillips Co, Continental Resources Inc, Hess Corporation, Koch Industries Inc, Linn Energy, LLC, Marathon Oil Corporation, Murphy Oil Corporation, Newfield Exploration Company, Occidental Petroleum Corporation (Oxy), Pioneer Natural Resources Company, Range Resources Corporation, Shell Oil Company, SM Energy Company, Whiting Petroleum Corporation, WPX Energy, Inc., Denbury Resources Inc, EOG Resources, Devon Energy, ExxonMobil, Chesapeake, Energy, EQT

Canada

Husky Energy Inc., Imperial Oil Limited, Pacific Exploration and Production, Suncor Energy, Canadian Natural Resources Limited, Syncrude, Cenovus

The report covers exhaustive analysis on

  • Market segments
  • Market dynamics
  • Market size
  • Supply & demand
  • Current trends/issues/challenges
  • Competition & companies involved
  • Technology
  • Value chain

Regional analysis includes

  • North America (U.S. and Canada)

The report is a compilation of first-hand information, qualitative and quantitative assessment by industry analysts, inputs from industry experts and industry participants across the value chain. The report provides in-depth analysis of parent market trends, macro-economic indicators and governing factors along with market attractiveness as per segments. The report also maps the qualitative impact of various factors on the market segments and geographies.

North America shale oil market: Segmentation

Market segmentation based on oil producing major shale play:

  • U.S. of America
  • Bakken
  • Eagle Ford
  • Marcellus
  • Permian
  • Utica
  • Haynesville
  • Niobrara
  • Canada
  • Bakken
  • Alberta

Market segmentation based on method of extraction used:

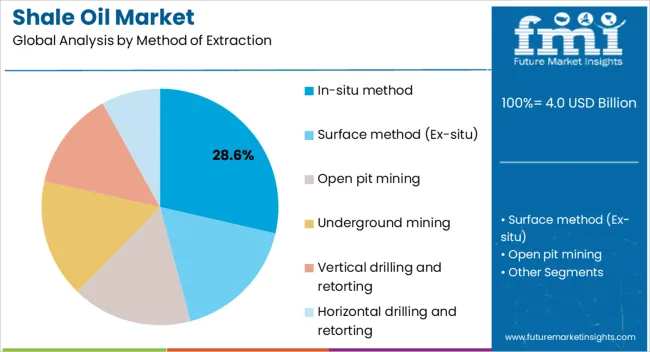
  • Surface method(Ex-situ or conventional method)
  • Open pit mining
  • Underground mining
  • In-situ method
  • Vertical drilling and retorting
  • Horizontal drilling and retorting

Market segmentation on the based on application industries:

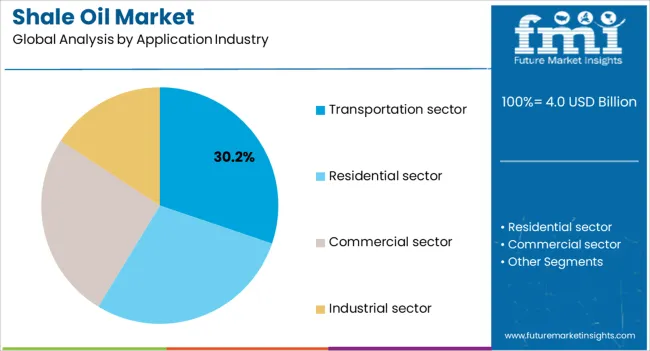
  • Residential sector
  • Commercial sector
  • Industrial sector
  • Transportation sector

Table of Content

  1. Executive Summary - Shale Oil Market
    • Global Market Outlook
    • Demand-side Trends
    • Supply-side Trends
    • Technology Roadmap Analysis
    • Analysis and Recommendations
  2. Market Overview
    • Market Coverage / Taxonomy
    • Market Definition / Scope / Limitations
    • Inclusion and Exclusion
  3. Value Added Insights
    • Opportunity Map Analysis
    • Product Life Cycle Analysis
    • Supply Chain Analysis
      • Supply Side Participants and their Roles
        • Producers
        • Mid-Level Participants (Traders/ Agents/ Brokers)
        • Wholesalers and Distributors
      • Value Added and Value Created at Node in the Supply Chain
      • List of Raw Material Suppliers
      • List of Existing and Potential Buyers
    • Pricing Analysis of Shale Oil Market
      • Pricing Analysis By Region
      • Pricing Analysis By Country
      • Pricing Analysis By End Use
      • Pricing Analysis By Distributor
      • Pricing Analysis By Application
    • Value Chain Analysis
      • Profit Margin Analysis
      • Wholesalers and Distributors
      • Retailers
    • Product Portfolio Analysis
    • Regulatory Landscape
      • By Key Regions
      • By Key Countries
    • Regional Parent Market Outlook
    • Production and Consumption Statistics
    • Import and Export Statistics
    • Investment Feasibility Matrix
    • PESTLE Analysis
      • Political Factors
        • Government stability and change
        • Taxation policy and incentives
        • Trade tariffs and import/export regulations
        • Political risk and corruption levels
      • Economic Factors
        • GDP growth and economic cycles
        • Inflation and interest rates
        • Exchange rate fluctuations
        • Unemployment and consumer spending power
      • Social Factors
        • Demographic trends (age, population growth)
        • Cultural attitudes and lifestyle changes
        • Education levels and workforce skills
        • Health consciousness and social values
      • Technological Factors
        • Rate of technological innovation
        • R&D activity and automation trends
        • Digital infrastructure and connectivity
        • Intellectual property protection
      • Legal Factors
        • Employment and labor laws
        • Health & safety regulations
        • Consumer protection laws
        • Data privacy and antitrust legislation
      • Environmental Factors
        • Environmental regulations and compliance
        • Climate change impacts and carbon footprint
        • Resource availability and sustainability practices
        • Waste management and recycling initiatives
    • Market Background and Dynamics
      • Market Dynamics
        • Drivers
        • Restraints
        • Opportunity
        • Trends
      • SWOT Analysis of Global Shale Oil Market
        • Strengths
        • Weaknesses
        • Opportunities
        • Threats
  4. Global Shale Oil Market Analysis 2020-2024 and Forecast, 2025-2035
    • Historical Market Size Value (USD Mn) & Volume (Units) Analysis, 2020-2024
    • Current and Future Market Size Value (USD Mn) & Volume (Units) Projections, 2025-2035
      • Y-o-Y Growth Trend Analysis
      • Absolute $ Opportunity Analysis
    • Revenue Forecast Scenario, 2020-2035
      • Conservative Scenario
      • Likely Scenario
      • Optimistic Scenario
  5. Global Shale Oil Market Analysis 2020-2024 and Forecast 2025-2035, By Application
    • Introduction / Key Findings
    • Historical Market Size Value (USD Mn) & Volume (Units) Analysis By Application, 2020-2024
    • Current and Future Market Size Value (USD Mn) & Volume (Units) Analysis and Forecast By Application, 2025-2035
    • Y-o-Y Growth Trend Analysis By Application, 2020-2024
    • Absolute $ Opportunity Analysis By Application, 2025-2035
    • Market Attractiveness Analysis By Application, 2025-2035
  6. Global Shale Oil Market Analysis 2020-2024 and Forecast 2025-2035, By End Use
    • Introduction / Key Findings
    • Historical Market Size Value (USD Mn) & Volume (Units) Analysis By End Use, 2020-2024
    • Current and Future Market Size Value (USD Mn) & Volume (Units) Analysis and Forecast By End Use, 2025-2035
    • Y-o-Y Growth Trend Analysis By End Use, 2020-2024
    • Absolute $ Opportunity Analysis By End Use, 2025-2035
    • Market Attractiveness Analysis By End Use, 2025-2035
  7. Global Shale Oil Market Analysis 2020-2024 and Forecast 2025-2035, By Region
    • Introduction
    • Historical Market Size Value (USD Mn) & Volume (Units) Analysis By Region, 2020-2024
    • Current Market Size Value (USD Mn) & Volume (Units) Analysis and Forecast By Region, 2025-2035
      • North America
      • Latin America
      • Western Europe
      • Eastern Europe
      • East Asia
      • South Asia and Pacific & Pacific
      • MEA
    • Market Attractiveness Analysis By Region
  8. North America Shale Oil Market Analysis 2020-2024 and Forecast 2025-2035
    • Introduction
    • Historical Market Size Value (USD Mn) & Volume (Units) Trend Analysis By Market Taxonomy, 2020-2024
    • Current and Future Market Size Value (USD Mn) & Volume (Units) Analysis and Forecast By Market Taxonomy, 2025-2035
    • By Country
      • USA
      • Canada
    • By Application
    • By End Use
    • Market Attractiveness Analysis
      • By Country
      • By Application
      • By End Use
    • Market Trends
    • Key Market Participants - Intensity Mapping
    • Drivers and Restraints - Impact Analysis
    • Country Level Analysis & Forecast
      • USA Shale Oil Market
        • Introduction
        • Market Analysis and Forecast by Market Taxonomy
        • By Application
        • By End Use
      • Canada Shale Oil Market
        • Introduction
        • Market Analysis and Forecast by Market Taxonomy
        • By Application
        • By End Use
      • Mexico Shale Oil Market
        • Introduction
        • Market Analysis and Forecast by Market Taxonomy
        • By Application
        • By End Use
  9. Latin America Shale Oil Market Analysis 2020-2024 and Forecast 2025-2035, By Country
    • Historical Market Size Value (USD Mn) & Volume (Units) Trend Analysis By Market Taxonomy, 2020-2024
    • Market Size Value (USD Mn) & Volume (Units) Forecast By Market Taxonomy, 2025-2035
    • By Country
      • Brazil
      • Argentina
      • Chile
      • Rest of Latin America
    • By Application
    • By End Use
    • Market Attractiveness Analysis
      • By Country
      • By Application
      • By End Use
    • Market Trends
    • Key Market Participants - Intensity Mapping
    • Drivers and Restraints - Impact Analysis
    • Country Level Analysis & Forecast
      • Brazil Shale Oil Market
        • Introduction
        • Market Analysis and Forecast by Market Taxonomy
        • By Application
        • By End Use
      • Argentina Shale Oil Market
        • Introduction
        • Market Analysis and Forecast by Market Taxonomy
        • By Application
        • By End Use
      • Chile Shale Oil Market
        • Introduction
        • Market Analysis and Forecast by Market Taxonomy
        • By Application
        • By End Use
      • Rest of Latin America Shale Oil Market
        • Introduction
        • Market Analysis and Forecast by Market Taxonomy
        • By Application
        • By End Use
  10. Western Europe Shale Oil Market Analysis 2020-2024 and Forecast 2025-2035, By Country
    • Historical Market Size Value (USD Mn) & Volume (Units) Trend Analysis By Market Taxonomy, 2020-2024
    • Market Size Value (USD Mn) & Volume (Units) Forecast By Market Taxonomy, 2025-2035
    • By Country
      • Germany
      • UK
      • Italy
      • Spain
      • France
      • Nordic
      • BENELUX
      • Rest of Western Europe
    • By Application
    • By End Use
    • Market Attractiveness Analysis
      • By Country
      • By Application
      • By End Use
    • Key Takeaways
    • Market Trends
    • Key Market Participants - Intensity Mapping
    • Drivers and Restraints - Impact Analysis
    • Country Level Analysis & Forecast
      • Germany Shale Oil Market
        • Introduction
        • Market Analysis and Forecast by Market Taxonomy
        • By Application
        • By End Use
      • UK Shale Oil Market
        • Introduction
        • Market Analysis and Forecast by Market Taxonomy
        • By Application
        • By End Use
      • Italy Shale Oil Market
        • Introduction
        • Market Analysis and Forecast by Market Taxonomy
        • By Application
        • By End Use
      • Spain Shale Oil Market
        • Introduction
        • Market Analysis and Forecast by Market Taxonomy
        • By Application
        • By End Use
      • France Shale Oil Market
        • Introduction
        • Market Analysis and Forecast by Market Taxonomy
        • By Application
        • By End Use
      • Nordic Shale Oil Market
        • Introduction
        • Market Analysis and Forecast by Market Taxonomy
        • By Application
        • By End Use
      • BENELUX Shale Oil Market
        • Introduction
        • Market Analysis and Forecast by Market Taxonomy
        • By Application
        • By End Use
      • Rest of Western Europe Shale Oil Market
        • Introduction
        • Market Analysis and Forecast by Market Taxonomy
        • By Application
        • By End Use
  11. Eastern Europe Shale Oil Market Analysis 2020-2024 and Forecast 2025-2035, By Country
    • Historical Market Size Value (USD Mn) & Volume (Units) Trend Analysis By Market Taxonomy, 2020-2024
    • Market Size Value (USD Mn) & Volume (Units) Forecast By Market Taxonomy, 2025-2035
    • By Country
      • Russia
      • Poland
      • Hungary
      • Balkan & Baltic
      • Rest of Eastern Europe
    • By Application
    • By End Use
    • Market Attractiveness Analysis
      • By Country
      • By Application
      • By End Use
    • Key Takeaways
    • Market Trends
    • Key Market Participants - Intensity Mapping
    • Drivers and Restraints - Impact Analysis
    • Country Level Analysis & Forecast
      • Russia Shale Oil Market
        • Introduction
        • Market Analysis and Forecast by Market Taxonomy
        • By Application
        • By End Use
      • Poland Shale Oil Market
        • Introduction
        • Market Analysis and Forecast by Market Taxonomy
        • By Application
        • By End Use
      • Hungary Shale Oil Market
        • Introduction
        • Market Analysis and Forecast by Market Taxonomy
        • By Application
        • By End Use
      • Balkan & Baltic Shale Oil Market
        • Introduction
        • Market Analysis and Forecast by Market Taxonomy
        • By Application
        • By End Use
      • Rest of Eastern Europe Shale Oil Market
        • Introduction
        • Market Analysis and Forecast by Market Taxonomy
        • By Application
        • By End Use
  12. East Asia Shale Oil Market Analysis 2020-2024 and Forecast 2025-2035, By Country
    • Historical Market Size Value (USD Mn) & Volume (Units) Trend Analysis By Market Taxonomy, 2020-2024
    • Market Size Value (USD Mn) & Volume (Units) Forecast By Market Taxonomy, 2025-2035
    • By Country
      • China
      • Japan
      • South Korea
    • By Application
    • By End Use
    • Market Attractiveness Analysis
      • By Country
      • By Application
      • By End Use
    • Key Takeaways
    • Market Trends
    • Key Market Participants - Intensity Mapping
    • Drivers and Restraints - Impact Analysis
    • Country Level Analysis & Forecast
      • China Shale Oil Market
        • Introduction
        • Market Analysis and Forecast by Market Taxonomy
        • By Application
        • By End Use
      • Japan Shale Oil Market
        • Introduction
        • Market Analysis and Forecast by Market Taxonomy
        • By Application
        • By End Use
      • South Korea Shale Oil Market
        • Introduction
        • Market Analysis and Forecast by Market Taxonomy
        • By Application
        • By End Use
  13. South Asia and Pacific Shale Oil Market Analysis 2020-2024 and Forecast 2025-2035, By Country
    • Historical Market Size Value (USD Mn) & Volume (Units) Trend Analysis By Market Taxonomy, 2020-2024
    • Market Size Value (USD Mn) & Volume (Units) Forecast By Market Taxonomy, 2025-2035
    • By Country
      • India
      • ASEAN
      • Australia & New Zealand
      • Rest of South Asia and Pacific
    • By Application
    • By End Use
    • Market Attractiveness Analysis
      • By Country
      • By Application
      • By End Use
    • Key Takeaways
    • Market Trends
    • Key Market Participants - Intensity Mapping
    • Drivers and Restraints - Impact Analysis
    • Country Level Analysis & Forecast
      • India Shale Oil Market
        • Introduction
        • Market Analysis and Forecast by Market Taxonomy
        • By Application
        • By End Use
      • ASEAN Shale Oil Market
        • Introduction
        • Market Analysis and Forecast by Market Taxonomy
        • By Application
        • By End Use
      • Australia & New Zealand Shale Oil Market
        • Introduction
        • Market Analysis and Forecast by Market Taxonomy
        • By Application
        • By End Use
      • Rest of South Asia and Pacific Shale Oil Market
        • Introduction
        • Market Analysis and Forecast by Market Taxonomy
        • By Application
        • By End Use
  14. MEA Shale Oil Market Analysis 2020-2024 and Forecast 2025-2035, By Country
    • Historical Market Size Value (USD Mn) & Volume (Units) Trend Analysis By Market Taxonomy, 2020-2024
    • Market Size Value (USD Mn) & Volume (Units) Forecast By Market Taxonomy, 2025-2035
    • By Country
      • Kingdom of Saudi Arabia
      • Other GCC Countries
      • Turkiye
      • South Africa
      • Other African Union
      • Rest of Middle East & Africa
    • By Application
    • By End Use
    • Market Attractiveness Analysis
      • By Country
      • By Application
      • By End Use
    • Key Takeaways
    • Market Trends
    • Key Market Participants - Intensity Mapping
    • Drivers and Restraints - Impact Analysis
    • Country Level Analysis & Forecast
      • Kingdom of Saudi Arabia Shale Oil Market
        • Introduction
        • Market Analysis and Forecast by Market Taxonomy
        • By Application
        • By End Use
      • Other GCC Countries Shale Oil Market
        • Introduction
        • Market Analysis and Forecast by Market Taxonomy
        • By Application
        • By End Use
      • Turkiye Shale Oil Market
        • Introduction
        • Market Analysis and Forecast by Market Taxonomy
        • By Application
        • By End Use
      • South Africa Shale Oil Market
        • Introduction
        • Market Analysis and Forecast by Market Taxonomy
        • By Application
        • By End Use
      • South Africa Shale Oil Market
        • Introduction
        • Market Analysis and Forecast by Market Taxonomy
        • By Application
        • By End Use
      • Rest of MEA Shale Oil Market
        • Introduction
        • Market Analysis and Forecast by Market Taxonomy
        • By Application
        • By End Use
      • Rest of MEA Shale Oil Market
        • Introduction
        • Market Analysis and Forecast by Market Taxonomy
        • By Application
        • By End Use
  15. Market Structure Analysis
    • Competition Dashboard
    • Competition Benchmarking
    • Market Share Analysis of Top Players
      • By Region
      • By Application
      • By End Use
    • Competition Analysis
    • Competition Deep Dive
      • Global Key Players
      • Key Players by Region
      • Key Players by Country
  16. Assumptions & Acronyms Used
  17. Research Methodology

List of Tables

  • Table 1: Global Shale Oil Market Value (US$ Mn) Forecast by Region, 2020-2035
  • Table 2: Global Shale Oil Market Volume (Units) Forecast by Region, 2020-2035
  • Table 3: Global Shale Oil Market Value (US$ Mn) Forecast by Application, 2020-2035
  • Table 4: Global Shale Oil Market Volume (Units) Forecast by Application, 2020-2035
  • Table 5: Global Shale Oil Market Value (US$ Mn) Forecast by End Use, 2020-2035
  • Table 6: Global Shale Oil Market Volume (Units) Forecast by End Use, 2020-2035
  • Table 7: North America Shale Oil Market Value (US$ Mn) Forecast by Country, 2020-2035
  • Table 8: North America Shale Oil Market Volume (Units) Forecast by Country, 2020-2035
  • Table 9: North America Shale Oil Market Value (US$ Mn) Forecast by Application, 2020-2035
  • Table 10: North America Shale Oil Market Volume (Units) Forecast by Application, 2020-2035
  • Table 11: North America Shale Oil Market Value (US$ Mn) Forecast by End Use, 2020-2035
  • Table 12: North America Shale Oil Market Volume (Units) Forecast by End Use, 2020-2035
  • Table 13: Latin America Shale Oil Market Value (US$ Mn) Forecast by Country, 2020-2035
  • Table 14: Latin America Shale Oil Market Volume (Units) Forecast by Country, 2020-2035
  • Table 15: Latin America Shale Oil Market Value (US$ Mn) Forecast by Application, 2020-2035
  • Table 16: Latin America Shale Oil Market Volume (Units) Forecast by Application, 2020-2035
  • Table 17: Latin America Shale Oil Market Value (US$ Mn) Forecast by End Use, 2020-2035
  • Table 18: Latin America Shale Oil Market Volume (Units) Forecast by End Use, 2020-2035
  • Table 19: Europe Shale Oil Market Value (US$ Mn) Forecast by Country, 2020-2035
  • Table 20: Europe Shale Oil Market Volume (Units) Forecast by Country, 2020-2035
  • Table 21: Europe Shale Oil Market Value (US$ Mn) Forecast by Application, 2020-2035
  • Table 22: Europe Shale Oil Market Volume (Units) Forecast by Application, 2020-2035
  • Table 23: Europe Shale Oil Market Value (US$ Mn) Forecast by End Use, 2020-2035
  • Table 24: Europe Shale Oil Market Volume (Units) Forecast by End Use, 2020-2035
  • Table 25: East Asia Shale Oil Market Value (US$ Mn) Forecast by Country, 2020-2035
  • Table 26: East Asia Shale Oil Market Volume (Units) Forecast by Country, 2020-2035
  • Table 27: East Asia Shale Oil Market Value (US$ Mn) Forecast by Application, 2020-2035
  • Table 28: East Asia Shale Oil Market Volume (Units) Forecast by Application, 2020-2035
  • Table 29: East Asia Shale Oil Market Value (US$ Mn) Forecast by End Use, 2020-2035
  • Table 30: East Asia Shale Oil Market Volume (Units) Forecast by End Use, 2020-2035
  • Table 31: South Asia Shale Oil Market Value (US$ Mn) Forecast by Country, 2020-2035
  • Table 32: South Asia Shale Oil Market Volume (Units) Forecast by Country, 2020-2035
  • Table 33: South Asia Shale Oil Market Value (US$ Mn) Forecast by Application, 2020-2035
  • Table 34: South Asia Shale Oil Market Volume (Units) Forecast by Application, 2020-2035
  • Table 35: South Asia Shale Oil Market Value (US$ Mn) Forecast by End Use, 2020-2035
  • Table 36: South Asia Shale Oil Market Volume (Units) Forecast by End Use, 2020-2035
  • Table 37: Oceania Shale Oil Market Value (US$ Mn) Forecast by Country, 2020-2035
  • Table 38: Oceania Shale Oil Market Volume (Units) Forecast by Country, 2020-2035
  • Table 39: Oceania Shale Oil Market Value (US$ Mn) Forecast by Application, 2020-2035
  • Table 40: Oceania Shale Oil Market Volume (Units) Forecast by Application, 2020-2035
  • Table 41: Oceania Shale Oil Market Value (US$ Mn) Forecast by End Use, 2020-2035
  • Table 42: Oceania Shale Oil Market Volume (Units) Forecast by End Use, 2020-2035
  • Table 43: MEA Shale Oil Market Value (US$ Mn) Forecast by Country, 2020-2035
  • Table 44: MEA Shale Oil Market Volume (Units) Forecast by Country, 2020-2035
  • Table 45: MEA Shale Oil Market Value (US$ Mn) Forecast by Application, 2020-2035
  • Table 46: MEA Shale Oil Market Volume (Units) Forecast by Application, 2020-2035
  • Table 47: MEA Shale Oil Market Value (US$ Mn) Forecast by End Use, 2020-2035
  • Table 48: MEA Shale Oil Market Volume (Units) Forecast by End Use, 2020-2035

List of Figures

  • Figure 1: Global Shale Oil Market Value (US$ Mn) by Application, 2020-2035
  • Figure 2: Global Shale Oil Market Value (US$ Mn) by End Use, 2020-2035
  • Figure 3: Global Shale Oil Market Value (US$ Mn) by Region, 2020-2035
  • Figure 4: Global Shale Oil Market Value (US$ Mn) Analysis by Region, 2020-2035
  • Figure 5: Global Shale Oil Market Volume (Units) Analysis by Region, 2020-2035
  • Figure 6: Global Shale Oil Market Value Share (%) and BPS Analysis by Region, 2020-2035
  • Figure 7: Global Shale Oil Market Y-o-Y Growth (%) Projections by Region, 2020-2035
  • Figure 8: Global Shale Oil Market Value (US$ Mn) Analysis by Application, 2020-2035
  • Figure 9: Global Shale Oil Market Volume (Units) Analysis by Application, 2020-2035
  • Figure 10: Global Shale Oil Market Value Share (%) and BPS Analysis by Application, 2020-2035
  • Figure 11: Global Shale Oil Market Y-o-Y Growth (%) Projections by Application, 2020-2035
  • Figure 12: Global Shale Oil Market Value (US$ Mn) Analysis by End Use, 2020-2035
  • Figure 13: Global Shale Oil Market Volume (Units) Analysis by End Use, 2020-2035
  • Figure 14: Global Shale Oil Market Value Share (%) and BPS Analysis by End Use, 2020-2035
  • Figure 15: Global Shale Oil Market Y-o-Y Growth (%) Projections by End Use, 2020-2035
  • Figure 16: Global Shale Oil Market Attractiveness by Application, 2020-2035
  • Figure 17: Global Shale Oil Market Attractiveness by End Use, 2020-2035
  • Figure 18: Global Shale Oil Market Attractiveness by Region, 2020-2035
  • Figure 19: North America Shale Oil Market Value (US$ Mn) by Application, 2020-2035
  • Figure 20: North America Shale Oil Market Value (US$ Mn) by End Use, 2020-2035
  • Figure 21: North America Shale Oil Market Value (US$ Mn) by Country, 2020-2035
  • Figure 22: North America Shale Oil Market Value (US$ Mn) Analysis by Country, 2020-2035
  • Figure 23: North America Shale Oil Market Volume (Units) Analysis by Country, 2020-2035
  • Figure 24: North America Shale Oil Market Value Share (%) and BPS Analysis by Country, 2020-2035
  • Figure 25: North America Shale Oil Market Y-o-Y Growth (%) Projections by Country, 2020-2035
  • Figure 26: North America Shale Oil Market Value (US$ Mn) Analysis by Application, 2020-2035
  • Figure 27: North America Shale Oil Market Volume (Units) Analysis by Application, 2020-2035
  • Figure 28: North America Shale Oil Market Value Share (%) and BPS Analysis by Application, 2020-2035
  • Figure 29: North America Shale Oil Market Y-o-Y Growth (%) Projections by Application, 2020-2035
  • Figure 30: North America Shale Oil Market Value (US$ Mn) Analysis by End Use, 2020-2035
  • Figure 31: North America Shale Oil Market Volume (Units) Analysis by End Use, 2020-2035
  • Figure 32: North America Shale Oil Market Value Share (%) and BPS Analysis by End Use, 2020-2035
  • Figure 33: North America Shale Oil Market Y-o-Y Growth (%) Projections by End Use, 2020-2035
  • Figure 34: North America Shale Oil Market Attractiveness by Application, 2020-2035
  • Figure 35: North America Shale Oil Market Attractiveness by End Use, 2020-2035
  • Figure 36: North America Shale Oil Market Attractiveness by Country, 2020-2035
  • Figure 37: Latin America Shale Oil Market Value (US$ Mn) by Application, 2020-2035
  • Figure 38: Latin America Shale Oil Market Value (US$ Mn) by End Use, 2020-2035
  • Figure 39: Latin America Shale Oil Market Value (US$ Mn) by Country, 2020-2035
  • Figure 40: Latin America Shale Oil Market Value (US$ Mn) Analysis by Country, 2020-2035
  • Figure 41: Latin America Shale Oil Market Volume (Units) Analysis by Country, 2020-2035
  • Figure 42: Latin America Shale Oil Market Value Share (%) and BPS Analysis by Country, 2020-2035
  • Figure 43: Latin America Shale Oil Market Y-o-Y Growth (%) Projections by Country, 2020-2035
  • Figure 44: Latin America Shale Oil Market Value (US$ Mn) Analysis by Application, 2020-2035
  • Figure 45: Latin America Shale Oil Market Volume (Units) Analysis by Application, 2020-2035
  • Figure 46: Latin America Shale Oil Market Value Share (%) and BPS Analysis by Application, 2020-2035
  • Figure 47: Latin America Shale Oil Market Y-o-Y Growth (%) Projections by Application, 2020-2035
  • Figure 48: Latin America Shale Oil Market Value (US$ Mn) Analysis by End Use, 2020-2035
  • Figure 49: Latin America Shale Oil Market Volume (Units) Analysis by End Use, 2020-2035
  • Figure 50: Latin America Shale Oil Market Value Share (%) and BPS Analysis by End Use, 2020-2035
  • Figure 51: Latin America Shale Oil Market Y-o-Y Growth (%) Projections by End Use, 2020-2035
  • Figure 52: Latin America Shale Oil Market Attractiveness by Application, 2020-2035
  • Figure 53: Latin America Shale Oil Market Attractiveness by End Use, 2020-2035
  • Figure 54: Latin America Shale Oil Market Attractiveness by Country, 2020-2035
  • Figure 55: Europe Shale Oil Market Value (US$ Mn) by Application, 2020-2035
  • Figure 56: Europe Shale Oil Market Value (US$ Mn) by End Use, 2020-2035
  • Figure 57: Europe Shale Oil Market Value (US$ Mn) by Country, 2020-2035
  • Figure 58: Europe Shale Oil Market Value (US$ Mn) Analysis by Country, 2020-2035
  • Figure 59: Europe Shale Oil Market Volume (Units) Analysis by Country, 2020-2035
  • Figure 60: Europe Shale Oil Market Value Share (%) and BPS Analysis by Country, 2020-2035
  • Figure 61: Europe Shale Oil Market Y-o-Y Growth (%) Projections by Country, 2020-2035
  • Figure 62: Europe Shale Oil Market Value (US$ Mn) Analysis by Application, 2020-2035
  • Figure 63: Europe Shale Oil Market Volume (Units) Analysis by Application, 2020-2035
  • Figure 64: Europe Shale Oil Market Value Share (%) and BPS Analysis by Application, 2020-2035
  • Figure 65: Europe Shale Oil Market Y-o-Y Growth (%) Projections by Application, 2020-2035
  • Figure 66: Europe Shale Oil Market Value (US$ Mn) Analysis by End Use, 2020-2035
  • Figure 67: Europe Shale Oil Market Volume (Units) Analysis by End Use, 2020-2035
  • Figure 68: Europe Shale Oil Market Value Share (%) and BPS Analysis by End Use, 2020-2035
  • Figure 69: Europe Shale Oil Market Y-o-Y Growth (%) Projections by End Use, 2020-2035
  • Figure 70: Europe Shale Oil Market Attractiveness by Application, 2020-2035
  • Figure 71: Europe Shale Oil Market Attractiveness by End Use, 2020-2035
  • Figure 72: Europe Shale Oil Market Attractiveness by Country, 2020-2035
  • Figure 73: East Asia Shale Oil Market Value (US$ Mn) by Application, 2020-2035
  • Figure 74: East Asia Shale Oil Market Value (US$ Mn) by End Use, 2020-2035
  • Figure 75: East Asia Shale Oil Market Value (US$ Mn) by Country, 2020-2035
  • Figure 76: East Asia Shale Oil Market Value (US$ Mn) Analysis by Country, 2020-2035
  • Figure 77: East Asia Shale Oil Market Volume (Units) Analysis by Country, 2020-2035
  • Figure 78: East Asia Shale Oil Market Value Share (%) and BPS Analysis by Country, 2020-2035
  • Figure 79: East Asia Shale Oil Market Y-o-Y Growth (%) Projections by Country, 2020-2035
  • Figure 80: East Asia Shale Oil Market Value (US$ Mn) Analysis by Application, 2020-2035
  • Figure 81: East Asia Shale Oil Market Volume (Units) Analysis by Application, 2020-2035
  • Figure 82: East Asia Shale Oil Market Value Share (%) and BPS Analysis by Application, 2020-2035
  • Figure 83: East Asia Shale Oil Market Y-o-Y Growth (%) Projections by Application, 2020-2035
  • Figure 84: East Asia Shale Oil Market Value (US$ Mn) Analysis by End Use, 2020-2035
  • Figure 85: East Asia Shale Oil Market Volume (Units) Analysis by End Use, 2020-2035
  • Figure 86: East Asia Shale Oil Market Value Share (%) and BPS Analysis by End Use, 2020-2035
  • Figure 87: East Asia Shale Oil Market Y-o-Y Growth (%) Projections by End Use, 2020-2035
  • Figure 88: East Asia Shale Oil Market Attractiveness by Application, 2020-2035
  • Figure 89: East Asia Shale Oil Market Attractiveness by End Use, 2020-2035
  • Figure 90: East Asia Shale Oil Market Attractiveness by Country, 2020-2035
  • Figure 91: South Asia Shale Oil Market Value (US$ Mn) by Application, 2020-2035
  • Figure 92: South Asia Shale Oil Market Value (US$ Mn) by End Use, 2020-2035
  • Figure 93: South Asia Shale Oil Market Value (US$ Mn) by Country, 2020-2035
  • Figure 94: South Asia Shale Oil Market Value (US$ Mn) Analysis by Country, 2020-2035
  • Figure 95: South Asia Shale Oil Market Volume (Units) Analysis by Country, 2020-2035
  • Figure 96: South Asia Shale Oil Market Value Share (%) and BPS Analysis by Country, 2020-2035
  • Figure 97: South Asia Shale Oil Market Y-o-Y Growth (%) Projections by Country, 2020-2035
  • Figure 98: South Asia Shale Oil Market Value (US$ Mn) Analysis by Application, 2020-2035
  • Figure 99: South Asia Shale Oil Market Volume (Units) Analysis by Application, 2020-2035
  • Figure 100: South Asia Shale Oil Market Value Share (%) and BPS Analysis by Application, 2020-2035
  • Figure 101: South Asia Shale Oil Market Y-o-Y Growth (%) Projections by Application, 2020-2035
  • Figure 102: South Asia Shale Oil Market Value (US$ Mn) Analysis by End Use, 2020-2035
  • Figure 103: South Asia Shale Oil Market Volume (Units) Analysis by End Use, 2020-2035
  • Figure 104: South Asia Shale Oil Market Value Share (%) and BPS Analysis by End Use, 2020-2035
  • Figure 105: South Asia Shale Oil Market Y-o-Y Growth (%) Projections by End Use, 2020-2035
  • Figure 106: South Asia Shale Oil Market Attractiveness by Application, 2020-2035
  • Figure 107: South Asia Shale Oil Market Attractiveness by End Use, 2020-2035
  • Figure 108: South Asia Shale Oil Market Attractiveness by Country, 2020-2035
  • Figure 109: Oceania Shale Oil Market Value (US$ Mn) by Application, 2020-2035
  • Figure 110: Oceania Shale Oil Market Value (US$ Mn) by End Use, 2020-2035
  • Figure 111: Oceania Shale Oil Market Value (US$ Mn) by Country, 2020-2035
  • Figure 112: Oceania Shale Oil Market Value (US$ Mn) Analysis by Country, 2020-2035
  • Figure 113: Oceania Shale Oil Market Volume (Units) Analysis by Country, 2020-2035
  • Figure 114: Oceania Shale Oil Market Value Share (%) and BPS Analysis by Country, 2020-2035
  • Figure 115: Oceania Shale Oil Market Y-o-Y Growth (%) Projections by Country, 2020-2035
  • Figure 116: Oceania Shale Oil Market Value (US$ Mn) Analysis by Application, 2020-2035
  • Figure 117: Oceania Shale Oil Market Volume (Units) Analysis by Application, 2020-2035
  • Figure 118: Oceania Shale Oil Market Value Share (%) and BPS Analysis by Application, 2020-2035
  • Figure 119: Oceania Shale Oil Market Y-o-Y Growth (%) Projections by Application, 2020-2035
  • Figure 120: Oceania Shale Oil Market Value (US$ Mn) Analysis by End Use, 2020-2035
  • Figure 121: Oceania Shale Oil Market Volume (Units) Analysis by End Use, 2020-2035
  • Figure 122: Oceania Shale Oil Market Value Share (%) and BPS Analysis by End Use, 2020-2035
  • Figure 123: Oceania Shale Oil Market Y-o-Y Growth (%) Projections by End Use, 2020-2035
  • Figure 124: Oceania Shale Oil Market Attractiveness by Application, 2020-2035
  • Figure 125: Oceania Shale Oil Market Attractiveness by End Use, 2020-2035
  • Figure 126: Oceania Shale Oil Market Attractiveness by Country, 2020-2035
  • Figure 127: MEA Shale Oil Market Value (US$ Mn) by Application, 2020-2035
  • Figure 128: MEA Shale Oil Market Value (US$ Mn) by End Use, 2020-2035
  • Figure 129: MEA Shale Oil Market Value (US$ Mn) by Country, 2020-2035
  • Figure 130: MEA Shale Oil Market Value (US$ Mn) Analysis by Country, 2020-2035
  • Figure 131: MEA Shale Oil Market Volume (Units) Analysis by Country, 2020-2035
  • Figure 132: MEA Shale Oil Market Value Share (%) and BPS Analysis by Country, 2020-2035
  • Figure 133: MEA Shale Oil Market Y-o-Y Growth (%) Projections by Country, 2020-2035
  • Figure 134: MEA Shale Oil Market Value (US$ Mn) Analysis by Application, 2020-2035
  • Figure 135: MEA Shale Oil Market Volume (Units) Analysis by Application, 2020-2035
  • Figure 136: MEA Shale Oil Market Value Share (%) and BPS Analysis by Application, 2020-2035
  • Figure 137: MEA Shale Oil Market Y-o-Y Growth (%) Projections by Application, 2020-2035
  • Figure 138: MEA Shale Oil Market Value (US$ Mn) Analysis by End Use, 2020-2035
  • Figure 139: MEA Shale Oil Market Volume (Units) Analysis by End Use, 2020-2035
  • Figure 140: MEA Shale Oil Market Value Share (%) and BPS Analysis by End Use, 2020-2035
  • Figure 141: MEA Shale Oil Market Y-o-Y Growth (%) Projections by End Use, 2020-2035
  • Figure 142: MEA Shale Oil Market Attractiveness by Application, 2020-2035
  • Figure 143: MEA Shale Oil Market Attractiveness by End Use, 2020-2035
  • Figure 144: MEA Shale Oil Market Attractiveness by Country, 2020-2035

Frequently Asked Questions

What is the Growth Outlook for Shale Oil Market?

The market is likely to register a CAGR of 7.5% through 2032.

What is the Current Valuation of the Shale Oil Market?

The market is currently valued at US$ 3.24 Bn in 2022.

How is the Future of the Shale Oil Market?

The market is likely to grow to a valuation of US$ 6.68 Bn by 2032.

Which is the Leading Region in the Market?

North America is likely to be a leading market during the forecast period.

Explore Similar Insights

Future Market Insights

Shale Oil Market