The global oxalic acid market is valued at USD 514.5 million in 2025 and is forecasted to reach USD 830.1 million by 2035, recording an absolute increase of USD 315.6 million over the forecast period. This translates into a total growth of 61.3%, with the market forecast to expand at a CAGR of 4.9% between 2025 and 2035. The overall market size is expected to grow by nearly 1.61X during the same period, supported by increasing demand for high-purity pharmaceutical intermediates, growing adoption in rare-earth metal extraction and processing, and rising requirements for specialty cleaning and bleaching applications across electronics manufacturing, textile processing, and industrial maintenance sectors.
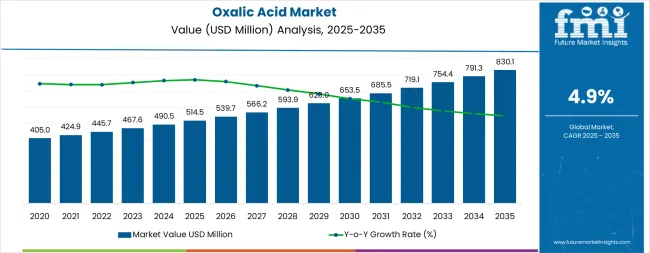
Between 2025 and 2030, the market is projected to expand from USD 514.5 million to USD 652.8 million, resulting in a value increase of USD 138.3 million, which represents 43.8% of the total forecast growth for the decade. This phase of development will be shaped by increasing pharmaceutical industry expansion, rising rare-earth metal processing requirements for permanent magnet and battery material production, and growing demand for ultra-pure oxalic acid grades in semiconductor and electronics manufacturing. Chemical manufacturers are expanding their purification and crystallization capabilities to address the growing demand for pharmaceutical-grade and electronics-grade oxalic acid with enhanced purity specifications and minimal impurity profiles.
| Metric | Value |
|---|---|
| Estimated Value in (2025E) | USD 514.5 million |
| Forecast Value in (2035F) | USD 830.1 million |
| Forecast CAGR (2025 to 2035) | 4.9% |
From 2030 to 2035, the market is forecast to grow from USD 652.8 million to USD 830.1 million, adding another USD 177.3 million, which constitutes 56.2% of the overall ten-year expansion. This period is expected to be characterized by the expansion of bio-based oxalic acid production technologies with reduced carbon footprint, the integration of closed-loop manufacturing processes for sustainability compliance, and the development of specialty anhydrous and low-moisture oxalic acid formulations for advanced pharmaceutical synthesis and precision electronics cleaning applications. The growing adoption of circular economy principles in chemical manufacturing and the proliferation of green chemistry initiatives will drive demand for oxalic acid products with enhanced environmental profiles, zero-liquid-discharge production methods, and comprehensive quality documentation.
Between 2020 and 2025, the market experienced steady growth, driven by increasing pharmaceutical active pharmaceutical ingredient production and growing recognition of oxalic acid as an essential chemical intermediate for diverse industrial applications including metal processing, textile bleaching, and specialty cleaning formulations. The market developed as pharmaceutical manufacturers recognized the potential for high-purity oxalic acid to serve as a versatile building block and processing agent while industrial users valued its effectiveness as a reducing agent, chelating compound, and bleaching chemical. Technological advancement in purification technologies and quality control systems began focusing the critical importance of achieving pharmaceutical-grade purity standards and maintaining consistent product specifications.
Market expansion is being supported by the increasing global demand for pharmaceutical intermediates and active pharmaceutical ingredients requiring high-purity chemical building blocks that can meet stringent regulatory requirements for pharmaceutical manufacturing while providing consistent quality and reliable supply chain availability. Modern pharmaceutical manufacturers are increasingly focused on implementing chemical intermediates that can support complex synthesis pathways, enable efficient purification processes, and provide documented quality assurance for regulatory compliance. Oxalic acid's proven utility as a versatile pharmaceutical intermediate, metal chelating agent, and process chemical make it an essential compound for contemporary pharmaceutical production and specialty chemical applications.
The growing focus on rare-earth metal production and green resource recovery is driving demand for oxalic acid in precipitation and purification processes that support permanent magnet manufacturing, battery material production, and electronic component fabrication. Chemical processors' preference for reagents that combine technical effectiveness with operational efficiency and environmental acceptability is creating opportunities for innovative oxalic acid applications. The rising influence of electronics miniaturization, precision cleaning requirements, and ecofriendly chemistry initiatives is also contributing to increased adoption of high-purity oxalic acid formulations that can provide superior performance in demanding industrial cleaning, metal finishing, and textile processing applications.
The oxalic acid market is poised for steady growth driven by technical advancement and application diversification. As industries across pharmaceuticals, electronics, rare-earth processing, and specialty chemicals seek reagents that deliver high purity, consistent quality, environmental compliance, and versatile functionality, oxalic acid is gaining prominence not just as a commodity chemical but as a strategic material enabling advanced manufacturing processes and green industrial practices.
Rising pharmaceutical production in emerging markets, accelerating rare-earth metal demand for clean energy technologies, and expanding electronics manufacturing amplify consumption, while producers are advancing innovations in bio-based synthesis routes, ultra-high-purity grades, and green manufacturing processes.
Pathways like pharmaceutical-grade and electronics-grade premium products, rare-earth processing applications, and bio-based ecofriendly production promise strong margin uplift, especially in regulated and quality-focused market segments. Geographic expansion and capacity localization will capture volume growth, particularly in Asia-Pacific pharmaceutical and electronics manufacturing hubs. Regulatory drivers around pharmaceutical quality standards, environmental discharge requirements, REACH compliance, and supply chain sustainability provide structural support.
The market is segmented by grade, application, end use, and region. By grade, the market is divided into technical/pharma grade (99.0-99.5% purity, 99.5-99.9%, anhydrous/low-water specialty), industrial grade, food grade, and laboratory/analytical grade. By application, it covers bleaching & purifying agents (rare-earth precipitation, wood pulp & textiles bleaching, electronics precision cleaning, sugar/food process line descaling), reducing agents, metal finishing & rust removal, cleaning & descaling agents, and others. Based on end use, the market is categorized into pharmaceuticals (API/intermediate synthesis, excipients/salts, cleaning & validation utilities), rare-earth & metal processing, textile & leather, electronics & semiconductor, chemical synthesis, and others. Regionally, the market is divided into North America, Europe, East Asia, South Asia & Pacific, Latin America, and the Middle East & Africa.
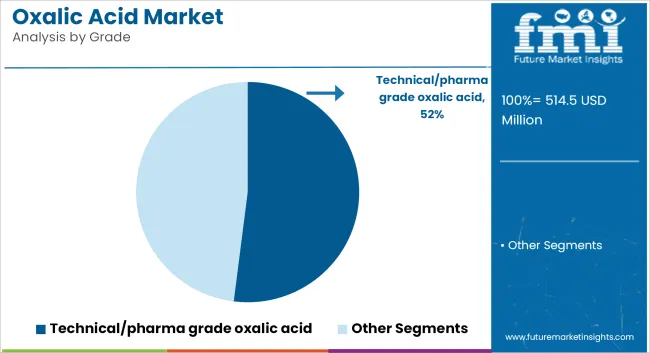
The technical/pharma grade segment is projected to account for 52.0% of the market in 2025, reaffirming its position as the leading grade category. Pharmaceutical manufacturers and specialty chemical processors increasingly utilize technical and pharmaceutical-grade oxalic acid for their superior purity levels, stringent quality control, comprehensive documentation, and consistent batch-to-batch performance across active pharmaceutical ingredient synthesis, excipient formulation, and precision chemical processing applications. Technical/pharma grade oxalic acid's advanced purification capabilities and regulatory compliance directly address the pharmaceutical industry requirements for validated chemical intermediates and specialty chemical sector needs for high-performance processing agents.
Within the technical/pharma grade segment, 99.0-99.5% purity products command 54.0% of the grade market, offering cost-effective solutions for general pharmaceutical intermediate synthesis and industrial specialty applications. The 99.5-99.9% purity range represents 33.0% of the segment, providing enhanced quality for critical pharmaceutical synthesis steps and electronics industry cleaning applications requiring minimal impurity content. Anhydrous and low-water specialty forms account for 13.0% of the grade market, serving specialized pharmaceutical synthesis and electronics manufacturing processes where moisture content must be strictly controlled.
This grade segment forms the foundation of modern pharmaceutical and specialty chemical operations, as it represents the product category with the greatest technical sophistication and established acceptance across regulated manufacturing environments. Producer investments in advanced purification technologies and comprehensive quality management systems continue to strengthen adoption among pharmaceutical companies. With pharmaceutical regulators prioritizing product quality and supply chain integrity, technical/pharma grade oxalic acid aligns with both regulatory compliance objectives and technical performance requirements, making it the central component of comprehensive pharmaceutical raw material strategies.
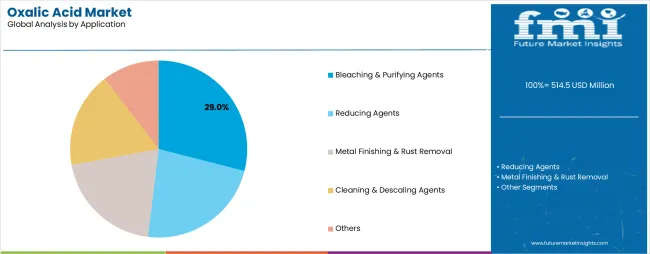
Bleaching and purifying agent applications are projected to represent 29.0% of oxalic acid demand in 2025, highlighting their critical role as the primary application category requiring effective chemical agents for color removal, impurity reduction, and material purification across diverse industrial processes. Industrial processors prefer oxalic acid for bleaching and purifying applications due to its effective reducing properties, selective bleaching action, environmentally preferable profile compared to chlorine-based alternatives, and versatility across multiple material types and processing conditions.
Within the bleaching and purifying segment, rare-earth precipitation represents 34.0% of application demand, serving the growing permanent magnet and battery material industries requiring high-purity rare-earth oxides through oxalate precipitation pathways. Wood pulp and textiles bleaching accounts for 28.0% of the application market, providing effective and selective bleaching in pulp processing and textile finishing operations. Electronics precision cleaning commands 22.0% of application demand, enabling removal of metal oxides and contaminants from semiconductor surfaces and electronic components without substrate damage. Sugar and food process line descaling represents 16.0% of the segment, offering effective mineral deposit removal in food processing equipment while meeting food-grade safety requirements.
The segment is supported by continuous innovation in green chemistry practices and the growing demand for chlorine-free bleaching alternatives that reduce environmental impact. Rare-earth metal processors are investing in optimized precipitation processes to maximize recovery efficiency and product purity. As electronics miniaturization continues and green manufacturing practices expand, bleaching and purifying applications will continue to lead the application market while supporting advanced material processing and environmentally responsible industrial operations.
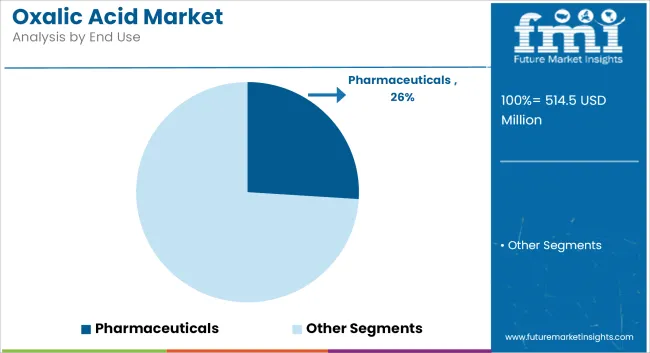
Pharmaceuticals are projected to represent 26.0% of oxalic acid demand in 2025, highlighting their importance as the dominant end-use sector driving high-purity oxalic acid consumption for complex active pharmaceutical ingredient synthesis, pharmaceutical salt formation, and equipment cleaning and validation applications. Pharmaceutical manufacturers prefer high-purity oxalic acid for its well-characterized chemistry, extensive regulatory acceptance, reliable supply availability, and versatility as both a chemical intermediate and processing agent in pharmaceutical manufacturing operations.
Within the pharmaceutical segment, API and intermediate synthesis commands 58.0% of end-use demand, serving as a critical building block and reagent in multi-step pharmaceutical synthesis pathways for various therapeutic categories. Excipients and pharmaceutical salts represent 21.0% of pharmaceutical demand, where oxalic acid serves in formation of bioavailable drug salts and functional excipient materials. Cleaning and validation utilities account for 21.0% of the segment, providing effective cleaning agents for pharmaceutical manufacturing equipment while meeting stringent pharmaceutical cleaning validation requirements.
The segment is supported by expanding pharmaceutical production capacity in emerging markets and the growing complexity of pharmaceutical synthesis requiring specialized chemical intermediates. Pharmaceutical companies are investing in comprehensive supplier qualification programs to ensure raw material quality and supply chain security. As pharmaceutical regulations become more stringent and biosimilar production expands, pharmaceuticals will continue to dominate the end-user market while supporting advanced drug substance manufacturing and quality assurance protocols.
The market is advancing steadily due to increasing pharmaceutical production and growing adoption of high-purity chemical intermediates that provide versatile functionality, regulatory acceptance, and consistent quality across diverse pharmaceutical synthesis and specialty chemical applications. The market faces challenges, including raw material price volatility affecting production economics, competition from alternative reducing agents and bleaching chemicals in some applications, and the need for continuous investment in purification technology upgrades and quality management systems. Innovation in bio-based production routes and ultra-high-purity crystallization technologies continues to influence product development and market positioning strategies.
The growing demand for ultra-high-purity oxalic acid meeting stringent pharmaceutical pharmacopeia standards and electronics industry specifications is enabling specialized producers to invest in advanced crystallization, purification, and quality control systems that deliver consistently superior product quality with comprehensive analytical documentation and regulatory support. Pharmaceutical-grade production facilities provide enhanced margin opportunities while allowing manufacturers to serve the most demanding and quality-sensitive market segments where technical expertise and regulatory compliance capabilities create significant competitive advantages. Manufacturers are increasingly recognizing the strategic value of pharmaceutical and electronics grade capabilities for premium market positioning and customer relationship development with major pharmaceutical companies and electronics manufacturers.
Modern oxalic acid producers are incorporating bio-based synthesis routes using agricultural residues, waste biomass, or renewable feedstocks to reduce production carbon footprint, improve environmental profile, and meet customer sustainability requirements in pharmaceutical and food-grade applications. Bio-based production technologies enable differentiation through verified environmental credentials while potentially offering improved production economics through utilization of lower-cost renewable feedstocks. Advanced bio-based integration also allows producers to support customer corporate ecofriendly goals and regulatory preferences for environmentally responsible chemical sourcing in regulated industries.
Chemical processors are developing application-optimized oxalic acid formulations with controlled particle size distribution, precise hydration states, and tailored impurity profiles specifically designed for rare-earth metal precipitation, semiconductor precision cleaning, and specialized electronics manufacturing processes. Specialty formulations enable premium pricing and stronger customer relationships through technical collaboration and application development support that addresses specific process requirements and performance optimization objectives. The focus on application-specific product development is creating differentiation opportunities for technically sophisticated producers while supporting customer process improvement and quality enhancement initiatives in high-value manufacturing operations.
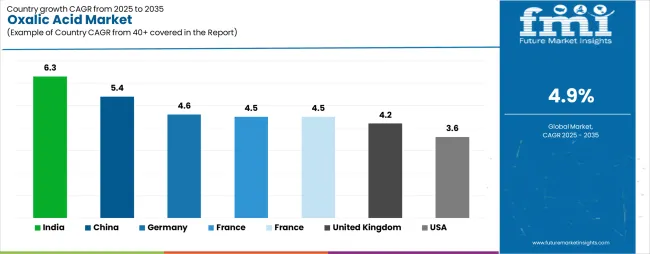
| Country | CAGR (2025-2035) |
|---|---|
| India | 6.3% |
| China | 5.4% |
| Germany | 4.6% |
| France | 4.5% |
| Japan | 4.5% |
| United Kingdom | 4.2% |
| USA | 3.6% |
The market is experiencing steady growth globally, with India leading at a 6.3% CAGR through 2035, driven by expanding pharmaceutical manufacturing infrastructure, growing rare-earth processing capabilities, and significant investment in electronics and textile production capacity development. China follows at 5.4%, supported by large-scale pharmaceutical production, extensive rare-earth metal processing operations, and growing domestic demand for specialty chemicals across electronics and industrial applications. Germany shows growth at 4.6%, focusing pharmaceutical API manufacturing, precision chemical production, and strict quality standards driving premium-grade demand.
France records 4.5%, focusing on pharmaceutical industry strength and specialty chemical manufacturing with focus on high-purity grades. Japan demonstrates 4.5% growth, prioritizing pharmaceutical production excellence and electronics industry requirements for ultra-pure specialty chemicals. The United Kingdom exhibits 4.2% growth, supported by pharmaceutical manufacturing and specialty chemical applications in regulated industries. The USA shows 3.6% growth, driven by pharmaceutical production and specialty chemical demand in mature markets.
The report covers an in-depth analysis of 40+ countries, top-performing countries are highlighted below.
India is projected to exhibit exceptional growth with a CAGR of 6.3% through 2035, driven by expanding pharmaceutical manufacturing capacity under government incentive programs and rapidly growing generic drug production serving both domestic and international markets with increasing requirements for high-purity pharmaceutical intermediates. The country's competitive manufacturing cost structure and substantial investment in pharmaceutical infrastructure are creating significant demand for pharmaceutical-grade oxalic acid solutions. Major pharmaceutical companies and chemical manufacturers are establishing comprehensive quality management systems to serve regulated pharmaceutical markets.
Government support for pharmaceutical sector development through Production Linked Incentive schemes and API manufacturing promotion is driving demand for high-purity chemical intermediates throughout major pharmaceutical manufacturing clusters in Hyderabad, Ahmedabad, Mumbai, and Bangalore regions. Strong pharmaceutical export growth and an expanding network of WHO-GMP certified manufacturing facilities are supporting the rapid uptake of pharmaceutical-grade oxalic acid among producers seeking international market access and regulatory compliance capabilities.
China is expanding at a CAGR of 5.4%, supported by the country's dominant position in rare-earth metal production and processing, comprehensive pharmaceutical manufacturing capabilities, and increasing domestic demand for specialty chemicals across electronics, textile, and industrial applications. The country's integrated chemical supply chain and large-scale production capacity are driving demand for technical-grade and pharmaceutical-grade oxalic acid across diverse end-use sectors. International chemical companies and domestic producers are establishing extensive distribution and technical service capabilities to address the growing demand for quality-assured products.
Rising rare-earth metal production for permanent magnet manufacturing supporting electric vehicle motors and wind turbine generators is creating substantial opportunities for oxalic acid adoption in precipitation and purification processes throughout major rare-earth processing regions. Growing pharmaceutical production capacity and expanding electronics manufacturing activities are driving increased consumption of high-purity oxalic acid grades among manufacturers seeking enhanced product quality and process optimization.
Germany is expanding at a CAGR of 4.6%, supported by the country's advanced pharmaceutical industry, strong focus on chemical quality and regulatory compliance, and robust demand for high-purity specialty chemicals among quality-focused pharmaceutical and chemical manufacturers. The nation's pharmaceutical manufacturing excellence and stringent quality standards are driving sophisticated oxalic acid requirements throughout the supply chain. Leading pharmaceutical companies and specialty chemical producers are investing extensively in supplier qualification programs and quality assurance systems to ensure raw material compliance with pharmaceutical and industrial specifications.
Rising pharmaceutical API production and growing specialty chemical manufacturing are creating demand for pharmaceutical-grade and electronics-grade oxalic acid among producers seeking comprehensive quality documentation and regulatory support. Strong REACH compliance requirements and environmental discharge standards are supporting adoption of green production methods and zero-liquid-discharge manufacturing processes across the German chemical industry.
France is growing at a CAGR of 4.5%, driven by the country's established pharmaceutical manufacturing sector, growing specialty chemical production, and strong focus on product quality and environmental compliance in regulated manufacturing operations. France's pharmaceutical industry strength and comprehensive chemical production capabilities are supporting demand for high-purity oxalic acid across pharmaceutical intermediate synthesis and specialty chemical applications. Pharmaceutical manufacturers and chemical processors are establishing comprehensive quality management and regulatory compliance programs to serve domestic and export markets.
Government support for pharmaceutical manufacturing competitiveness and innovation programs for green chemistry are driving adoption of advanced oxalic acid grades and bio-based production technologies among pharmaceutical companies seeking enhanced environmental profiles and regulatory compliance. Rising pharmaceutical intermediate production and growing specialty chemical applications in electronics and industrial sectors are supporting market expansion throughout major pharmaceutical and chemical manufacturing regions.
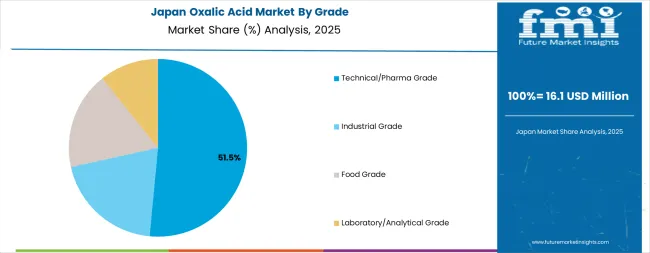
Japan is expanding at a CAGR of 4.5%, supported by the country's focus on pharmaceutical manufacturing excellence, advanced electronics industry requirements, and stringent quality standards for chemical intermediates and specialty chemicals. Japan's pharmaceutical manufacturing sophistication and electronics industry precision requirements are driving demand for ultra-high-purity oxalic acid grades with comprehensive quality documentation and analytical certification. Leading pharmaceutical companies and specialty chemical manufacturers are investing in supplier qualification programs and quality assurance systems to ensure consistent product specifications.
Regional specialization in pharmaceutical API production and electronics precision cleaning applications is creating opportunities for premium-grade oxalic acid products with exceptional purity and documented quality characteristics. Strong focus on manufacturing process validation and quality assurance is driving adoption of rigorously tested and certified oxalic acid supplies throughout pharmaceutical and electronics manufacturing operations.
The United Kingdom is growing at a CAGR of 4.2%, driven by the country's pharmaceutical manufacturing capabilities, specialty chemical production, and regulatory compliance requirements in pharmaceutical and industrial applications. The UK's pharmaceutical industry and chemical manufacturing sector are supporting steady demand for pharmaceutical-grade and technical-grade oxalic acid across diverse applications. Pharmaceutical manufacturers and chemical processors are maintaining comprehensive supplier qualification and quality assurance programs to ensure regulatory compliance and product quality.
Rising pharmaceutical intermediate production and growing specialty chemical applications in electronics cleaning and industrial processing are creating opportunities for high-purity oxalic acid products with complete quality documentation. Strong regulatory oversight and environmental compliance requirements are driving adoption of ecofriendly production methods and quality-assured supply chains throughout the pharmaceutical and specialty chemical sectors.
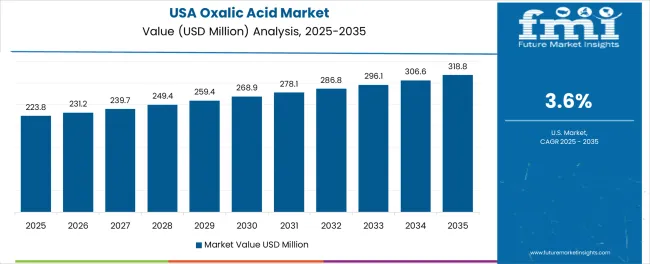
The USA is expanding at a CAGR of 3.6%, supported by the country's established pharmaceutical manufacturing industry, specialty chemical sector, and focus on quality and regulatory compliance in pharmaceutical and industrial applications. The nation's mature pharmaceutical market and sophisticated chemical industry are maintaining steady demand for pharmaceutical-grade and specialty oxalic acid products. Leading pharmaceutical companies and chemical manufacturers are investing in supply chain reliability and quality assurance programs to ensure consistent raw material availability and specifications.
Rising pharmaceutical production requirements and growing specialty chemical applications in electronics and industrial maintenance are supporting stable market growth. Strong FDA oversight and comprehensive pharmaceutical quality standards are driving demand for fully documented and validated oxalic acid supplies with complete regulatory support and quality certification throughout pharmaceutical manufacturing operations.
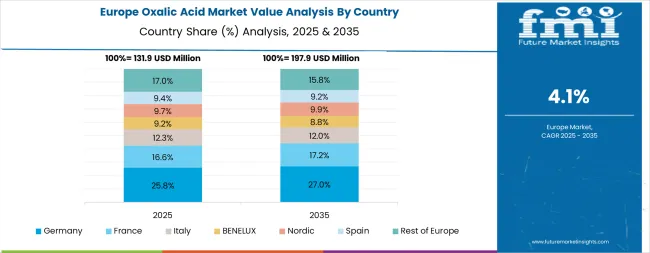
Europe accounts for an estimated 24.0% of global oxalic acid revenues in 2025, representing approximately USD 123.5 million in market value. Within Europe, Germany leads with 16.0% of regional sales, supported by its strong pharmaceutical API manufacturing sector and precision chemical production capabilities. France follows with 13.0% of European demand, driven by pharmaceutical industry strength and specialty chemical applications. The United Kingdom holds 12.0% market share, supported by pharmaceutical manufacturing and regulated chemical applications. Italy commands 10.0% of regional consumption, while Spain accounts for 7.0%, both serving pharmaceutical and textile processing sectors. The Netherlands maintains 6.0% share, focusing on pharmaceutical intermediate trade and specialty chemical distribution.
The Nordic countries collectively hold 6.0% of European demand, focusing pharmaceutical quality and environmental standards. Central and Eastern Europe represents 20.0% of regional market collectively, driven by expanding pharmaceutical production capacity and growing chemical manufacturing activities across Poland, Czech Republic, Hungary, and other markets. The Rest of Western Europe accounts for 10.0% of regional consumption, serving diverse pharmaceutical and industrial applications. From 2025 to 2035, Europe is projected to grow at 4.7% CAGR, supported by pharmaceutical and electronics-grade product demand, REACH-driven purity upgrades, and broader adoption in water treatment and specialty cleaning applications across industrial sectors.
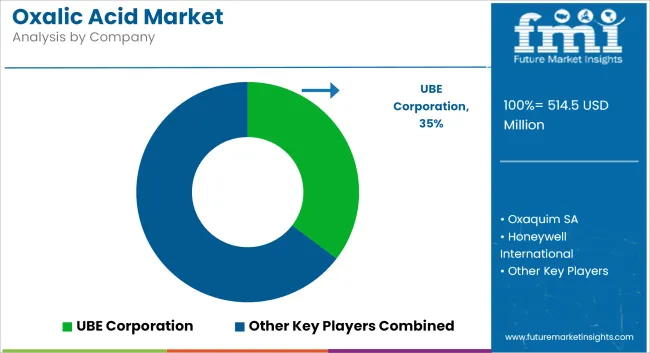
The market is characterized by competition among established specialty chemical manufacturers, pharmaceutical intermediate suppliers, and integrated chemical producers. Companies are investing in purification technology advancement, quality management system enhancement, green production development, and comprehensive product portfolios to deliver consistent, high-purity, and regulatory-compliant oxalic acid solutions. Innovation in bio-based production technologies, ultra-high-purity crystallization processes, and pharmaceutical-grade quality systems is central to strengthening market position and competitive advantage.
Oxaquim S.A. leads the market with a strong 9.0% market share, offering comprehensive oxalic acid solutions including pharmaceutical-grade, technical-grade, and specialty formulations with a focus on quality assurance and regulatory compliance. The company's focus on ecofriendly production technologies and bio-based manufacturing initiatives supports market leadership in environmentally conscious pharmaceutical and specialty chemical applications. Indian Oxalate Limited provides high-volume oxalic acid production with advanced purification capabilities and zero-liquid-discharge manufacturing processes serving pharmaceutical and industrial markets. Shandong Fengyuan Chemical Stock Co. Ltd. delivers large-scale oxalic acid production with recent capacity expansions in pharmaceutical-grade and electronics-grade purification lines. Mudanjiang Fengda Chemical Co. Ltd. focuses on technical-grade and pharmaceutical-grade production serving Asian pharmaceutical and chemical manufacturing sectors. Merck KGaA offers pharmaceutical-grade and laboratory-grade oxalic acid with comprehensive analytical documentation serving research and pharmaceutical applications. UBE Corporation specializes in high-purity oxalic acid production with focus on pharmaceutical intermediate applications and specialty chemical markets.
| Items | Values |
|---|---|
| Quantitative Units (2025) | USD 514.5 million |
| Grade | Technical/Pharma Grade (99.0-99.5% Purity, 99.5-99.9%, Anhydrous/Low-water Specialty), Industrial Grade, Food Grade, Laboratory/Analytical Grade |
| Application | Bleaching & Purifying Agents (Rare-earth Precipitation, Wood Pulp & Textiles Bleaching, Electronics Precision Cleaning, Sugar/Food Process Line Descaling), Reducing Agents, Metal Finishing & Rust Removal, Cleaning & Descaling Agents, Others |
| End Use | Pharmaceuticals (API/Intermediate Synthesis, Excipients/Salts, Cleaning & Validation Utilities), Rare-earth & Metal Processing, Textile & Leather, Electronics & Semiconductor, Chemical Synthesis, Others |
| Regions Covered | North America, Europe, East Asia, South Asia & Pacific, Latin America, Middle East & Africa |
| Countries Covered | United States, Germany, France, United Kingdom, China, Japan, India, Italy, Spain, and 40+ countries |
| Key Companies Profiled | Oxaquim S.A., Indian Oxalate Limited, Shandong Fengyuan Chemical Stock Co. Ltd., Mudanjiang Fengda Chemical Co. Ltd., Merck KGaA, and UBE Corporation |
| Additional Attributes | Dollar sales by grade, application, and end use category, regional demand trends, competitive landscape, technological advancements in purification systems, bio-based production development, pharmaceutical-grade quality enhancement, and green manufacturing innovation |
The global oxalic acid market is estimated to be valued at USD 514.5 million in 2025.
The market size for the oxalic acid market is projected to reach USD 830.1 million by 2035.
The oxalic acid market is expected to grow at a 4.9% CAGR between 2025 and 2035.
The key product types in oxalic acid market are technical/pharma grade , industrial grade, food grade and laboratory/analytical grade.
In terms of application, bleaching & purifying agents segment to command 29.0% share in the oxalic acid market in 2025.


Full Research Suite comprises of:
Market outlook & trends analysis
Interviews & case studies
Strategic recommendations
Vendor profiles & capabilities analysis
5-year forecasts
8 regions and 60+ country-level data splits
Market segment data splits
12 months of continuous data updates
DELIVERED AS:
PDF EXCEL ONLINE
Demand for Oxalic Acid in EU Size and Share Forecast Outlook 2025 to 2035
Acid Resistant Pipe Market Forecast and Outlook 2025 to 2035
Acid Coil Cleaner Market Size and Share Forecast Outlook 2025 to 2035
Acid Filling and Leveling Machine Market Size and Share Forecast Outlook 2025 to 2035
Acid Chlorides Market Size and Share Forecast Outlook 2025 to 2035
Acid-Sensitive APIs Market Analysis - Size, Share, and Forecast Outlook 2025 to 2035
Acidified Whey Protein Market Analysis - Size, Share & Trends 2025 to 2035
Acid Dyes Market Growth - Trends & Forecast 2025 to 2035
Acidity Regulator Market Growth - Trends & Forecast 2025 to 2035
Acid Proof Lining Market Trends 2025 to 2035
Acid Citrate Dextrose Tube Market Trends – Growth & Industry Outlook 2024-2034
Acid Orange Market
Antacids Market Analysis – Size, Trends & Forecast 2025 to 2035
Lead Acid Battery Market Size and Share Forecast Outlook 2025 to 2035
Lead Acid Battery Recycling Market Size and Share Forecast Outlook 2025 to 2035
Feed Acidifier Market Analysis Size Share and Forecast Outlook 2025 to 2035
Food Acidulants Market Growth - Key Trends, Size & Forecast 2024 to 2034
Boric Acid Market Forecast and Outlook 2025 to 2035
Folic Acid Market Size and Share Forecast Outlook 2025 to 2035
Oleic Acid Market Size and Share Forecast Outlook 2025 to 2035

Thank you!
You will receive an email from our Business Development Manager. Please be sure to check your SPAM/JUNK folder too.
Chat With
MaRIA