The global phenolic tackifying resin market is projected to grow from USD 2 billion in 2025 to approximately USD 2.8 billion by 2035, recording an absolute increase of USD 777.0 million over the forecast period. This translates into a total growth of 38.3%, with the market forecast to expand at a compound annual growth rate (CAGR) of 3.3% between 2025 and 2035. The overall market size is expected to grow by 1.4X during the same period, supported by increasing demand from tire manufacturing operations, expanding rubber processing applications across automotive sectors, and growing adoption of advanced adhesive formulations requiring superior bonding characteristics in industrial manufacturing processes.
The phenolic tackifying resin sector demonstrates stable expansion patterns driven by consistent tire production volumes, particularly in Asia Pacific manufacturing centers where automotive component production maintains steady growth trajectories. Industrial conveyor belt manufacturing and specialized rubber applications provide additional demand channels, with performance requirements in mining operations and material handling systems supporting premium resin adoption. Manufacturing investments in China and India create substantial procurement opportunities, while established European and North American operations maintain quality-focused ingredient specifications.
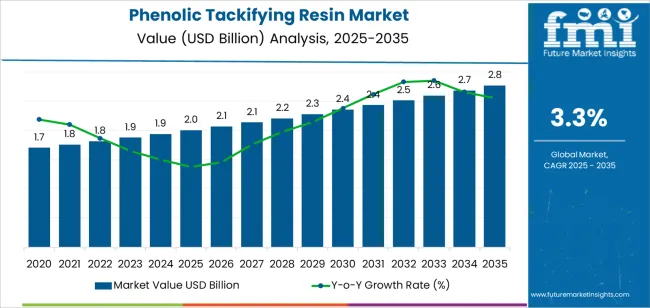
Material performance characteristics position phenolic tackifiers as critical functional additives in rubber compounding operations. These resins deliver adhesion enhancement, processing efficiency improvements, and thermal stability benefits that conventional alternatives cannot match. Technical specifications for particle size distribution, softening point ranges, and compatibility parameters establish market entry requirements that favor established producers with comprehensive quality control systems. Supply chain relationships between resin manufacturers and tire producers create switching costs through formula validation requirements, batch consistency expectations, and technical support dependencies.
| Metric | Value |
|---|---|
| Market Value (2025) | USD 2 billion |
| Market Forecast Value (2035) | USD 2.8 billion |
| Forecast CAGR (2025-2035) | 3.3% |
| TIRE MANUFACTURING EXPANSION | RUBBER PROCESSING REQUIREMENTS | TECHNICAL PERFORMANCE STANDARDS |
|---|---|---|
| Automotive Production Growth | Advanced Adhesion Requirements | Quality Specification Standards |
| Continuous expansion of global tire manufacturing capacity across emerging markets driving sustained demand for performance tackifying resins. | Modern rubber processing operations require specialized additives delivering precise adhesion control and enhanced processing efficiency. | Regulatory requirements establishing performance benchmarks favoring high-quality synthetic resin additives. |
| Vehicle Fleet Expansion | Industrial Application Demands | Manufacturing Consistency Requirements |
| Growing vehicle populations in developing economies creating sustained tire replacement demand supporting resin consumption growth. | Conveyor belt manufacturers and industrial rubber processors investing in premium additives offering consistent performance while maintaining processing efficiency. | Quality standards requiring superior thermal stability and resistance to aging stresses in demanding applications. |
| Premium Tire Segment Growth | Processing Efficiency Focus | Environmental Compliance Standards |
| Increasing adoption of high-performance tire specifications requiring advanced tackifier formulations supporting superior bonding characteristics. | Rubber compounders with proven technical capabilities required for advanced industrial applications. | Diverse regulatory requirements and emission standards driving need for sophisticated resin formulations. |
| Category | Segments Covered |
|---|---|
| By Product Form | Emulsions, Dispersions, Others |
| By Application | Tire, Roller, Conveyor Belt, Others |
| By Region | North America, Europe, Asia Pacific, Latin America, Middle East & Africa |
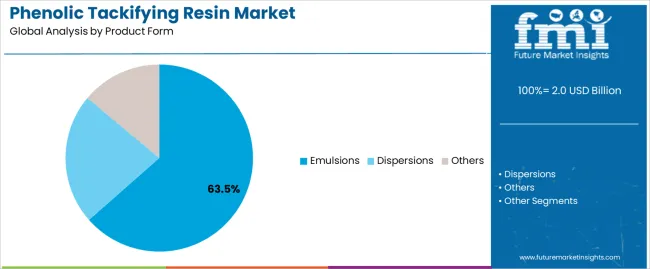
| Segment | 2025 to 2035 Outlook |
|---|---|
| Emulsions |
Leader in 2025 with 63.5% market share, expected to maintain dominance through 2035. Water-based formulations offering processing advantages, environmental benefits, and compatibility with standard rubber compounding equipment. Extensive adoption across tire manufacturing and industrial rubber applications driven by operational efficiency and regulatory compliance advantages. Momentum: steady growth driven by environmental regulations and processing efficiency requirements. Watchouts: price competition from lower-cost alternatives, technical specification complexity. |
| Dispersions |
Specialized segment serving niche applications requiring specific particle size distributions and viscosity characteristics. Limited market share but critical for premium rubber applications demanding precise control over tackifier distribution and bonding performance. Momentum: moderate growth in high-performance applications. Technical requirements and processing complexity limit broader adoption. Watchouts: raw material cost volatility, customer qualification timelines. |
| Others |
Includes solid resin forms and specialized formulations for specific processing requirements. Small volume segment serving custom applications and legacy manufacturing processes. Limited growth potential due to processing disadvantages compared to emulsion systems. Momentum: flat to declining as manufacturers transition to emulsion-based systems. Niche applications in specific rubber compounds maintain residual demand. |
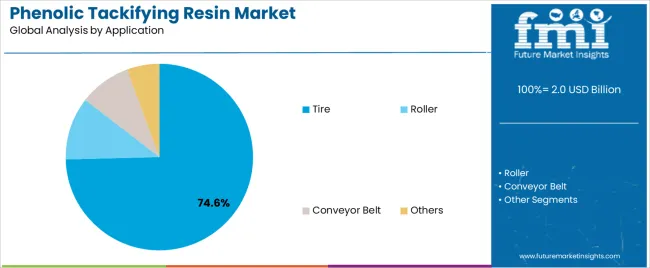
| Segment | 2025 to 2035 Outlook |
|---|---|
| Tire |
Dominant application at 74.6% market share in 2025, representing the primary consumption channel for phenolic tackifiers. Critical for both passenger and commercial tire manufacturing, providing essential adhesion between rubber compounds and reinforcement materials. Established technical specifications, mature supply relationships, and consistent performance requirements. Momentum: steady growth aligned with global tire production expansion, particularly in Asia Pacific manufacturing centers. Watchouts: raw material price fluctuations, automotive production cycle sensitivity. |
| Roller |
Industrial roller manufacturing for material handling and processing equipment. Moderate volume segment requiring specific tackifier formulations for bonding rubber covers to metal cores. Technical specifications emphasize thermal stability and long-term adhesion performance. Momentum: modest growth driven by industrial automation and manufacturing expansion in emerging markets. Application breadth limited by specialized requirements. Watchouts: competition from alternative bonding systems, customer concentration risk. |
| Conveyor Belt |
Mining and material handling conveyor systems requiring durable rubber compounds with superior adhesion characteristics. Premium segment with stringent performance specifications for extreme operating conditions. Smaller volume but higher margin applications. Momentum: selective growth in mining operations and bulk material handling infrastructure. Demand tied to commodity cycles and industrial capital investment. Watchouts: mining sector volatility, long replacement cycles. |
| Others |
Diverse applications including gaskets, seals, and specialized rubber products. Fragmented segment with varied technical requirements and small individual order volumes. Limited standardization across applications. Momentum: stable demand from established industrial applications. Innovation-driven opportunities in specialized rubber products. Low volume base limits growth contribution to overall market. |
| DRIVERS | RESTRAINTS | KEY TRENDS |
|---|---|---|
| Tire Manufacturing Expansion | Raw Material Price Volatility | Emulsion Technology Advancement |
| Continuous expansion of tire production capacity across emerging markets driving sustained tackifier demand for manufacturing operations. | Price fluctuations in phenolic feedstocks affecting production costs and margin predictability for resin manufacturers. | Integration of advanced emulsion systems, particle size optimization, and processing efficiency innovations enabling superior operational performance. |
| Industrial Rubber Growth | Environmental Regulations | Application-Specific Formulations |
| Increasing conveyor belt production and industrial roller manufacturing creating demand for specialized tackifier solutions. | Emission standards and workplace safety requirements increasing compliance costs and processing complexity. | Development of specialized formulations tailored to specific rubber compounds and processing conditions providing enhanced performance benefits. |
| Performance Requirements | Competition from Alternatives | Supply Chain Integration |
| Growing demand for resins supporting improved adhesion performance, thermal stability, and processing efficiency in demanding applications. | Alternative tackifying systems and bonding technologies presenting competitive pressure in price-sensitive segments. | Enhanced technical partnerships between resin producers and rubber manufacturers providing collaborative development capabilities. |
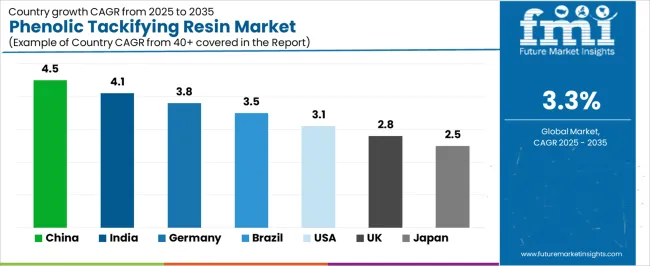
| Country | CAGR (2025-2035) |
|---|---|
| China | 4.5% |
| India | 4.1% |
| Germany | 3.8% |
| Brazil | 3.5% |
| USA | 3.1% |
| UK | 2.8% |
| Japan | 2.5% |
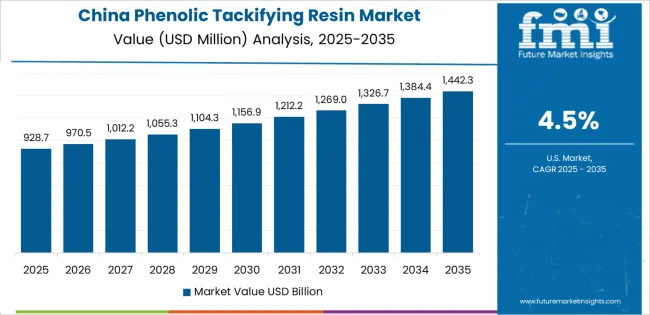
Revenue from phenolic tackifying resin in China is projected to exhibit strong growth with a market value of USD 746.5 million by 2035, driven by expanding tire manufacturing infrastructure and comprehensive rubber processing industry development creating substantial opportunities for resin suppliers across automotive operations, industrial applications, and specialty rubber sectors. The country's established tire production leadership and expanding automotive component manufacturing capabilities are creating significant demand for both conventional and premium tackifying resins. Major tire manufacturers including GITI Tire, Triangle Tire, and Linglong Tire are establishing comprehensive local production facilities to support large-scale manufacturing operations and meet growing domestic and export demand for efficient rubber processing solutions.
Tire manufacturing modernization programs are supporting widespread adoption of advanced tackifying resins across rubber compounding operations, driving demand for high-performance functional additives. Industrial rubber processing expansion and conveyor belt manufacturing growth are creating substantial opportunities for resin suppliers requiring reliable performance and cost-effective processing solutions. Export-oriented tire production and international quality standard compliance are facilitating adoption of premium resin formulations throughout major manufacturing regions.
Revenue from phenolic tackifying resin in India is expanding to reach USD 436.4 million by 2035, supported by extensive tire manufacturing capacity additions and comprehensive automotive component industry development creating sustained demand for reliable tackifying resins across diverse rubber processing categories and specialty application segments. The country's growing vehicle population and expanding commercial vehicle production are driving demand for resin solutions that provide consistent adhesion performance while supporting cost-effective manufacturing requirements. Tire manufacturers and rubber processors are investing in local production facilities to support growing manufacturing operations and domestic market demand.
Automotive sector growth and tire replacement market expansion are creating opportunities for tackifying resins across diverse manufacturing segments requiring reliable performance and competitive processing costs. Manufacturing infrastructure development and quality standard advancement are driving investments in resin supply chains supporting technical requirements throughout major industrial regions. Industrial rubber manufacturing growth and specialty application development programs are enhancing demand for processing-grade tackifiers throughout major production centers.
Demand for phenolic tackifying resin in Germany is projected to reach USD 363.5 million by 2035, supported by the country's leadership in automotive manufacturing and advanced rubber processing technologies requiring sophisticated tackifier systems for premium tire production and industrial applications. German tire manufacturers and rubber processors are implementing high-quality resin systems that support advanced formulation techniques, operational efficiency, and comprehensive quality protocols. The market is characterized by focus on technical performance, product consistency, and compliance with stringent automotive and industrial standards.
Premium tire manufacturing investments are prioritizing advanced tackifying systems that demonstrate superior adhesion performance and quality while meeting German automotive and safety standards. Technical excellence programs and operational optimization initiatives are driving adoption of precision-engineered resin formulations that support advanced manufacturing systems and performance requirements. Research and development programs for rubber compound enhancement are facilitating adoption of specialized tackifier formulations throughout major industrial centers.
Revenue from phenolic tackifying resin in Brazil is growing to reach USD 108.0 million by 2035, driven by automotive manufacturing development programs and increasing tire production capacity creating sustained opportunities for resin suppliers serving both original equipment manufacturers and replacement market operations. The country's expanding vehicle fleet and growing commercial transportation sector are creating demand for tackifying resins that support diverse tire specifications while maintaining processing performance standards. Tire manufacturers and rubber processors are developing procurement strategies to support operational efficiency and cost competitiveness.
Automotive sector modernization programs and tire manufacturing expansion are facilitating adoption of tackifying resins capable of supporting diverse performance requirements and competitive cost structures. Industrial rubber application development and conveyor belt manufacturing programs are enhancing demand for processing-grade resins that support operational efficiency and performance reliability. Domestic production capacity additions and import substitution initiatives are creating opportunities for local resin manufacturing capabilities.
Demand for phenolic tackifying resin in USA is projected to reach USD 319.4 million by 2035, driven by premium tire manufacturing excellence and specialty industrial rubber capabilities supporting advanced automotive applications and comprehensive industrial requirements. The country's established tire manufacturing tradition and specialized rubber processing sectors are creating demand for high-quality tackifying resins that support operational performance and technical standards. Resin manufacturers and chemical suppliers are maintaining comprehensive technical capabilities to support diverse manufacturing requirements.
Premium tire manufacturing and specialty rubber processing programs are supporting demand for processing-grade tackifiers that meet contemporary performance and reliability standards. Industrial application development and high-performance rubber compound programs are creating opportunities for specialized resins that provide comprehensive technical support. Manufacturing optimization and quality enhancement programs are facilitating adoption of advanced tackifier formulations throughout major production facilities.
Revenue from phenolic tackifying resin in UK is growing to reach USD 179.1 million by 2035, supported by specialized tire manufacturing operations and industrial rubber processing capabilities serving premium automotive and technical applications. Post-Brexit supply chain adjustments have created opportunities for domestic resin suppliers while maintaining quality specifications required by established rubber manufacturers. Technical expertise in specialized rubber compounds supports demand for premium tackifier formulations.
Industrial conveyor systems and specialty rubber applications drive consistent resin consumption, with mining equipment and material handling sectors providing stable demand channels. Regulatory compliance requirements and environmental standards favor established resin suppliers with comprehensive technical documentation and quality assurance capabilities. Manufacturing consolidation trends concentrate purchasing power with larger operations while creating niche opportunities for specialized formulations.
Demand for phenolic tackifying resin in Japan is projected to reach USD 322.3 million by 2035, expanding at a CAGR of 2.5%, driven by premium tire manufacturing excellence and precision rubber processing capabilities supporting advanced automotive standards and comprehensive quality applications. The country's established automotive tradition and stringent quality requirements are creating demand for high-specification tackifying resins that support operational performance and regulatory standards. Resin manufacturers maintain comprehensive quality capabilities to support exacting manufacturing requirements.
Premium automotive manufacturing and technical rubber processing programs are supporting demand for processing-grade tackifiers that meet rigorous performance and consistency standards. Quality assurance systems and technical support requirements are creating opportunities for specialized resins that provide comprehensive manufacturing support. Precision manufacturing and performance optimization programs are facilitating adoption of advanced tackifier capabilities throughout major industrial facilities.
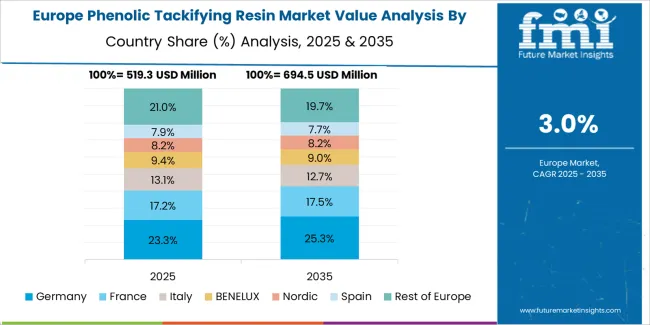
The phenolic tackifying resin market in Europe is projected to grow from USD 563.7 million in 2025 to USD 837.8 million by 2035, registering a CAGR of 4.0% over the forecast period. Germany is expected to maintain its leadership position with a 29.2% market share in 2025, declining slightly to 28.4% by 2035, supported by its advanced automotive manufacturing base and major tire production facilities including Continental and Michelin operations.
France follows with a 16.8% share in 2025, projected to reach 17.1% by 2035, driven by comprehensive tire manufacturing operations and industrial rubber processing capabilities at major production centers. The United Kingdom holds a 14.6% share in 2025, expected to decrease to 14.2% by 2035 due to post-Brexit manufacturing adjustments and supply chain reconfigurations. Italy commands a 12.3% share, while Spain accounts for 10.9% in 2025. The Rest of Europe region is anticipated to gain momentum, expanding its collective share from 16.2% to 17.6% by 2035, attributed to increasing tackifier adoption in Eastern European tire manufacturing facilities and growing industrial rubber processing operations implementing advanced formulation systems.
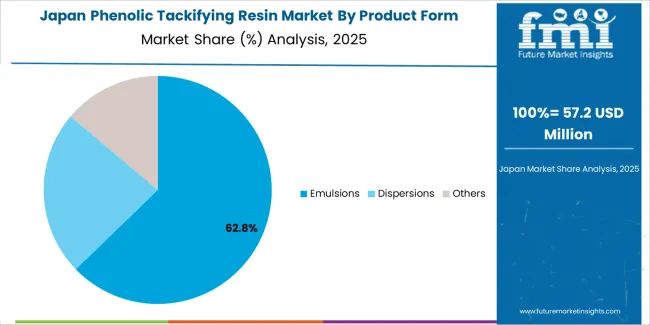
Japanese phenolic tackifying resin operations reflect the country's exacting quality standards and sophisticated technical expectations. Major tire manufacturers including Bridgestone, Yokohama, and Sumitomo maintain rigorous supplier qualification processes that often exceed international standards, requiring extensive documentation, batch testing, and facility audits that can take 12-18 months to complete. This creates high barriers for new suppliers but ensures consistent quality that supports premium tire positioning.
The Japanese market demonstrates unique application preferences, with significant demand for precisely controlled particle size distributions and specific softening point ranges tailored to advanced rubber compound formulations. Companies require exact viscosity specifications and compatibility parameters that differ from Western applications, driving demand for customized processing capabilities and technical support.
Regulatory oversight through the Ministry of Economy, Trade and Industry emphasizes comprehensive quality management and traceability requirements that surpass most international standards. The chemical registration system requires detailed technical documentation, creating advantages for suppliers with transparent manufacturing processes and comprehensive quality control systems.
Supply chain management focuses on relationship-based partnerships rather than purely transactional procurement. Japanese companies typically maintain long-term supplier relationships spanning decades, with annual contract negotiations emphasizing quality consistency and technical support over price competition. This stability supports investment in specialized production equipment tailored to Japanese specifications and enables collaborative formula development programs.
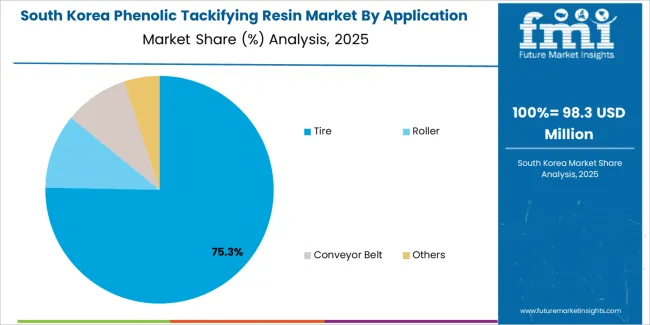
South Korean phenolic tackifying resin operations reflect the country's advanced tire manufacturing sector and export-oriented business model. Major manufacturers including Hankook Tire, Kumho Tire, and Nexen Tire drive sophisticated resin procurement strategies, establishing direct relationships with global suppliers to secure consistent quality and pricing for their operations targeting both domestic and international markets.
The Korean market demonstrates particular strength in applying tackifying resins to high-performance tire formulations, with companies integrating advanced adhesion systems into products designed for premium vehicle segments. This technical focus creates demand for specific processing specifications that differ from commodity applications, requiring suppliers to provide comprehensive technical support and formulation assistance.
Regulatory frameworks emphasize chemical safety and traceability, with Ministry of Environment standards often exceeding international requirements. This creates barriers for smaller resin suppliers but benefits established producers who can demonstrate compliance capabilities. The regulatory environment particularly favors suppliers with comprehensive safety documentation and environmental management systems.
Supply chain efficiency remains critical given Korea's import dependence for phenolic feedstocks and processing chemicals. Companies increasingly pursue long-term contracts with suppliers to ensure reliable access to raw materials while managing foreign exchange risks. Technical service investments support quality preservation and formula optimization during production transitions.
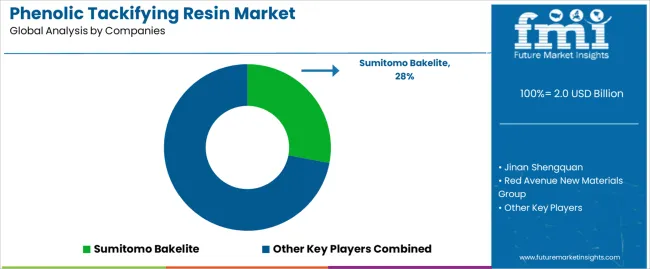
Profit pools are consolidating around integrated producers with phenolic resin manufacturing capabilities and established tire industry relationships. Value is migrating from commodity resin trading to application-specific formulations where technical service, consistent quality, and processing optimization command premiums. Several competitive archetypes define market structure: global chemical companies with diversified resin portfolios and comprehensive technical support; specialized phenolic producers focusing on tire applications with formulation expertise; regional manufacturers serving local tire production with cost advantages; and integrated rubber processors backward-integrating into tackifier production for captive consumption.
Switching costs stabilize incumbent positions through formula qualification requirements, batch consistency expectations, and technical support dependencies. Tire manufacturers invest 6-12 months validating new tackifier sources, creating barriers that protect established suppliers. Quality specifications for particle size distribution, softening point ranges, and rubber compatibility establish performance thresholds that limit competitive entry. However, price volatility in phenolic feedstocks and consolidation among tire manufacturers periodically reopen supplier relationships.
Market dynamics favor producers with diversified phenolic resin portfolios spanning multiple rubber applications. Technical service capabilities that support formula optimization, processing troubleshooting, and performance testing create differentiation in premium segments. Supply chain integration from phenolic feedstock sourcing through final emulsion production enables cost management and quality control advantages. Geographic proximity to major tire manufacturing centers reduces logistics costs and enables responsive technical support, particularly valuable in Asia Pacific markets where tire production concentrates.
Consolidation continues as resin producers seek scale economies to absorb raw material price volatility and technical service investments. Vertical integration opportunities attract tire manufacturers seeking supply security, though specialized chemistry expertise limits upstream moves. Digital platforms remain minimal given technical complexity and validation requirements, maintaining relationship-based sales models. Do now: secure long-term contracts with Asia Pacific tire producers through technical collaboration and competitive pricing structures; hard-wire emulsion technology capabilities and quality consistency systems. Option: develop specialized formulations for electric vehicle tire applications with unique performance requirements.
| Stakeholder Type | Primary Advantage | Repeatable Plays |
|---|---|---|
| Global chemical companies | Diversified portfolios, technical service | Multi-application formulations, R&D partnerships, global supply networks |
| Specialized phenolic producers | Application expertise, tire industry relationships | Formula optimization, processing support, quality consistency |
| Regional manufacturers | Cost position, local presence | Proximity to tire plants, responsive service, competitive pricing |
| Integrated rubber processors | Supply security, captive consumption | Backward integration, custom formulations, cost control |
| Items | Values |
|---|---|
| Quantitative Units | USD 2 billion |
| Product Form | Emulsions, Dispersions, Others |
| Application | Tire, Roller, Conveyor Belt, Others |
| Regions Covered | North America, Latin America, Europe, Asia Pacific, Middle East & Africa |
| Countries Covered | United States, Germany, China, India, Brazil, United Kingdom, Japan, and other 40+ countries |
| Key Companies Profiled | Sumitomo Bakelite, Jinan Shengquan, Red Avenue New Materials Group, SI Group, Wuhan Jinghe Chemical, Allnex, Asahi Yukizai Corporation, Aica Kogyo |
| Additional Attributes | Dollar sales by product form/application, regional demand, competitive landscape, emulsion vs. dispersion adoption, manufacturing process integration, and technical innovation driving adhesion enhancement, processing efficiency, and quality improvement |
The global phenolic tackifying resin market is estimated to be valued at USD 2.0 billion in 2025.
The market size for the phenolic tackifying resin market is projected to reach USD 2.8 billion by 2035.
The phenolic tackifying resin market is expected to grow at a 3.3% CAGR between 2025 and 2035.
The key product types in phenolic tackifying resin market are emulsions, dispersions and others.
In terms of application, tire segment to command 74.6% share in the phenolic tackifying resin market in 2025.


Full Research Suite comprises of:
Market outlook & trends analysis
Interviews & case studies
Strategic recommendations
Vendor profiles & capabilities analysis
5-year forecasts
8 regions and 60+ country-level data splits
Market segment data splits
12 months of continuous data updates
DELIVERED AS:
PDF EXCEL ONLINE
Phenolic Antioxidants Market Size and Share Forecast Outlook 2025 to 2035
Phenolic Board Market Growth – Trends & Forecast 2024-2034
Phenolic Resins Market Size and Share Forecast Outlook 2025 to 2035
Phenolic Adhesive Resin Market Size and Share Forecast Outlook 2025 to 2035
Ribbed Phenolic Caps Market
Resin Silencer Market Size and Share Forecast Outlook 2025 to 2035
Resin Capsule Market Forecast and Outlook 2025 to 2035
Resin Cement for Luting Market Size and Share Forecast Outlook 2025 to 2035
Resin Pigments Market Size and Share Forecast Outlook 2025 to 2035
PE Resins Market Size and Share Forecast Outlook 2025 to 2035
Ink Resin Market Size and Share Forecast Outlook 2025 to 2035
Cast Resin Transformer Market Size and Share Forecast Outlook 2025 to 2035
Agar Resin Market
Epoxy Resin Industry Analysis in Asia Pacific Size and Share Forecast Outlook 2025 to 2035
Furan Resin Market Size and Share Forecast Outlook 2025 to 2035
Amino Resin Market Growth - Trends & Forecast 2025 to 2035
Epoxy Resin Market Growth – Trends & Forecast 2024-2034
Cobalt Resinate Market Size and Share Forecast Outlook 2025 to 2035
Compact Resin Type Silencer Market Size and Share Forecast Outlook 2025 to 2035
Acrylic Resin Market Size and Share Forecast Outlook 2025 to 2035

Thank you!
You will receive an email from our Business Development Manager. Please be sure to check your SPAM/JUNK folder too.
Chat With
MaRIA