Reports

- Global Locations -

Headquarters

Future Market Insights, Inc.

Christiana Corporate, 200
Continental Drive, Suite 401,
Newark, Delaware - 19713,
United States

T: +1-845-579-5705

Americas

Future Market Insights, Inc.

616 Corporate Way, Suite 2-9018,
Valley Cottage, NY 10989, United States

T: +1-347-918-3531

MEA

Future Market Insights

1602-6 Jumeirah Bay X2 Tower, Plot No: JLT-PH2-X2A,
Jumeirah Lakes Towers, Dubai,
United Arab Emirates

Europe

Future Market Insights

3rd Floor, 207 Regent Street,
W1B 3HH London
United Kingdom

T: + 44 (0) 20 8123 9659
D: +44 (0) 20 3287 4268

Asia Pacific

Future Market Insights

IndiaLand Global Tech Park, Unit UG-1, Behind Grand HighStreet, Phase 1, Hinjawadi, MH, Pune – 411057, India

Commercial Printer Market Overview (2022 to 2032)

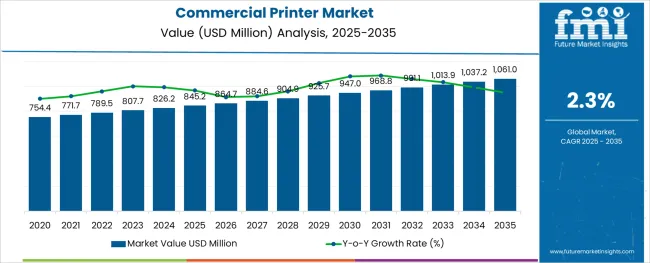
It is anticipated that the global commercial printer market is worth US$ 789.5 Million in 2022. The commercial printer market is expected to expand at a sluggish CAGR of 2.3% and reach US$ 987.9 Million by 2032.

Due to the rising integration of commercial printers into office infrastructure and their adaptation in the printing sector, the commercial printer market is one of the most rapidly growing markets. Additionally, the commercial printer market expansion is attributed to the global digitalization of numerous industries. The popularity of digital printing has boosted the need for expert printers, which increases productivity.

Report Attribute Details
Commercial Printer Value (2022) US$ 789.5 Million
Commercial Printer Market Anticipated Value (2032) US$ 987.9 Million
Commercial Printer Market Projected Growth Rate (2022 to 2032) 2.3%

The commercial printer market share is being driven by investments in automation and technology, high-resolution printing, improved print clarity and smoothness, and highly effective colored printers. Historically, the commercial printer market had a CAGR of 1.9% (2016 to 2021). Due to the availability of substitute printers, conventional printing methods, wet prints, use of high voltage, and high operating costs, the market is still growing slowly and steadily.

For commercial printers, the ongoing digital transformation-specifically, electronic displacement-has posed new difficulties. New commercial printers market trends like digital communications, marketing benefit from the widespread use of the internet, and the capacity to monitor user behavior are benefiting the market.

Don't pay for what you don't need

Customize your report by selecting specific countries or regions and save 30%!

What Stimulates the Expansion of the Commercial Printer Market?

The investment in technology and automation, high-resolution printing, improved clarity, and smoothness of prints, boost the demand for commercial printers. Moreover, technological proliferation and increasing applications across various end-use segments are expected to cause a plunge in printing costs.

The main drivers of the commercial printer market growth are the expanding need for advertising in businesses throughout the globe and rapid technological development. Commercial printers are being used by businesses more frequently since they are more economical and effective for printing in mass. It is also anticipated that green commercial printers, which support waste reduction and reuse by employing eco-friendly paper, inks, coatings, and chemicals, fuel the commercial printer market expansion.

What are the Trends in the Commercial Printer Market?

Small businesses are able to outperform the competition and provide superior local services in a certain product category. The industry profitability for manufacturers and service providers is being hampered by declining sales and falling unit selling prices. To be competitive and hold steady market shares, many businesses need large initial investments. Digital media are replacing print media more and more. Commercial printing has decreased as a result of decreased consumer spending and advertising budgets worldwide.

In addition, these businesses require large upfront expenditures to sustain their competitiveness and stable commercial printer market shares. Growing ePaper adoption, global financial instability, and macroeconomic conditions, including fluctuating currency exchange rates and economic hardships, are some of the primary obstacles facing the commercial printer market.
Sudip Saha
Sudip Saha

Principal Consultant

Talk to Analyst

Find your sweet spots for generating winning opportunities in this market.

Regional Analysis

What is the North America Growth Outlook for the Commercial Printer Market?

Due to increasing adoption in various organizations, North America is anticipated to hold the greatest market share of 21% for the commercial printer industry through 2032. Early adopters of technology, like the United States and Canada, are thought to have a positive effect on the North American regional economy.

Effective sales operations are closely related to a company's profitability. Huge businesses gain an edge as they can serve large consumers with the local or national demand for a commercial printer. Buying resources like ink and paper more cheaply and using expensive printing machinery more effectively offers higher potential in the market.
How is Europe Performing in the Commercial Printer Market?

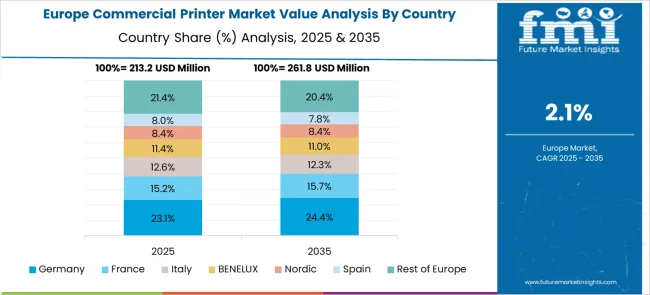
With a market share of 26%, Europe has the fastest-growing market for commercial printers. This is due to commercial printers being more adaptable and responsive. To build a sustainable environment, European nations have mostly concentrated on developing eco-friendly products and procedures. As a result, these nations promote the use of energy-efficient printing techniques.

How Start-ups are Influencing the Commercial Printer Market?

With the environment changing, startups are now focused on zero-waste solutions. There are numerous opportunities in the commercial printer market due to the requirement to produce unique and innovative products with the intention of high-sales printing.

An online marketplace called Printee, founded in 2020 serves as a link between buyers and sellers, as well as printing and delivery businesses. The marketplace also facilitates the production of personalized and distinctive tees and goods by connecting artists, brands, creatives, and companies.

The Pager technology is a zero-waste method that prints books, posters, and pamphlets from unused portions of the paper.
Get the data you need at a Fraction of the cost

Personalize your report by choosing insights you need
and save 40%!

How Key Players are Contributing in the Commercial Printer Market?

Key participants have launched new products to improve the sales of commercial printers. Additionally, the market players are concentrating on increasing investment to bring the best technology and have a competitive advantage.

Recent mergers and product launches:

  • In order to provide heavy-duty printing, Honeywell International, a USA-based maker of commercial and consumer products, developed a new Professional Printer called the PM42 in August 2016.
  • In order to compete in the market for copy machines, American technology corporation HP Inc. announced in September 2016 that it would pay $1.05 billion to buy Samsung's printer division.

Key players:

  • Canon
  • HP Inc
  • Seiko Epson
  • Brother Industries
  • Kyocera
  • Lexmark
  • Fujitsu
  • Ricoh
  • Apple Inc
  • Honeywell International
  • Xerox
  • Lexmark
  • PrinterOn
  • Epson Zebra Technologies

Report Scope

Report Attribute Details
Growth Rate CAGR of 2.3% from 2022 to 2032
Base Year for Estimation 2022
Historical Data 2016 to 2021
Forecast Period 2022 to 2032
Quantitative Units Revenue in US$ Million and CAGR from 2022 to 2032
Report Coverage Revenue Forecast, Volume Forecast, Company Ranking, Competitive Landscape, Growth Factors, Trends, and Pricing Analysis
Segments Covered
  • Product Type
  • Technology
  • Sales Channel
  • Region
Regions Covered
  • North America
  • Latin America
  • Western Europe
  • Eastern Europe
  • The Asia Pacific excluding Japan
  • Japan
  • The Middle East and Africa
Key Countries Profiled
  • The USA
  • Canada
  • Brazil
  • Argentina
  • Germany
  • The UK
  • France
  • Spain
  • Italy
  • Nordics
  • BENELUX
  • Australia & New Zealand
  • China
  • India
  • GCC Countries
  • South Africa
Key Companies Profiled
  • Canon
  • HP Inc
  • Seiko Epson
  • Brother Industries
  • Kyocera
  • Lexmark
  • Fujitsu
  • Ricoh
  • Apple Inc
  • Honeywell International
  • Xerox
  • Lexmark
  • PrinterOn
  • Epson Zebra Technologies
Customization Available Upon Request

Key segments

By Technology:

  • Professional Inkjet Printers
  • Professional Laser Printers

By Product Type:

  • Professional Desktop Printer
  • Professional Commercial Printers

By Sales Channel:

  • E-Commerce/Online
  • Organized Retail Stores
  • Unorganized Retail Stores

By Region:

  • North America
  • Latin America
  • Asia Pacific
  • Middle East and Africa (MEA)
  • Europe

Frequently Asked Questions

What is the Projected CAGR for the Commercial Printer Market?

The commercial printer market is projected to have a CAGR of 2.3% through 2032.

Which is the Leading Region in the Commercial Printer Market?

North America dominates the commercial printer market with a share of 21%.

What is the Future Outlook of the Commercial Printer Market?

The commercial printer market is expected to reach US$ 987.9 Million by 2032.

Table of Content

1. Executive Summary | Commercial Printer Market

    1.1. Global Market Outlook

    1.2. Demand-side Trends

    1.3. Supply-side Trends

    1.4. Technology Roadmap Analysis

    1.5. Analysis and Recommendations

2. Market Overview

    2.1. Market Coverage / Taxonomy

    2.2. Market Definition / Scope / Limitations

3. Market Background

    3.1. Market Dynamics

        3.1.1. Drivers

        3.1.2. Restraints

        3.1.3. Opportunity

        3.1.4. Trends

    3.2. Scenario Forecast

        3.2.1. Demand in Optimistic Scenario

        3.2.2. Demand in Likely Scenario

        3.2.3. Demand in Conservative Scenario

    3.3. Opportunity Map Analysis

    3.4. Product Life Cycle Analysis

    3.5. Supply Chain Analysis

        3.5.1. Supply Side Participants and Their Roles

            3.5.1.1. Producers

            3.5.1.2. Mid-Level Participants (Traders/ Agents/ Brokers)

            3.5.1.3. Wholesalers and Distributors

        3.5.2. Value Added and Value Created at Node in the Supply Chain

        3.5.3. List of Raw Material Suppliers

        3.5.4. List of Existing and Potential Buyers

    3.6. Investment Feasibility Matrix

    3.7. Value Chain Analysis

        3.7.1. Profit Margin Analysis

        3.7.2. Wholesalers and Distributors

        3.7.3. Retailers

    3.8. PESTLE and Porter’s Analysis

    3.9. Regulatory Landscape

        3.9.1. By Key Regions

        3.9.2. By Key Countries

    3.10. Regional Parent Market Outlook

    3.11. Production and Consumption Statistics

    3.12. Import and Export Statistics

4. Global Market Analysis 2017 to 2021 and Forecast, 2022 to 2032

    4.1. Historical Market Size Value (US$ Million) & Volume (Units) Analysis, 2017 to 2021

    4.2. Current and Future Market Size Value (US$ Million) & Volume (Units) Projections, 2022 to 2032

        4.2.1. Y-o-Y Growth Trend Analysis

        4.2.2. Absolute Opportunity Analysis

5. Global Market Analysis 2017 to 2021 and Forecast 2022 to 2032, By Type

    5.1. Introduction / Key Findings

    5.2. Historical Market Size Value (US$ Million) & Volume (Units) Analysis By Type, 2017 to 2021

    5.3. Current and Future Market Size Value (US$ Million) & Volume (Units) Analysis and Forecast By Type, 2022 to 2032

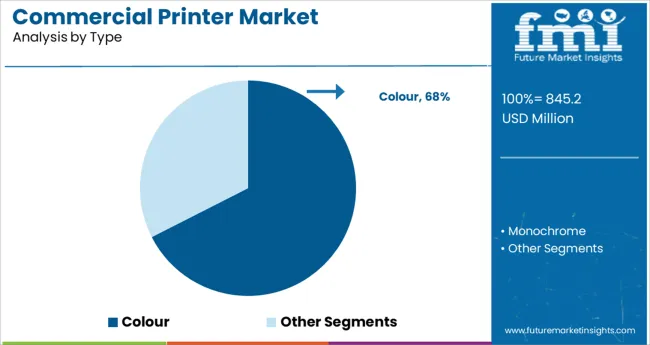
        5.3.1. Colour

        5.3.2. Monochrome

    5.4. Y-o-Y Growth Trend Analysis By Type, 2017 to 2021

    5.5. Absolute Opportunity Analysis By Type, 2022 to 2032

6. Global Market Analysis 2017 to 2021 and Forecast 2022 to 2032, By Technology Type

    6.1. Introduction / Key Findings

    6.2. Historical Market Size Value (US$ Million) & Volume (Units) Analysis By Technology Type, 2017 to 2021

    6.3. Current and Future Market Size Value (US$ Million) & Volume (Units) Analysis and Forecast By Technology Type, 2022 to 2032

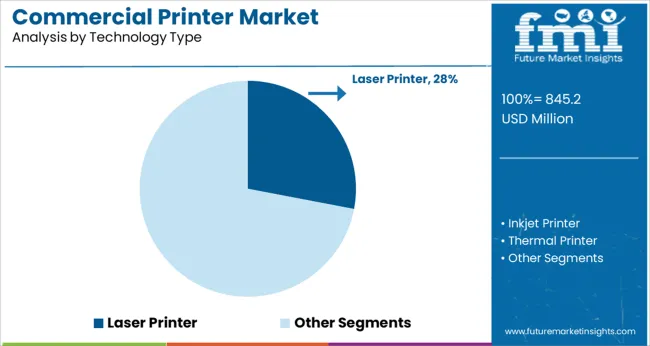
        6.3.1. Dot Matrix Printer

        6.3.2. Inkjet Printer

        6.3.3. LED Printer

        6.3.4. Thermal Printer

        6.3.5. Laser Printer

    6.4. Y-o-Y Growth Trend Analysis By Technology Type, 2017 to 2021

    6.5. Absolute Opportunity Analysis By Technology Type, 2022 to 2032

7. Global Market Analysis 2017 to 2021 and Forecast 2022 to 2032, By Printer Interface

    7.1. Introduction / Key Findings

    7.2. Historical Market Size Value (US$ Million) & Volume (Units) Analysis By Printer Interface, 2017 to 2021

    7.3. Current and Future Market Size Value (US$ Million) & Volume (Units) Analysis and Forecast By Printer Interface, 2022 to 2032

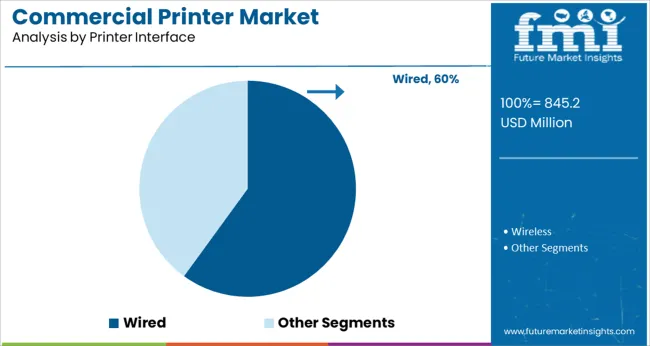
        7.3.1. Wired

        7.3.2. Wireless

    7.4. Y-o-Y Growth Trend Analysis By Printer Interface, 2017 to 2021

    7.5. Absolute Opportunity Analysis By Printer Interface, 2022 to 2032

8. Global Market Analysis 2017 to 2021 and Forecast 2022 to 2032, By Application

    8.1. Introduction / Key Findings

    8.2. Historical Market Size Value (US$ Million) & Volume (Units) Analysis By Application, 2017 to 2021

    8.3. Current and Future Market Size Value (US$ Million) & Volume (Units) Analysis and Forecast By Application, 2022 to 2032

        8.3.1. Office

        8.3.2. Publishing Industry

        8.3.3. Advertising Industry

        8.3.4. Other Applications

    8.4. Y-o-Y Growth Trend Analysis By Application, 2017 to 2021

    8.5. Absolute Opportunity Analysis By Application, 2022 to 2032

9. Global Market Analysis 2017 to 2021 and Forecast 2022 to 2032, By Region

    9.1. Introduction

    9.2. Historical Market Size Value (US$ Million) & Volume (Units) Analysis By Region, 2017 to 2021

    9.3. Current Market Size Value (US$ Million) & Volume (Units) Analysis and Forecast By Region, 2022 to 2032

        9.3.1. North America

        9.3.2. Latin America

        9.3.3. Europe

        9.3.4. Asia Pacific

        9.3.5. Middle East and Africa

    9.4. Market Attractiveness Analysis By Region

10. North America Market Analysis 2017 to 2021 and Forecast 2022 to 2032, By Country

    10.1. Historical Market Size Value (US$ Million) & Volume (Units) Trend Analysis By Market Taxonomy, 2017 to 2021

    10.2. Market Size Value (US$ Million) & Volume (Units) Forecast By Market Taxonomy, 2022 to 2032

        10.2.1. By Country

            10.2.1.1. United States of America

            10.2.1.2. Canada

        10.2.2. By Type

        10.2.3. By Technology Type

        10.2.4. By Printer Interface

        10.2.5. By Application

    10.3. Market Attractiveness Analysis

        10.3.1. By Country

        10.3.2. By Type

        10.3.3. By Technology Type

        10.3.4. By Printer Interface

        10.3.5. By Application

    10.4. Key Takeaways

11. Latin America Market Analysis 2017 to 2021 and Forecast 2022 to 2032, By Country

    11.1. Historical Market Size Value (US$ Million) & Volume (Units) Trend Analysis By Market Taxonomy, 2017 to 2021

    11.2. Market Size Value (US$ Million) & Volume (Units) Forecast By Market Taxonomy, 2022 to 2032

        11.2.1. By Country

            11.2.1.1. Brazil

            11.2.1.2. Mexico

            11.2.1.3. Rest of Latin America

        11.2.2. By Type

        11.2.3. By Technology Type

        11.2.4. By Printer Interface

        11.2.5. By Application

    11.3. Market Attractiveness Analysis

        11.3.1. By Country

        11.3.2. By Type

        11.3.3. By Technology Type

        11.3.4. By Printer Interface

        11.3.5. By Application

    11.4. Key Takeaways

12. Europe Market Analysis 2017 to 2021 and Forecast 2022 to 2032, By Country

    12.1. Historical Market Size Value (US$ Million) & Volume (Units) Trend Analysis By Market Taxonomy, 2017 to 2021

    12.2. Market Size Value (US$ Million) & Volume (Units) Forecast By Market Taxonomy, 2022 to 2032

        12.2.1. By Country

            12.2.1.1. Germany

            12.2.1.2. United Kingdom

            12.2.1.3. France

            12.2.1.4. Spain

            12.2.1.5. Italy

            12.2.1.6. Rest of Europe

        12.2.2. By Type

        12.2.3. By Technology Type

        12.2.4. By Printer Interface

        12.2.5. By Application

    12.3. Market Attractiveness Analysis

        12.3.1. By Country

        12.3.2. By Type

        12.3.3. By Technology Type

        12.3.4. By Printer Interface

        12.3.5. By Application

    12.4. Key Takeaways

13. Asia Pacific Market Analysis 2017 to 2021 and Forecast 2022 to 2032, By Country

    13.1. Historical Market Size Value (US$ Million) & Volume (Units) Trend Analysis By Market Taxonomy, 2017 to 2021

    13.2. Market Size Value (US$ Million) & Volume (Units) Forecast By Market Taxonomy, 2022 to 2032

        13.2.1. By Country

            13.2.1.1. China

            13.2.1.2. Japan

            13.2.1.3. South Korea

            13.2.1.4. Malaysia

            13.2.1.5. Singapore

            13.2.1.6. Australia

            13.2.1.7. New Zealand

            13.2.1.8. Rest of Asia-Pacific (APAC)

        13.2.2. By Type

        13.2.3. By Technology Type

        13.2.4. By Printer Interface

        13.2.5. By Application

    13.3. Market Attractiveness Analysis

        13.3.1. By Country

        13.3.2. By Type

        13.3.3. By Technology Type

        13.3.4. By Printer Interface

        13.3.5. By Application

    13.4. Key Takeaways

14. Middle East and Africa Market Analysis 2017 to 2021 and Forecast 2022 to 2032, By Country

    14.1. Historical Market Size Value (US$ Million) & Volume (Units) Trend Analysis By Market Taxonomy, 2017 to 2021

    14.2. Market Size Value (US$ Million) & Volume (Units) Forecast By Market Taxonomy, 2022 to 2032

        14.2.1. By Country

            14.2.1.1. GCC Countries

            14.2.1.2. South Africa

            14.2.1.3. Israel

            14.2.1.4. Rest of Middle East and Africa

        14.2.2. By Type

        14.2.3. By Technology Type

        14.2.4. By Printer Interface

        14.2.5. By Application

    14.3. Market Attractiveness Analysis

        14.3.1. By Country

        14.3.2. By Type

        14.3.3. By Technology Type

        14.3.4. By Printer Interface

        14.3.5. By Application

    14.4. Key Takeaways

15. Key Countries Market Analysis

    15.1. United States of America

        15.1.1. Pricing Analysis

        15.1.2. Market Share Analysis, 2021

            15.1.2.1. By Type

            15.1.2.2. By Technology Type

            15.1.2.3. By Printer Interface

            15.1.2.4. By Application

    15.2. Canada

        15.2.1. Pricing Analysis

        15.2.2. Market Share Analysis, 2021

            15.2.2.1. By Type

            15.2.2.2. By Technology Type

            15.2.2.3. By Printer Interface

            15.2.2.4. By Application

    15.3. Brazil

        15.3.1. Pricing Analysis

        15.3.2. Market Share Analysis, 2021

            15.3.2.1. By Type

            15.3.2.2. By Technology Type

            15.3.2.3. By Printer Interface

            15.3.2.4. By Application

    15.4. Mexico

        15.4.1. Pricing Analysis

        15.4.2. Market Share Analysis, 2021

            15.4.2.1. By Type

            15.4.2.2. By Technology Type

            15.4.2.3. By Printer Interface

            15.4.2.4. By Application

    15.5. Germany

        15.5.1. Pricing Analysis

        15.5.2. Market Share Analysis, 2021

            15.5.2.1. By Type

            15.5.2.2. By Technology Type

            15.5.2.3. By Printer Interface

            15.5.2.4. By Application

    15.6. United Kingdom

        15.6.1. Pricing Analysis

        15.6.2. Market Share Analysis, 2021

            15.6.2.1. By Type

            15.6.2.2. By Technology Type

            15.6.2.3. By Printer Interface

            15.6.2.4. By Application

    15.7. France

        15.7.1. Pricing Analysis

        15.7.2. Market Share Analysis, 2021

            15.7.2.1. By Type

            15.7.2.2. By Technology Type

            15.7.2.3. By Printer Interface

            15.7.2.4. By Application

    15.8. Spain

        15.8.1. Pricing Analysis

        15.8.2. Market Share Analysis, 2021

            15.8.2.1. By Type

            15.8.2.2. By Technology Type

            15.8.2.3. By Printer Interface

            15.8.2.4. By Application

    15.9. Italy

        15.9.1. Pricing Analysis

        15.9.2. Market Share Analysis, 2021

            15.9.2.1. By Type

            15.9.2.2. By Technology Type

            15.9.2.3. By Printer Interface

            15.9.2.4. By Application

    15.10. China

        15.10.1. Pricing Analysis

        15.10.2. Market Share Analysis, 2021

            15.10.2.1. By Type

            15.10.2.2. By Technology Type

            15.10.2.3. By Printer Interface

            15.10.2.4. By Application

    15.11. Japan

        15.11.1. Pricing Analysis

        15.11.2. Market Share Analysis, 2021

            15.11.2.1. By Type

            15.11.2.2. By Technology Type

            15.11.2.3. By Printer Interface

            15.11.2.4. By Application

    15.12. South Korea

        15.12.1. Pricing Analysis

        15.12.2. Market Share Analysis, 2021

            15.12.2.1. By Type

            15.12.2.2. By Technology Type

            15.12.2.3. By Printer Interface

            15.12.2.4. By Application

    15.13. Malaysia

        15.13.1. Pricing Analysis

        15.13.2. Market Share Analysis, 2021

            15.13.2.1. By Type

            15.13.2.2. By Technology Type

            15.13.2.3. By Printer Interface

            15.13.2.4. By Application

    15.14. Singapore

        15.14.1. Pricing Analysis

        15.14.2. Market Share Analysis, 2021

            15.14.2.1. By Type

            15.14.2.2. By Technology Type

            15.14.2.3. By Printer Interface

            15.14.2.4. By Application

    15.15. Australia

        15.15.1. Pricing Analysis

        15.15.2. Market Share Analysis, 2021

            15.15.2.1. By Type

            15.15.2.2. By Technology Type

            15.15.2.3. By Printer Interface

            15.15.2.4. By Application

    15.16. New Zealand

        15.16.1. Pricing Analysis

        15.16.2. Market Share Analysis, 2021

            15.16.2.1. By Type

            15.16.2.2. By Technology Type

            15.16.2.3. By Printer Interface

            15.16.2.4. By Application

    15.17. GCC Countries

        15.17.1. Pricing Analysis

        15.17.2. Market Share Analysis, 2021

            15.17.2.1. By Type

            15.17.2.2. By Technology Type

            15.17.2.3. By Printer Interface

            15.17.2.4. By Application

    15.18. South Africa

        15.18.1. Pricing Analysis

        15.18.2. Market Share Analysis, 2021

            15.18.2.1. By Type

            15.18.2.2. By Technology Type

            15.18.2.3. By Printer Interface

            15.18.2.4. By Application

    15.19. Israel

        15.19.1. Pricing Analysis

        15.19.2. Market Share Analysis, 2021

            15.19.2.1. By Type

            15.19.2.2. By Technology Type

            15.19.2.3. By Printer Interface

            15.19.2.4. By Application

16. Market Structure Analysis

    16.1. Competition Dashboard

    16.2. Competition Benchmarking

    16.3. Market Share Analysis of Top Players

        16.3.1. By Regional

        16.3.2. By Type

        16.3.3. By Technology Type

        16.3.4. By Printer Interface

        16.3.5. By Application

17. Competition Analysis

    17.1. Competition Deep Dive

        17.1.1. Zebra

            17.1.1.1. Overview

            17.1.1.2. Product Portfolio

            17.1.1.3. Profitability by Market Segments

            17.1.1.4. Sales Footprint

            17.1.1.5. Strategy Overview

                17.1.1.5.1. Marketing Strategy

                17.1.1.5.2. Product Strategy

                17.1.1.5.3. Channel Strategy

        17.1.2. Epson

            17.1.2.1. Overview

            17.1.2.2. Product Portfolio

            17.1.2.3. Profitability by Market Segments

            17.1.2.4. Sales Footprint

            17.1.2.5. Strategy Overview

                17.1.2.5.1. Marketing Strategy

                17.1.2.5.2. Product Strategy

                17.1.2.5.3. Channel Strategy

        17.1.3. HP

            17.1.3.1. Overview

            17.1.3.2. Product Portfolio

            17.1.3.3. Profitability by Market Segments

            17.1.3.4. Sales Footprint

            17.1.3.5. Strategy Overview

                17.1.3.5.1. Marketing Strategy

                17.1.3.5.2. Product Strategy

                17.1.3.5.3. Channel Strategy

        17.1.4. Domino Printing Sciences

            17.1.4.1. Overview

            17.1.4.2. Product Portfolio

            17.1.4.3. Profitability by Market Segments

            17.1.4.4. Sales Footprint

            17.1.4.5. Strategy Overview

                17.1.4.5.1. Marketing Strategy

                17.1.4.5.2. Product Strategy

                17.1.4.5.3. Channel Strategy

        17.1.5. SATO

            17.1.5.1. Overview

            17.1.5.2. Product Portfolio

            17.1.5.3. Profitability by Market Segments

            17.1.5.4. Sales Footprint

            17.1.5.5. Strategy Overview

                17.1.5.5.1. Marketing Strategy

                17.1.5.5.2. Product Strategy

                17.1.5.5.3. Channel Strategy

        17.1.6. Honeywell

            17.1.6.1. Overview

            17.1.6.2. Product Portfolio

            17.1.6.3. Profitability by Market Segments

            17.1.6.4. Sales Footprint

            17.1.6.5. Strategy Overview

                17.1.6.5.1. Marketing Strategy

                17.1.6.5.2. Product Strategy

                17.1.6.5.3. Channel Strategy

        17.1.7. TSC

            17.1.7.1. Overview

            17.1.7.2. Product Portfolio

            17.1.7.3. Profitability by Market Segments

            17.1.7.4. Sales Footprint

            17.1.7.5. Strategy Overview

                17.1.7.5.1. Marketing Strategy

                17.1.7.5.2. Product Strategy

                17.1.7.5.3. Channel Strategy

        17.1.8. Videojet

            17.1.8.1. Overview

            17.1.8.2. Product Portfolio

            17.1.8.3. Profitability by Market Segments

            17.1.8.4. Sales Footprint

            17.1.8.5. Strategy Overview

                17.1.8.5.1. Marketing Strategy

                17.1.8.5.2. Product Strategy

                17.1.8.5.3. Channel Strategy

        17.1.9. KEYENCE

            17.1.9.1. Overview

            17.1.9.2. Product Portfolio

            17.1.9.3. Profitability by Market Segments

            17.1.9.4. Sales Footprint

            17.1.9.5. Strategy Overview

                17.1.9.5.1. Marketing Strategy

                17.1.9.5.2. Product Strategy

                17.1.9.5.3. Channel Strategy

        17.1.10. Xerox

            17.1.10.1. Overview

            17.1.10.2. Product Portfolio

            17.1.10.3. Profitability by Market Segments

            17.1.10.4. Sales Footprint

            17.1.10.5. Strategy Overview

                17.1.10.5.1. Marketing Strategy

                17.1.10.5.2. Product Strategy

                17.1.10.5.3. Channel Strategy

        17.1.11. Durst

            17.1.11.1. Overview

            17.1.11.2. Product Portfolio

            17.1.11.3. Profitability by Market Segments

            17.1.11.4. Sales Footprint

            17.1.11.5. Strategy Overview

                17.1.11.5.1. Marketing Strategy

                17.1.11.5.2. Product Strategy

                17.1.11.5.3. Channel Strategy

        17.1.12. Brother

            17.1.12.1. Overview

            17.1.12.2. Product Portfolio

            17.1.12.3. Profitability by Market Segments

            17.1.12.4. Sales Footprint

            17.1.12.5. Strategy Overview

                17.1.12.5.1. Marketing Strategy

                17.1.12.5.2. Product Strategy

                17.1.12.5.3. Channel Strategy

        17.1.13. Canon

            17.1.13.1. Overview

            17.1.13.2. Product Portfolio

            17.1.13.3. Profitability by Market Segments

            17.1.13.4. Sales Footprint

            17.1.13.5. Strategy Overview

                17.1.13.5.1. Marketing Strategy

                17.1.13.5.2. Product Strategy

                17.1.13.5.3. Channel Strategy

18. Assumptions & Acronyms Used

19. Research Methodology

Don't pay for what you don't need

Customize your report by selecting specific countries or regions and save 30%!

List of Tables

Table 1: Global Market Value (US$ Million) Forecast by Region, 2017 to 2032

Table 2: Global Market Volume (Units) Forecast by Region, 2017 to 2032

Table 3: Global Market Value (US$ Million) Forecast by Type, 2017 to 2032

Table 4: Global Market Volume (Units) Forecast by Type, 2017 to 2032

Table 5: Global Market Value (US$ Million) Forecast by Technology Type, 2017 to 2032

Table 6: Global Market Volume (Units) Forecast by Technology Type, 2017 to 2032

Table 7: Global Market Value (US$ Million) Forecast by Printer Interface, 2017 to 2032

Table 8: Global Market Volume (Units) Forecast by Printer Interface, 2017 to 2032

Table 9: Global Market Value (US$ Million) Forecast by Application, 2017 to 2032

Table 10: Global Market Volume (Units) Forecast by Application, 2017 to 2032

Table 11: North America Market Value (US$ Million) Forecast by Country, 2017 to 2032

Table 12: North America Market Volume (Units) Forecast by Country, 2017 to 2032

Table 13: North America Market Value (US$ Million) Forecast by Type, 2017 to 2032

Table 14: North America Market Volume (Units) Forecast by Type, 2017 to 2032

Table 15: North America Market Value (US$ Million) Forecast by Technology Type, 2017 to 2032

Table 16: North America Market Volume (Units) Forecast by Technology Type, 2017 to 2032

Table 17: North America Market Value (US$ Million) Forecast by Printer Interface, 2017 to 2032

Table 18: North America Market Volume (Units) Forecast by Printer Interface, 2017 to 2032

Table 19: North America Market Value (US$ Million) Forecast by Application, 2017 to 2032

Table 20: North America Market Volume (Units) Forecast by Application, 2017 to 2032

Table 21: Latin America Market Value (US$ Million) Forecast by Country, 2017 to 2032

Table 22: Latin America Market Volume (Units) Forecast by Country, 2017 to 2032

Table 23: Latin America Market Value (US$ Million) Forecast by Type, 2017 to 2032

Table 24: Latin America Market Volume (Units) Forecast by Type, 2017 to 2032

Table 25: Latin America Market Value (US$ Million) Forecast by Technology Type, 2017 to 2032

Table 26: Latin America Market Volume (Units) Forecast by Technology Type, 2017 to 2032

Table 27: Latin America Market Value (US$ Million) Forecast by Printer Interface, 2017 to 2032

Table 28: Latin America Market Volume (Units) Forecast by Printer Interface, 2017 to 2032

Table 29: Latin America Market Value (US$ Million) Forecast by Application, 2017 to 2032

Table 30: Latin America Market Volume (Units) Forecast by Application, 2017 to 2032

Table 31: Europe Market Value (US$ Million) Forecast by Country, 2017 to 2032

Table 32: Europe Market Volume (Units) Forecast by Country, 2017 to 2032

Table 33: Europe Market Value (US$ Million) Forecast by Type, 2017 to 2032

Table 34: Europe Market Volume (Units) Forecast by Type, 2017 to 2032

Table 35: Europe Market Value (US$ Million) Forecast by Technology Type, 2017 to 2032

Table 36: Europe Market Volume (Units) Forecast by Technology Type, 2017 to 2032

Table 37: Europe Market Value (US$ Million) Forecast by Printer Interface, 2017 to 2032

Table 38: Europe Market Volume (Units) Forecast by Printer Interface, 2017 to 2032

Table 39: Europe Market Value (US$ Million) Forecast by Application, 2017 to 2032

Table 40: Europe Market Volume (Units) Forecast by Application, 2017 to 2032

Table 41: Asia Pacific Market Value (US$ Million) Forecast by Country, 2017 to 2032

Table 42: Asia Pacific Market Volume (Units) Forecast by Country, 2017 to 2032

Table 43: Asia Pacific Market Value (US$ Million) Forecast by Type, 2017 to 2032

Table 44: Asia Pacific Market Volume (Units) Forecast by Type, 2017 to 2032

Table 45: Asia Pacific Market Value (US$ Million) Forecast by Technology Type, 2017 to 2032

Table 46: Asia Pacific Market Volume (Units) Forecast by Technology Type, 2017 to 2032

Table 47: Asia Pacific Market Value (US$ Million) Forecast by Printer Interface, 2017 to 2032

Table 48: Asia Pacific Market Volume (Units) Forecast by Printer Interface, 2017 to 2032

Table 49: Asia Pacific Market Value (US$ Million) Forecast by Application, 2017 to 2032

Table 50: Asia Pacific Market Volume (Units) Forecast by Application, 2017 to 2032

Table 51: Middle East and Africa Market Value (US$ Million) Forecast by Country, 2017 to 2032

Table 52: Middle East and Africa Market Volume (Units) Forecast by Country, 2017 to 2032

Table 53: Middle East and Africa Market Value (US$ Million) Forecast by Type, 2017 to 2032

Table 54: Middle East and Africa Market Volume (Units) Forecast by Type, 2017 to 2032

Table 55: Middle East and Africa Market Value (US$ Million) Forecast by Technology Type, 2017 to 2032

Table 56: Middle East and Africa Market Volume (Units) Forecast by Technology Type, 2017 to 2032

Table 57: Middle East and Africa Market Value (US$ Million) Forecast by Printer Interface, 2017 to 2032

Table 58: Middle East and Africa Market Volume (Units) Forecast by Printer Interface, 2017 to 2032

Table 59: Middle East and Africa Market Value (US$ Million) Forecast by Application, 2017 to 2032

Table 60: Middle East and Africa Market Volume (Units) Forecast by Application, 2017 to 2032
Sudip Saha
Sudip Saha

Principal Consultant

Talk to Analyst

Find your sweet spots for generating winning opportunities in this market.

List of Charts

Figure 1: Global Market Value (US$ Million) by Type, 2022 to 2032

Figure 2: Global Market Value (US$ Million) by Technology Type, 2022 to 2032

Figure 3: Global Market Value (US$ Million) by Printer Interface, 2022 to 2032

Figure 4: Global Market Value (US$ Million) by Application, 2022 to 2032

Figure 5: Global Market Value (US$ Million) by Region, 2022 to 2032

Figure 6: Global Market Value (US$ Million) Analysis by Region, 2017 to 2032

Figure 7: Global Market Volume (Units) Analysis by Region, 2017 to 2032

Figure 8: Global Market Value Share (%) and BPS Analysis by Region, 2022 to 2032

Figure 9: Global Market Y-o-Y Growth (%) Projections by Region, 2022 to 2032

Figure 10: Global Market Value (US$ Million) Analysis by Type, 2017 to 2032

Figure 11: Global Market Volume (Units) Analysis by Type, 2017 to 2032

Figure 12: Global Market Value Share (%) and BPS Analysis by Type, 2022 to 2032

Figure 13: Global Market Y-o-Y Growth (%) Projections by Type, 2022 to 2032

Figure 14: Global Market Value (US$ Million) Analysis by Technology Type, 2017 to 2032

Figure 15: Global Market Volume (Units) Analysis by Technology Type, 2017 to 2032

Figure 16: Global Market Value Share (%) and BPS Analysis by Technology Type, 2022 to 2032

Figure 17: Global Market Y-o-Y Growth (%) Projections by Technology Type, 2022 to 2032

Figure 18: Global Market Value (US$ Million) Analysis by Printer Interface, 2017 to 2032

Figure 19: Global Market Volume (Units) Analysis by Printer Interface, 2017 to 2032

Figure 20: Global Market Value Share (%) and BPS Analysis by Printer Interface, 2022 to 2032

Figure 21: Global Market Y-o-Y Growth (%) Projections by Printer Interface, 2022 to 2032

Figure 22: Global Market Value (US$ Million) Analysis by Application, 2017 to 2032

Figure 23: Global Market Volume (Units) Analysis by Application, 2017 to 2032

Figure 24: Global Market Value Share (%) and BPS Analysis by Application, 2022 to 2032

Figure 25: Global Market Y-o-Y Growth (%) Projections by Application, 2022 to 2032

Figure 26: Global Market Attractiveness by Type, 2022 to 2032

Figure 27: Global Market Attractiveness by Technology Type, 2022 to 2032

Figure 28: Global Market Attractiveness by Printer Interface, 2022 to 2032

Figure 29: Global Market Attractiveness by Application, 2022 to 2032

Figure 30: Global Market Attractiveness by Region, 2022 to 2032

Figure 31: North America Market Value (US$ Million) by Type, 2022 to 2032

Figure 32: North America Market Value (US$ Million) by Technology Type, 2022 to 2032

Figure 33: North America Market Value (US$ Million) by Printer Interface, 2022 to 2032

Figure 34: North America Market Value (US$ Million) by Application, 2022 to 2032

Figure 35: North America Market Value (US$ Million) by Country, 2022 to 2032

Figure 36: North America Market Value (US$ Million) Analysis by Country, 2017 to 2032

Figure 37: North America Market Volume (Units) Analysis by Country, 2017 to 2032

Figure 38: North America Market Value Share (%) and BPS Analysis by Country, 2022 to 2032

Figure 39: North America Market Y-o-Y Growth (%) Projections by Country, 2022 to 2032

Figure 40: North America Market Value (US$ Million) Analysis by Type, 2017 to 2032

Figure 41: North America Market Volume (Units) Analysis by Type, 2017 to 2032

Figure 42: North America Market Value Share (%) and BPS Analysis by Type, 2022 to 2032

Figure 43: North America Market Y-o-Y Growth (%) Projections by Type, 2022 to 2032

Figure 44: North America Market Value (US$ Million) Analysis by Technology Type, 2017 to 2032

Figure 45: North America Market Volume (Units) Analysis by Technology Type, 2017 to 2032

Figure 46: North America Market Value Share (%) and BPS Analysis by Technology Type, 2022 to 2032

Figure 47: North America Market Y-o-Y Growth (%) Projections by Technology Type, 2022 to 2032

Figure 48: North America Market Value (US$ Million) Analysis by Printer Interface, 2017 to 2032

Figure 49: North America Market Volume (Units) Analysis by Printer Interface, 2017 to 2032

Figure 50: North America Market Value Share (%) and BPS Analysis by Printer Interface, 2022 to 2032

Figure 51: North America Market Y-o-Y Growth (%) Projections by Printer Interface, 2022 to 2032

Figure 52: North America Market Value (US$ Million) Analysis by Application, 2017 to 2032

Figure 53: North America Market Volume (Units) Analysis by Application, 2017 to 2032

Figure 54: North America Market Value Share (%) and BPS Analysis by Application, 2022 to 2032

Figure 55: North America Market Y-o-Y Growth (%) Projections by Application, 2022 to 2032

Figure 56: North America Market Attractiveness by Type, 2022 to 2032

Figure 57: North America Market Attractiveness by Technology Type, 2022 to 2032

Figure 58: North America Market Attractiveness by Printer Interface, 2022 to 2032

Figure 59: North America Market Attractiveness by Application, 2022 to 2032

Figure 60: North America Market Attractiveness by Country, 2022 to 2032

Figure 61: Latin America Market Value (US$ Million) by Type, 2022 to 2032

Figure 62: Latin America Market Value (US$ Million) by Technology Type, 2022 to 2032

Figure 63: Latin America Market Value (US$ Million) by Printer Interface, 2022 to 2032

Figure 64: Latin America Market Value (US$ Million) by Application, 2022 to 2032

Figure 65: Latin America Market Value (US$ Million) by Country, 2022 to 2032

Figure 66: Latin America Market Value (US$ Million) Analysis by Country, 2017 to 2032

Figure 67: Latin America Market Volume (Units) Analysis by Country, 2017 to 2032

Figure 68: Latin America Market Value Share (%) and BPS Analysis by Country, 2022 to 2032

Figure 69: Latin America Market Y-o-Y Growth (%) Projections by Country, 2022 to 2032

Figure 70: Latin America Market Value (US$ Million) Analysis by Type, 2017 to 2032

Figure 71: Latin America Market Volume (Units) Analysis by Type, 2017 to 2032

Figure 72: Latin America Market Value Share (%) and BPS Analysis by Type, 2022 to 2032

Figure 73: Latin America Market Y-o-Y Growth (%) Projections by Type, 2022 to 2032

Figure 74: Latin America Market Value (US$ Million) Analysis by Technology Type, 2017 to 2032

Figure 75: Latin America Market Volume (Units) Analysis by Technology Type, 2017 to 2032

Figure 76: Latin America Market Value Share (%) and BPS Analysis by Technology Type, 2022 to 2032

Figure 77: Latin America Market Y-o-Y Growth (%) Projections by Technology Type, 2022 to 2032

Figure 78: Latin America Market Value (US$ Million) Analysis by Printer Interface, 2017 to 2032

Figure 79: Latin America Market Volume (Units) Analysis by Printer Interface, 2017 to 2032

Figure 80: Latin America Market Value Share (%) and BPS Analysis by Printer Interface, 2022 to 2032

Figure 81: Latin America Market Y-o-Y Growth (%) Projections by Printer Interface, 2022 to 2032

Figure 82: Latin America Market Value (US$ Million) Analysis by Application, 2017 to 2032

Figure 83: Latin America Market Volume (Units) Analysis by Application, 2017 to 2032

Figure 84: Latin America Market Value Share (%) and BPS Analysis by Application, 2022 to 2032

Figure 85: Latin America Market Y-o-Y Growth (%) Projections by Application, 2022 to 2032

Figure 86: Latin America Market Attractiveness by Type, 2022 to 2032

Figure 87: Latin America Market Attractiveness by Technology Type, 2022 to 2032

Figure 88: Latin America Market Attractiveness by Printer Interface, 2022 to 2032

Figure 89: Latin America Market Attractiveness by Application, 2022 to 2032

Figure 90: Latin America Market Attractiveness by Country, 2022 to 2032

Figure 91: Europe Market Value (US$ Million) by Type, 2022 to 2032

Figure 92: Europe Market Value (US$ Million) by Technology Type, 2022 to 2032

Figure 93: Europe Market Value (US$ Million) by Printer Interface, 2022 to 2032

Figure 94: Europe Market Value (US$ Million) by Application, 2022 to 2032

Figure 95: Europe Market Value (US$ Million) by Country, 2022 to 2032

Figure 96: Europe Market Value (US$ Million) Analysis by Country, 2017 to 2032

Figure 97: Europe Market Volume (Units) Analysis by Country, 2017 to 2032

Figure 98: Europe Market Value Share (%) and BPS Analysis by Country, 2022 to 2032

Figure 99: Europe Market Y-o-Y Growth (%) Projections by Country, 2022 to 2032

Figure 100: Europe Market Value (US$ Million) Analysis by Type, 2017 to 2032

Figure 101: Europe Market Volume (Units) Analysis by Type, 2017 to 2032

Figure 102: Europe Market Value Share (%) and BPS Analysis by Type, 2022 to 2032

Figure 103: Europe Market Y-o-Y Growth (%) Projections by Type, 2022 to 2032

Figure 104: Europe Market Value (US$ Million) Analysis by Technology Type, 2017 to 2032

Figure 105: Europe Market Volume (Units) Analysis by Technology Type, 2017 to 2032

Figure 106: Europe Market Value Share (%) and BPS Analysis by Technology Type, 2022 to 2032

Figure 107: Europe Market Y-o-Y Growth (%) Projections by Technology Type, 2022 to 2032

Figure 108: Europe Market Value (US$ Million) Analysis by Printer Interface, 2017 to 2032

Figure 109: Europe Market Volume (Units) Analysis by Printer Interface, 2017 to 2032

Figure 110: Europe Market Value Share (%) and BPS Analysis by Printer Interface, 2022 to 2032

Figure 111: Europe Market Y-o-Y Growth (%) Projections by Printer Interface, 2022 to 2032

Figure 112: Europe Market Value (US$ Million) Analysis by Application, 2017 to 2032

Figure 113: Europe Market Volume (Units) Analysis by Application, 2017 to 2032

Figure 114: Europe Market Value Share (%) and BPS Analysis by Application, 2022 to 2032

Figure 115: Europe Market Y-o-Y Growth (%) Projections by Application, 2022 to 2032

Figure 116: Europe Market Attractiveness by Type, 2022 to 2032

Figure 117: Europe Market Attractiveness by Technology Type, 2022 to 2032

Figure 118: Europe Market Attractiveness by Printer Interface, 2022 to 2032

Figure 119: Europe Market Attractiveness by Application, 2022 to 2032

Figure 120: Europe Market Attractiveness by Country, 2022 to 2032

Figure 121: Asia Pacific Market Value (US$ Million) by Type, 2022 to 2032

Figure 122: Asia Pacific Market Value (US$ Million) by Technology Type, 2022 to 2032

Figure 123: Asia Pacific Market Value (US$ Million) by Printer Interface, 2022 to 2032

Figure 124: Asia Pacific Market Value (US$ Million) by Application, 2022 to 2032

Figure 125: Asia Pacific Market Value (US$ Million) by Country, 2022 to 2032

Figure 126: Asia Pacific Market Value (US$ Million) Analysis by Country, 2017 to 2032

Figure 127: Asia Pacific Market Volume (Units) Analysis by Country, 2017 to 2032

Figure 128: Asia Pacific Market Value Share (%) and BPS Analysis by Country, 2022 to 2032

Figure 129: Asia Pacific Market Y-o-Y Growth (%) Projections by Country, 2022 to 2032

Figure 130: Asia Pacific Market Value (US$ Million) Analysis by Type, 2017 to 2032

Figure 131: Asia Pacific Market Volume (Units) Analysis by Type, 2017 to 2032

Figure 132: Asia Pacific Market Value Share (%) and BPS Analysis by Type, 2022 to 2032

Figure 133: Asia Pacific Market Y-o-Y Growth (%) Projections by Type, 2022 to 2032

Figure 134: Asia Pacific Market Value (US$ Million) Analysis by Technology Type, 2017 to 2032

Figure 135: Asia Pacific Market Volume (Units) Analysis by Technology Type, 2017 to 2032

Figure 136: Asia Pacific Market Value Share (%) and BPS Analysis by Technology Type, 2022 to 2032

Figure 137: Asia Pacific Market Y-o-Y Growth (%) Projections by Technology Type, 2022 to 2032

Figure 138: Asia Pacific Market Value (US$ Million) Analysis by Printer Interface, 2017 to 2032

Figure 139: Asia Pacific Market Volume (Units) Analysis by Printer Interface, 2017 to 2032

Figure 140: Asia Pacific Market Value Share (%) and BPS Analysis by Printer Interface, 2022 to 2032

Figure 141: Asia Pacific Market Y-o-Y Growth (%) Projections by Printer Interface, 2022 to 2032

Figure 142: Asia Pacific Market Value (US$ Million) Analysis by Application, 2017 to 2032

Figure 143: Asia Pacific Market Volume (Units) Analysis by Application, 2017 to 2032

Figure 144: Asia Pacific Market Value Share (%) and BPS Analysis by Application, 2022 to 2032

Figure 145: Asia Pacific Market Y-o-Y Growth (%) Projections by Application, 2022 to 2032

Figure 146: Asia Pacific Market Attractiveness by Type, 2022 to 2032

Figure 147: Asia Pacific Market Attractiveness by Technology Type, 2022 to 2032

Figure 148: Asia Pacific Market Attractiveness by Printer Interface, 2022 to 2032

Figure 149: Asia Pacific Market Attractiveness by Application, 2022 to 2032

Figure 150: Asia Pacific Market Attractiveness by Country, 2022 to 2032

Figure 151: Middle East and Africa Market Value (US$ Million) by Type, 2022 to 2032

Figure 152: Middle East and Africa Market Value (US$ Million) by Technology Type, 2022 to 2032

Figure 153: Middle East and Africa Market Value (US$ Million) by Printer Interface, 2022 to 2032

Figure 154: Middle East and Africa Market Value (US$ Million) by Application, 2022 to 2032

Figure 155: Middle East and Africa Market Value (US$ Million) by Country, 2022 to 2032

Figure 156: Middle East and Africa Market Value (US$ Million) Analysis by Country, 2017 to 2032

Figure 157: Middle East and Africa Market Volume (Units) Analysis by Country, 2017 to 2032

Figure 158: Middle East and Africa Market Value Share (%) and BPS Analysis by Country, 2022 to 2032

Figure 159: Middle East and Africa Market Y-o-Y Growth (%) Projections by Country, 2022 to 2032

Figure 160: Middle East and Africa Market Value (US$ Million) Analysis by Type, 2017 to 2032

Figure 161: Middle East and Africa Market Volume (Units) Analysis by Type, 2017 to 2032

Figure 162: Middle East and Africa Market Value Share (%) and BPS Analysis by Type, 2022 to 2032

Figure 163: Middle East and Africa Market Y-o-Y Growth (%) Projections by Type, 2022 to 2032

Figure 164: Middle East and Africa Market Value (US$ Million) Analysis by Technology Type, 2017 to 2032

Figure 165: Middle East and Africa Market Volume (Units) Analysis by Technology Type, 2017 to 2032

Figure 166: Middle East and Africa Market Value Share (%) and BPS Analysis by Technology Type, 2022 to 2032

Figure 167: Middle East and Africa Market Y-o-Y Growth (%) Projections by Technology Type, 2022 to 2032

Figure 168: Middle East and Africa Market Value (US$ Million) Analysis by Printer Interface, 2017 to 2032

Figure 169: Middle East and Africa Market Volume (Units) Analysis by Printer Interface, 2017 to 2032

Figure 170: Middle East and Africa Market Value Share (%) and BPS Analysis by Printer Interface, 2022 to 2032

Figure 171: Middle East and Africa Market Y-o-Y Growth (%) Projections by Printer Interface, 2022 to 2032

Figure 172: Middle East and Africa Market Value (US$ Million) Analysis by Application, 2017 to 2032

Figure 173: Middle East and Africa Market Volume (Units) Analysis by Application, 2017 to 2032

Figure 174: Middle East and Africa Market Value Share (%) and BPS Analysis by Application, 2022 to 2032

Figure 175: Middle East and Africa Market Y-o-Y Growth (%) Projections by Application, 2022 to 2032

Figure 176: Middle East and Africa Market Attractiveness by Type, 2022 to 2032

Figure 177: Middle East and Africa Market Attractiveness by Technology Type, 2022 to 2032

Figure 178: Middle East and Africa Market Attractiveness by Printer Interface, 2022 to 2032

Figure 179: Middle East and Africa Market Attractiveness by Application, 2022 to 2032

Figure 180: Middle East and Africa Market Attractiveness by Country, 2022 to 2032

Recommendations

Technology

Portable Printer Market

Published : October 2022

Explore Technology Insights

View Reports

Commercial Printer Market