Methodology

Public Transportation Full Payment Platform Market Forecast and Outlook 2025 to 2035

The public transportation full payment platform market grows from USD 1.1 billion in 2025 to USD 2.3 billion by 2035 at a CAGR of 7.8%, with regional behavior shaped by transit-digitalization cycles, multimodal expansion, and rapid movement toward account-based and open-loop fare systems. Asia Pacific represents the strongest growth territory as China and India accelerate metro construction, bus fleet upgrades, and QR–NFC fare deployments. China’s 10.5% CAGR reflects nationwide smart-city mandates, while India’s 9.7% CAGR is driven by UPI-integrated mobility payments and expanding metro corridors. Transit agencies in this region prioritize cloud-clearing engines, real-time validation, and interoperability across multi-operator mobility ecosystems, creating persistent opportunity for platform providers. Europe maintains steady expansion through replacements of legacy validators, expansion of pay-as-you-go frameworks, and broader EMV open-loop acceptance across rail, metro, and tram networks. Markets such as Germany (9% CAGR) and the UK (6.6% CAGR) emphasize secure clearing protocols, seamless multimodal transfers, and integration with national transport unions. The region’s structured regulatory environment accelerates upgrades toward unified account-based platforms that accommodate high-density commuter flow.

North America continues advancing through modernization of bus and rail systems, rising mobile-ticket adoption, and broader implementation of low-latency validation infrastructure. The USA (7.4% CAGR) adopts cloud-based fare engines, regional multimodal accounts, and contactless frameworks that reduce dwell times and enhance commuter throughput. Latin America and Middle East & Africa record gradual expansion, led by Brazil (8.2% CAGR) where metro extensions and bus rapid transit networks increase platform demand. Japan’s 5.8% CAGR reflects ongoing refinement rather than major system overhaul, with IC-card ecosystems and high-speed gate systems anchoring stable growth across dense rail corridors.

Quick Stats for Public Transportation Full Payment Platform Market

  • Public Transportation Full Payment Platform Market Value (2025): USD 1.1 billion
  • Public Transportation Full Payment Platform Market Forecast Value (2035): USD 2.3 billion
  • Public Transportation Full Payment Platform Market Forecast CAGR (2025–2035): 7.8%
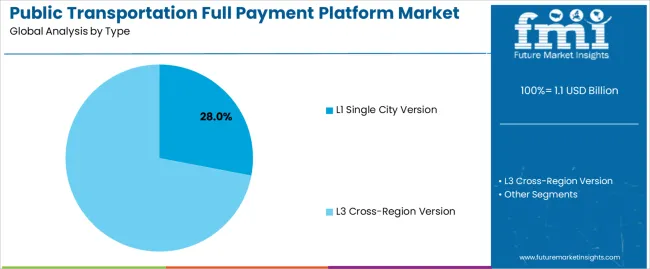
  • Public Transportation Full Payment Platform Market Leading Type (2025): L1 single city version (28.0% share)
  • Public Transportation Full Payment Platform Market Key Growth Regions: Asia Pacific, Europe, North America.
  • Public Transportation Full Payment Platform Market Players: Xiamen Lenz Communication; Magnetic North; Vcomcn; Guangdong Telpo; Shenzhen Emperor Technology; Beijing Watchdata; Hangzhou GOLONG Technology; Shenzhen Genvict Technologies; Cashway Fintech; USI Global; Xiamen Lanhe Electronics; Tianjin Public Transport Yitong Technology.

Public Transportation Full Payment Platform Market Market Value Analysis

Asia Pacific shows the fastest expansion due to large-scale smart city programs and increased investments in urban transport modernization. Europe and North America maintain steady growth through upgrades to existing fare systems and broader use of bank card and mobile wallet payments. By 2035, improvements in digital authentication, cloud-based fare management, and cross-operator integration are expected to shape the continued evolution of full payment platforms in public transportation networks worldwide.

What is the Growth Forecast for the Public Transportation Full Payment Platform Market through 2035?

Between 2025 and 2030, the Public Transportation Full Payment Platform Market is projected to grow from USD 1.1 billion to USD 1.5 billion, with user transaction volume rising from approximately 1.1 billion to 1.5 billion active payment events annually. The growth volatility index (GVI) for this period is 1.2, indicating a strong acceleration phase driven by rapid urban mobility expansion, higher adoption of contactless smart cards, QR-based ticketing, and mobile-wallet-integrated fare systems. Demand growth is linked to system requirements such as sub-200 ms payment authentication speeds, over 99.9 % uptime, multi-modal interoperability, and backend clearing systems capable of processing millions of daily transactions. Asia-Pacific, Europe, and Middle Eastern metro corridors are expected to generate more than 60 % of incremental usage due to aggressive digital fare modernization initiatives.

From 2030 to 2035, the market is expected to rise from USD 1.5 billion to USD 2.3 billion, with annual transaction volume reaching approximately 2.1–2.3 billion validated fares. The GVI for this second period moderates to 0.9, reflecting a gradual deceleration as deployment shifts toward standardized upgrades, account-based ticketing replacement cycles, and network-wide integration rather than new system rollouts. Growth momentum will be shaped by wider implementation of EMV open-loop systems, advanced fraud-prevention analytics, and cloud-based clearing engines capable of real-time fare calculation across trains, buses, metros, trams, and micro-mobility fleets. Regional platform expansion in South Asia, Southeast Asia, and Latin America is expected to contribute 12–14 % of global market growth by 2035.

Public Transportation Full Payment Platform Market Key Takeaways

Metric Value
Market Value (2025) USD 1.1 billion
Market Forecast Value (2035) USD 2.3 billion
Forecast CAGR (2025 to 2035) 7.8%

Why Is the Public Transportation Full Payment Platform Market Growing Across Urban Mobility Networks?

Demand for full payment platforms in public transportation is rising as cities modernize fare collection to reduce cash handling, improve boarding efficiency, and support multimodal mobility. These platforms integrate contactless cards, mobile wallets, QR codes, and account-based ticketing into a unified transaction framework that enables passengers to move across buses, metros, and shared mobility systems without separate tickets. Transit agencies prioritize systems that automate fare calculation, support peak-hour throughput, and limit revenue leakage through real-time validation. Manufacturers enhance back-office engines that reconcile transactions, manage payment risk, and provide audit-ready reporting. Growth is strongest in regions upgrading aging fare infrastructure, where operators require interoperable systems that align with open-loop payment standards and regional transportation policies.

Market expansion is also supported by higher passenger expectations for seamless travel and broader adoption of digital financial services. Payment-platform providers introduce encrypted communication, offline validation modules, and centralized rules engines to maintain continuity in low-connectivity environments. Agencies integrate these platforms with passenger-information systems and fleet-management tools to improve network planning and operational transparency. Data analytics capabilities allow authorities to track ridership patterns, optimize resource allocation, and refine pricing strategies. Although procurement costs and cybersecurity requirements challenge smaller operators, long-term efficiency benefits-including reduced cash logistics, shorter dwell times, and more flexible fare policy implementation-continue to drive adoption. These factors position full payment platforms as core components of modern, digitally coordinated public transport networks.

How Do Platform Versions and Transit Usage Needs Shape Segmentation in the Public Transportation Full Payment Platform Market?

The public transportation full payment platform market is segmented by type, application, and region. By type, the market is divided into the L1 single city version and the L3 cross-region version. Based on application, it is categorized into urban transportation, shuttle bus attendance, and others. Regionally, the market is segmented into North America, Europe, East Asia, South Asia, Latin America, and the Middle East & Africa. These divisions reflect differences in system integration complexity, mobility patterns, and regional investment in digital fare settlement infrastructure.
What Drives the Leading Position of the L1 Single City Version in Digital Transit Payment Adoption?

Public Transportation Full Payment Platform Market Analysis By Type

The L1 single city version segment accounts for approximately 28.0% of the global public transportation full payment platform market in 2025, making it the leading type category. This position is supported by the widespread deployment of city-level digital ticketing systems designed for buses, metros, and trams operating within a single municipal boundary. L1 platforms provide stable fare clearing, real-time transaction verification, and integration with local transit cards or mobile payment tools, meeting the needs of cities with established transportation networks.

These systems offer predictable operational costs, faster implementation timelines, and straightforward coordination with city authorities and municipal operators. Adoption is strongest in urban regions of East Asia and Europe, where fully digital fare ecosystems have been introduced to improve passenger flow and reduce reliance on manual ticketing. Providers focus on strengthening back-end clearing capabilities, enhancing transaction security, and supporting multimodal transfers within city limits. The L1 single city version segment maintains its leadership through its alignment with localized mobility patterns, compatibility with municipal regulatory structures, and suitability for cities seeking stable digital payment modernization without cross-regional coordination complexity.
Why Does Urban Transportation Represent the Largest Application Share in the Full Payment Platform Market?

Public Transportation Full Payment Platform Market Analysis By Application

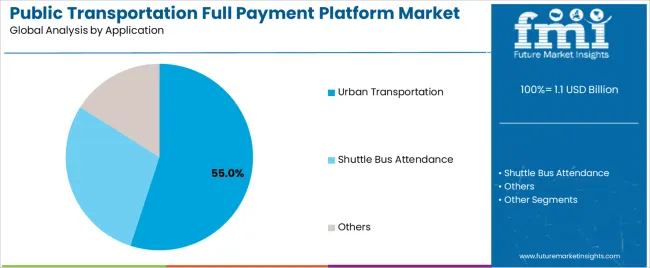
The urban transportation segment represents about 55.0% of the total public transportation full payment platform market in 2025, making it the dominant application category. Its leadership reflects the high daily transaction volume associated with city buses, metro systems, and trams that rely on efficient electronic payment processing. Urban networks generate consistent fare activity, requiring platforms that support rapid validation, congestion-free passenger movement, and accurate revenue settlement for multiple operators.

Growth in this segment is reinforced by expanding urban populations, increased commuter dependence on public transit, and ongoing transition away from cash-based fare systems. Cities across North America, Europe, and East Asia continue upgrading payment platforms to support contactless cards, QR codes, and mobile wallets, all of which rely on stable back-end settlement frameworks. Providers develop systems with improved data analytics, user-management modules, and interoperable architectures that accommodate diverse ticketing rules across different city routes. The urban transportation segment remains the primary demand driver because metropolitan transit networks require scalable, reliable, and continuously available payment systems to support daily passenger flow and operational efficiency.

What are the Key Trends, Drivers, and Restraints in the Public Transportation Full Payment Platform Market?

The public transportation full payment platform market is expanding as transit authorities seek unified systems that handle fare collection, digital ticketing, contactless payments and account-based travel. These platforms integrate mobile wallets, smartcards and QR codes, enabling smoother passenger flows and reduced cash handling. Growth is supported by rising urban mobility, multimodal transport networks and the shift toward digital fare management. Adoption is limited by legacy infrastructure, high integration costs and varied regional regulatory frameworks. Providers are developing interoperable, cloud-based platforms that improve reliability, reduce fraud risk and support multiple payment methods across buses, rail and metro systems.

How are urbanisation and multimodal mobility trends driving adoption of full payment platforms?

Demand is rising as cities introduce more interconnected transport services and aim to simplify fare structures for daily commuters. Unified payment platforms allow riders to move across buses, metro lines and regional rail using a single payment method or travel account. Increased smartphone adoption also supports mobile ticketing, reducing queues and improving fare compliance. Transit authorities seeking operational efficiency favour platforms that automate validation, support real-time data tracking and streamline passenger experience, strengthening momentum for integrated payment ecosystems.

What factors are limiting broader implementation of full payment platforms in public transit?

Adoption faces obstacles such as the high cost of upgrading legacy fare systems, integrating new software with existing gates and validators, and maintaining data security. Smaller cities or financially constrained agencies may postpone transition due to limited budgets or competing infrastructure priorities. Regulatory differences across regions complicate cross-border or inter-agency interoperability. Some passenger groups still rely on cash transactions, requiring dual systems that increase operational complexity. These factors slow complete migration to digital, account-based fare environments.

What trends are shaping the next generation of public transit payment platforms?

Key trends include contactless open-loop payments using bank cards and mobile wallets, cloud-based fare processing, and platforms supporting distance-based and time-based pricing. Transit operators are adopting modular systems that allow phased implementation and integration across multiple agencies. Real-time analytics for passenger flow, fraud detection and service planning are becoming standard features. Interest is also rising in mobility-as-a-service ecosystems that combine public transit with e-bikes, taxis and carshare within unified payment apps. Growth in emerging markets is driven by digital infrastructure improvements and expanding urban transport networks.

What is the Analysis of the Public Transportation Full Payment Platform Market by Key Country?

Public Transportation Full Payment Platform Market Cagr Analysis By Country

Country CAGR (%)
China 10.5%
India 9.7%
Germany 9%
Brazil 8.2%
USA 7.4%
UK 6.6%
Japan 5.8%

The public transportation full payment platform market is growing rapidly worldwide, with China leading at a 10.5% CAGR through 2035, propelled by nationwide digital fare systems, QR–NFC payment integration, and smart city expansion. India follows at 9.7%, driven by rapid urban transit upgrades, UPI-enabled mobility payments, and increasing adoption of automated fare collection. Germany records 9%, supported by strong public transport networks, interoperable ticketing, and EU-backed mobility digitalization. Brazil grows at 8.2%, benefiting from modernization of urban bus and metro systems and increased demand for contactless payment options. The USA, at 7.4%, emphasizes multi-modal integration and mobile-based ticketing innovations, while the UK (6.6%) and Japan (5.8%) continue enhancing seamless commuter experiences through advanced transit payment ecosystems, security upgrades, and multimodal interoperability.

How Is Transit-Digitalization Growth Supporting Market Expansion in China?

China is showing strong momentum in the public transportation full payment platform market, projected to grow at a CAGR of 10.5% through 2035. Expansion of metro systems, bus fleets, and multimodal networks is increasing demand for integrated payment solutions. Providers refine QR-based validation, card-interoperability frameworks, and cloud-settlement tools. Broader adoption of mobile wallets across major cities supports seamless fare processing. Transport authorities continue improving unified payment interfaces to support large passenger volumes and intercity movement.

  • Metro expansion drives platform usage.
  • Mobile wallets broaden transaction flow.
  • Interoperable cards increase network reach.
  • Unified interfaces support high ridership.

Why Is Digital Fare Adoption Strengthening Market Activity in India?

India is observing firm development in the public transportation full payment platform market, advancing at a CAGR of 9.7% through 2035. Growth in metro corridors, bus rapid transit routes, and suburban rail upgrades encourages integration of unified payment systems. Providers enhance smart-card architecture, app-based ticketing, and real-time fare validation. Wider use of digital payments across urban centers reinforces adoption. National mobility programs promote interoperable payment networks supporting multimodal travel across expanding city-regions.
  • App-based ticketing increases usage.
  • Smart-card upgrades improve reliability.
  • Metro corridor growth raises demand.
  • National mobility plans guide integration.

How Do Engineering and Regulatory Standards Shape Market Progress in Germany?

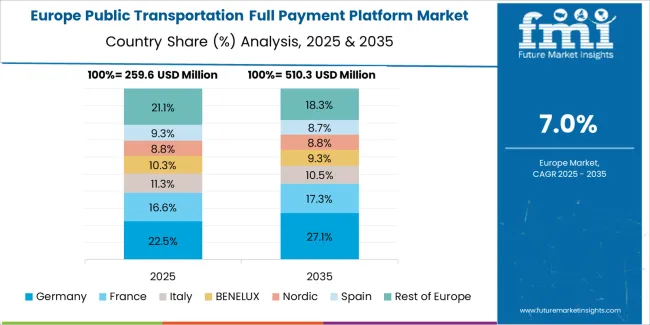
Public Transportation Full Payment Platform Market Europe Country Market Share Analysis, 2025 & 2035

Across Germany, the public transportation full payment platform market is moving forward at a CAGR of 9%, supported by structured transit networks and regulated payment frameworks. Providers focus on contactless validation accuracy, secure settlement protocols, and cross-operator interoperability. Growth in regional transport unions encourages unified fare-processing systems. Increased emphasis on digital ticketing across rail and bus services reinforces steady platform deployment.

  • Contactless systems support faster boarding.
  • Secure protocols ensure stable transactions.
  • Regional unions promote unified platforms.
  • Rail networks expand digital validation.

Why Is Transportation Modernization Encouraging Market Growth in Brazil?

Brazil is showing stable advancement in the public transportation full payment platform market, expected to rise at a CAGR of 8.2% through 2035. Bus system upgrades, growing metro networks, and rising digital-payment acceptance contribute to platform deployment. Local providers work with international firms to strengthen transaction accuracy and reduce settlement delays. Increased use of contactless cards and mobile apps supports wider adoption across large cities.
  • Bus network upgrades increase platform use.
  • Contactless cards improve convenience.
  • Provider partnerships enhance system reliability.
  • Metro development broadens payment integration.

How Is Digital-Fare Expansion Advancing Market Demand in the United States?

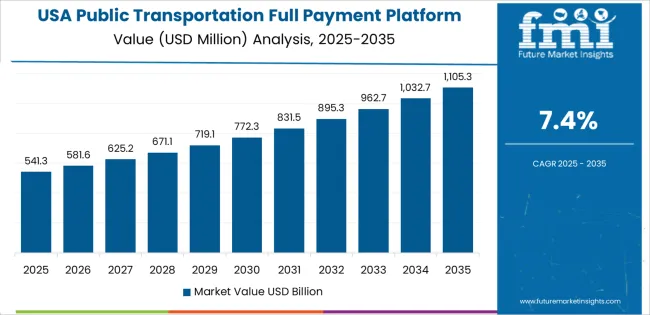
Public Transportation Full Payment Platform Market Country Value Analysis

In the United States, the public transportation full payment platform market is expanding at a CAGR of 7.4% through 2035. Transit agencies integrate contactless cards, mobile tickets, and account-based payment systems to streamline rider movement. Providers refine security layers, clearing mechanisms, and multimodal account management. Growth in regional transit networks and renewed infrastructure investment supports adoption. Broader acceptance of digital payments among commuters reinforces continuous platform upgrades.

  • Account-based systems improve flexibility.
  • Security refinements strengthen transactions.
  • Infrastructure funding expands installations.
  • Contactless adoption boosts ridership efficiency.

Why Is Market Activity Rising in the United Kingdom?

Across the United Kingdom, the public transportation full payment platform market is recording growth at a CAGR of 6.6% through 2035. Expansion of contactless fare systems across rail, bus, and metro lines encourages consistent usage. Providers focus on real-time clearing, bank-card interoperability, and mobile-wallet integration. Wider implementation of pay-as-you-go frameworks enhances passenger convenience. Regional transport authorities continue integrating unified fare models across broader routes.

  • Pay-as-you-go increases platform adoption.
  • Bank-card interoperability improves access.
  • Real-time clearing enhances system stability.
  • Regional integration broadens usage.

How Does System Refinement Maintain Market Stability in Japan?

Public Transportation Full Payment Platform Market Japan Market Share Analysis By Type

Japan is experiencing measured progress in the public transportation full payment platform market, expected to grow at a CAGR of 5.8% through 2035. Rail-dominant mobility patterns and high commuter density support ongoing use of digital fare solutions. Providers improve IC-card performance, mobile-ticket reliability, and station-gate validation speed. Expansion of multimodal links strengthens unified payment networks. Increased interest in streamlined passenger flow reinforces platform upgrades across major cities.

  • IC cards remain central to fare processing.
  • Gate-speed improvements support crowd management.
  • Multimodal links broaden network connectivity.
  • Mobile tickets enhance daily convenience.

How Competitive Is the Global Public Transportation Full Payment Platform Market and What Defines Its Strategic Landscape?

Public Transportation Full Payment Platform Market Analysis By Company

The global public transportation full payment platform market is moderately fragmented, led by companies supplying integrated fare-collection systems, smart terminals, and cloud-based clearing solutions. Xiamen Lenz Communication holds a strong position with large deployments across bus and metro networks, offering unified payment acceptance supporting cards, QR codes, and mobile wallets. Magnetic North and Vcomcn provide comprehensive back-end clearing platforms and terminal systems tailored to urban transit authorities.

Guangdong Telpo and Shenzhen Emperor Technology contribute wide product portfolios that combine on-board validators, handheld inspection devices, and ticketing software. Beijing Watchdata and Hangzhou GOLONG Technology strengthen their presence through secure payment modules and IC card technologies aligned with municipal transit standards.

Shenzhen Genvict Technologies expands competitiveness with ETC-integrated solutions bridging road tolling and public transport payments. Cashway Fintech and USI Global support the market with full fare-collection hardware and settlement platforms designed for multi-operator networks. Xiamen Lanhe Electronics and Tianjin Public Transport Yitong Technology provide regional solutions optimized for bus fleets and emerging smart-city ecosystems. Competition is shaped by transaction security, validator durability, and system integration with transit scheduling platforms.

Strategic differentiation depends on interoperability, cloud-based clearing efficiency, and support for multimodal payment schemes. As cities adopt real-time fare management and open-loop payment frameworks, suppliers offering scalable, low-latency platforms and long-term software support will strengthen their global position.

Key Players in the Public Transportation Full Payment Platform Market

  • Xiamen Lenz Communication
  • Magnetic North
  • Vcomcn
  • Guangdong Telpo
  • Shenzhen Emperor Technology
  • Beijing Watchdata
  • Hangzhou GOLONG Technology
  • Shenzhen Genvict Technologies
  • Cashway Fintech
  • USI Global
  • Xiamen Lanhe Electronics
  • Tianjin Public Transport Yitong Technology

Report Scope for Public Transportation Full Payment Platform Market

Items Values
Quantitative Units (2025) USD billion
Type L1 Single City Version, L3 Cross-Region Version
Application Urban Transportation, Shuttle Bus Attendance, Others
Regions Covered East Asia, Europe, North America, South Asia, Latin America, Middle East & Africa, Eastern Europe
Countries Covered China, India, Germany, Brazil, USA, UK, Japan, and 40+ additional countries
Key Companies Profiled Xiamen Lenz Communication, Magnetic North, Vcomcn, Guangdong Telpo, Shenzhen Emperor Technology, Beijing Watchdata, Hangzhou GOLONG Technology, Shenzhen Genvict Technologies, Cashway Fintech, USI Global, Xiamen Lanhe Electronics, Tianjin Public Transport Yitong Technology
Additional Attributes Digital fare-system integration, open-loop and account-based ticketing, multimodal interoperability, transaction clearing infrastructure, real-time validation, cybersecurity frameworks, cloud-based settlement, adoption trends across East Asia, Europe, and North America, hardware–software integration requirements for validators and backend engines

Public Transportation Full Payment Platform Market Segmentation

Type:

  • L1 Single City Version
  • L3 Cross-Region Version

Application:

  • Urban Transportation
  • Shuttle Bus Attendance
  • Others

Region:

  • East Asia
    • China
    • Japan
    • South Korea
    • Taiwan
    • Rest of East Asia
  • Europe
    • Germany
    • UK
    • France
    • Italy
    • Spain
    • Switzerland
    • Nordic
    • BENELUX
    • Rest of Europe
  • North America
    • USA
    • Canada
    • Mexico
  • South Asia
    • India
    • Pakistan
    • Bangladesh
    • Rest of South Asia
  • Latin America
    • Brazil
    • Argentina
    • Chile
    • Rest of Latin America
  • Middle East & Africa
    • Kingdom of Saudi Arabia
    • Other GCC Countries
    • Turkey
    • South Africa
    • Other African Union
    • Rest of Middle East & Africa
  • Eastern Europe
    • Russia
    • Poland
    • Czech Republic
    • Rest of Eastern Europe

Frequently Asked Questions

How big is the public transportation full payment platform market in 2025?

The global public transportation full payment platform market is estimated to be valued at USD 1.1 billion in 2025.

What will be the size of public transportation full payment platform market in 2035?

The market size for the public transportation full payment platform market is projected to reach USD 2.3 billion by 2035.

How much will be the public transportation full payment platform market growth between 2025 and 2035?

The public transportation full payment platform market is expected to grow at a 7.8% CAGR between 2025 and 2035.

What are the key product types in the public transportation full payment platform market?

The key product types in public transportation full payment platform market are l1 single city version and l3 cross-region version.

Which application segment to contribute significant share in the public transportation full payment platform market in 2025?

In terms of application, urban transportation segment to command 55.0% share in the public transportation full payment platform market in 2025.

Table of Content

  1. Executive Summary
    • Global Market Outlook
    • Demand to side Trends
    • Supply to side Trends
    • Technology Roadmap Analysis
    • Analysis and Recommendations
  2. Market Overview
    • Market Coverage / Taxonomy
    • Market Definition / Scope / Limitations
  3. Market Background
    • Market Dynamics
      • Drivers
      • Restraints
      • Opportunity
      • Trends
    • Scenario Forecast
      • Demand in Optimistic Scenario
      • Demand in Likely Scenario
      • Demand in Conservative Scenario
    • Opportunity Map Analysis
    • Product Life Cycle Analysis
    • Supply Chain Analysis
    • Investment Feasibility Matrix
    • Value Chain Analysis
    • PESTLE and Porter’s Analysis
    • Regulatory Landscape
    • Regional Parent Market Outlook
    • Production and Consumption Statistics
    • Import and Export Statistics
  4. Global Market Analysis 2020 to 2024 and Forecast, 2025 to 2035
    • Historical Market Size Value (USD Million) Analysis, 2020 to 2024
    • Current and Future Market Size Value (USD Million) Projections, 2025 to 2035
      • Y to o to Y Growth Trend Analysis
      • Absolute $ Opportunity Analysis
  5. Global Market Pricing Analysis 2020 to 2024 and Forecast 2025 to 2035
  6. Global Market Analysis 2020 to 2024 and Forecast 2025 to 2035, By Type
    • Introduction / Key Findings
    • Historical Market Size Value (USD Million) Analysis By Type , 2020 to 2024
    • Current and Future Market Size Value (USD Million) Analysis and Forecast By Type , 2025 to 2035
      • L1 Single City Version
      • L3 Cross-Region Version
    • Y to o to Y Growth Trend Analysis By Type , 2020 to 2024
    • Absolute $ Opportunity Analysis By Type , 2025 to 2035
  7. Global Market Analysis 2020 to 2024 and Forecast 2025 to 2035, By Application
    • Introduction / Key Findings
    • Historical Market Size Value (USD Million) Analysis By Application, 2020 to 2024
    • Current and Future Market Size Value (USD Million) Analysis and Forecast By Application, 2025 to 2035
      • Urban Transportation
      • Shuttle Bus Attendance
      • Others
    • Y to o to Y Growth Trend Analysis By Application, 2020 to 2024
    • Absolute $ Opportunity Analysis By Application, 2025 to 2035
  8. Global Market Analysis 2020 to 2024 and Forecast 2025 to 2035, By Region
    • Introduction
    • Historical Market Size Value (USD Million) Analysis By Region, 2020 to 2024
    • Current Market Size Value (USD Million) Analysis and Forecast By Region, 2025 to 2035
      • North America
      • Latin America
      • Western Europe
      • Eastern Europe
      • East Asia
      • South Asia and Pacific
      • Middle East & Africa
    • Market Attractiveness Analysis By Region
  9. North America Market Analysis 2020 to 2024 and Forecast 2025 to 2035, By Country
    • Historical Market Size Value (USD Million) Trend Analysis By Market Taxonomy, 2020 to 2024
    • Market Size Value (USD Million) Forecast By Market Taxonomy, 2025 to 2035
      • By Country
        • USA
        • Canada
        • Mexico
      • By Type
      • By Application
    • Market Attractiveness Analysis
      • By Country
      • By Type
      • By Application
    • Key Takeaways
  10. Latin America Market Analysis 2020 to 2024 and Forecast 2025 to 2035, By Country
    • Historical Market Size Value (USD Million) Trend Analysis By Market Taxonomy, 2020 to 2024
    • Market Size Value (USD Million) Forecast By Market Taxonomy, 2025 to 2035
      • By Country
        • Brazil
        • Chile
        • Rest of Latin America
      • By Type
      • By Application
    • Market Attractiveness Analysis
      • By Country
      • By Type
      • By Application
    • Key Takeaways
  11. Western Europe Market Analysis 2020 to 2024 and Forecast 2025 to 2035, By Country
    • Historical Market Size Value (USD Million) Trend Analysis By Market Taxonomy, 2020 to 2024
    • Market Size Value (USD Million) Forecast By Market Taxonomy, 2025 to 2035
      • By Country
        • Germany
        • UK
        • Italy
        • Spain
        • France
        • Nordic
        • BENELUX
        • Rest of Western Europe
      • By Type
      • By Application
    • Market Attractiveness Analysis
      • By Country
      • By Type
      • By Application
    • Key Takeaways
  12. Eastern Europe Market Analysis 2020 to 2024 and Forecast 2025 to 2035, By Country
    • Historical Market Size Value (USD Million) Trend Analysis By Market Taxonomy, 2020 to 2024
    • Market Size Value (USD Million) Forecast By Market Taxonomy, 2025 to 2035
      • By Country
        • Russia
        • Poland
        • Hungary
        • Balkan & Baltic
        • Rest of Eastern Europe
      • By Type
      • By Application
    • Market Attractiveness Analysis
      • By Country
      • By Type
      • By Application
    • Key Takeaways
  13. East Asia Market Analysis 2020 to 2024 and Forecast 2025 to 2035, By Country
    • Historical Market Size Value (USD Million) Trend Analysis By Market Taxonomy, 2020 to 2024
    • Market Size Value (USD Million) Forecast By Market Taxonomy, 2025 to 2035
      • By Country
        • China
        • Japan
        • South Korea
      • By Type
      • By Application
    • Market Attractiveness Analysis
      • By Country
      • By Type
      • By Application
    • Key Takeaways
  14. South Asia and Pacific Market Analysis 2020 to 2024 and Forecast 2025 to 2035, By Country
    • Historical Market Size Value (USD Million) Trend Analysis By Market Taxonomy, 2020 to 2024
    • Market Size Value (USD Million) Forecast By Market Taxonomy, 2025 to 2035
      • By Country
        • India
        • ASEAN
        • Australia & New Zealand
        • Rest of South Asia and Pacific
      • By Type
      • By Application
    • Market Attractiveness Analysis
      • By Country
      • By Type
      • By Application
    • Key Takeaways
  15. Middle East & Africa Market Analysis 2020 to 2024 and Forecast 2025 to 2035, By Country
    • Historical Market Size Value (USD Million) Trend Analysis By Market Taxonomy, 2020 to 2024
    • Market Size Value (USD Million) Forecast By Market Taxonomy, 2025 to 2035
      • By Country
        • Kingdom of Saudi Arabia
        • Other GCC Countries
        • Turkiye
        • South Africa
        • Other African Union
        • Rest of Middle East & Africa
      • By Type
      • By Application
    • Market Attractiveness Analysis
      • By Country
      • By Type
      • By Application
    • Key Takeaways
  16. Key Countries Market Analysis
    • USA
      • Pricing Analysis
      • Market Share Analysis, 2024
        • By Type
        • By Application
    • Canada
      • Pricing Analysis
      • Market Share Analysis, 2024
        • By Type
        • By Application
    • Mexico
      • Pricing Analysis
      • Market Share Analysis, 2024
        • By Type
        • By Application
    • Brazil
      • Pricing Analysis
      • Market Share Analysis, 2024
        • By Type
        • By Application
    • Chile
      • Pricing Analysis
      • Market Share Analysis, 2024
        • By Type
        • By Application
    • Germany
      • Pricing Analysis
      • Market Share Analysis, 2024
        • By Type
        • By Application
    • UK
      • Pricing Analysis
      • Market Share Analysis, 2024
        • By Type
        • By Application
    • Italy
      • Pricing Analysis
      • Market Share Analysis, 2024
        • By Type
        • By Application
    • Spain
      • Pricing Analysis
      • Market Share Analysis, 2024
        • By Type
        • By Application
    • France
      • Pricing Analysis
      • Market Share Analysis, 2024
        • By Type
        • By Application
    • India
      • Pricing Analysis
      • Market Share Analysis, 2024
        • By Type
        • By Application
    • ASEAN
      • Pricing Analysis
      • Market Share Analysis, 2024
        • By Type
        • By Application
    • Australia & New Zealand
      • Pricing Analysis
      • Market Share Analysis, 2024
        • By Type
        • By Application
    • China
      • Pricing Analysis
      • Market Share Analysis, 2024
        • By Type
        • By Application
    • Japan
      • Pricing Analysis
      • Market Share Analysis, 2024
        • By Type
        • By Application
    • South Korea
      • Pricing Analysis
      • Market Share Analysis, 2024
        • By Type
        • By Application
    • Russia
      • Pricing Analysis
      • Market Share Analysis, 2024
        • By Type
        • By Application
    • Poland
      • Pricing Analysis
      • Market Share Analysis, 2024
        • By Type
        • By Application
    • Hungary
      • Pricing Analysis
      • Market Share Analysis, 2024
        • By Type
        • By Application
    • Kingdom of Saudi Arabia
      • Pricing Analysis
      • Market Share Analysis, 2024
        • By Type
        • By Application
    • Turkiye
      • Pricing Analysis
      • Market Share Analysis, 2024
        • By Type
        • By Application
    • South Africa
      • Pricing Analysis
      • Market Share Analysis, 2024
        • By Type
        • By Application
  17. Market Structure Analysis
    • Competition Dashboard
    • Competition Benchmarking
    • Market Share Analysis of Top Players
      • By Regional
      • By Type
      • By Application
  18. Competition Analysis
    • Competition Deep Dive
      • Xiamen Lenz Communication
        • Overview
        • Product Portfolio
        • Profitability by Market Segments (Product/Age /Sales Channel/Region)
        • Sales Footprint
        • Strategy Overview
          • Marketing Strategy
          • Product Strategy
          • Channel Strategy
      • Magnetic North
      • Vcomcn
      • Guangdong Telpo
      • Shenzhen Emperor Technology
      • Beijing Watchdata
      • Hangzhou GOLONG Technology
      • Shenzhen Genvict Technologies
      • Cashway Fintech
      • USI Global
      • Xiamen Lanhe Electronics
      • Tianjin Public Transport Yitong Technology
  19. Assumptions & Acronyms Used
  20. Research Methodology

List of Tables

  • Table 1: Global Market Value (USD Million) Forecast by Region, 2020 to 2035
  • Table 2: Global Market Value (USD Million) Forecast by Type , 2020 to 2035
  • Table 3: Global Market Value (USD Million) Forecast by Application, 2020 to 2035
  • Table 4: North America Market Value (USD Million) Forecast by Country, 2020 to 2035
  • Table 5: North America Market Value (USD Million) Forecast by Type , 2020 to 2035
  • Table 6: North America Market Value (USD Million) Forecast by Application, 2020 to 2035
  • Table 7: Latin America Market Value (USD Million) Forecast by Country, 2020 to 2035
  • Table 8: Latin America Market Value (USD Million) Forecast by Type , 2020 to 2035
  • Table 9: Latin America Market Value (USD Million) Forecast by Application, 2020 to 2035
  • Table 10: Western Europe Market Value (USD Million) Forecast by Country, 2020 to 2035
  • Table 11: Western Europe Market Value (USD Million) Forecast by Type , 2020 to 2035
  • Table 12: Western Europe Market Value (USD Million) Forecast by Application, 2020 to 2035
  • Table 13: Eastern Europe Market Value (USD Million) Forecast by Country, 2020 to 2035
  • Table 14: Eastern Europe Market Value (USD Million) Forecast by Type , 2020 to 2035
  • Table 15: Eastern Europe Market Value (USD Million) Forecast by Application, 2020 to 2035
  • Table 16: East Asia Market Value (USD Million) Forecast by Country, 2020 to 2035
  • Table 17: East Asia Market Value (USD Million) Forecast by Type , 2020 to 2035
  • Table 18: East Asia Market Value (USD Million) Forecast by Application, 2020 to 2035
  • Table 19: South Asia and Pacific Market Value (USD Million) Forecast by Country, 2020 to 2035
  • Table 20: South Asia and Pacific Market Value (USD Million) Forecast by Type , 2020 to 2035
  • Table 21: South Asia and Pacific Market Value (USD Million) Forecast by Application, 2020 to 2035
  • Table 22: Middle East & Africa Market Value (USD Million) Forecast by Country, 2020 to 2035
  • Table 23: Middle East & Africa Market Value (USD Million) Forecast by Type , 2020 to 2035
  • Table 24: Middle East & Africa Market Value (USD Million) Forecast by Application, 2020 to 2035

List of Figures

  • Figure 1: Global Market Pricing Analysis
  • Figure 2: Global Market Value (USD Million) Forecast 2020-2035
  • Figure 3: Global Market Value Share and BPS Analysis by Type , 2025 and 2035
  • Figure 4: Global Market Y-o-Y Growth Comparison by Type , 2025-2035
  • Figure 5: Global Market Attractiveness Analysis by Type
  • Figure 6: Global Market Value Share and BPS Analysis by Application, 2025 and 2035
  • Figure 7: Global Market Y-o-Y Growth Comparison by Application, 2025-2035
  • Figure 8: Global Market Attractiveness Analysis by Application
  • Figure 9: Global Market Value (USD Million) Share and BPS Analysis by Region, 2025 and 2035
  • Figure 10: Global Market Y-o-Y Growth Comparison by Region, 2025-2035
  • Figure 11: Global Market Attractiveness Analysis by Region
  • Figure 12: North America Market Incremental Dollar Opportunity, 2025-2035
  • Figure 13: Latin America Market Incremental Dollar Opportunity, 2025-2035
  • Figure 14: Western Europe Market Incremental Dollar Opportunity, 2025-2035
  • Figure 15: Eastern Europe Market Incremental Dollar Opportunity, 2025-2035
  • Figure 16: East Asia Market Incremental Dollar Opportunity, 2025-2035
  • Figure 17: South Asia and Pacific Market Incremental Dollar Opportunity, 2025-2035
  • Figure 18: Middle East & Africa Market Incremental Dollar Opportunity, 2025-2035
  • Figure 19: North America Market Value Share and BPS Analysis by Country, 2025 and 2035
  • Figure 20: North America Market Value Share and BPS Analysis by Type , 2025 and 2035
  • Figure 21: North America Market Y-o-Y Growth Comparison by Type , 2025-2035
  • Figure 22: North America Market Attractiveness Analysis by Type
  • Figure 23: North America Market Value Share and BPS Analysis by Application, 2025 and 2035
  • Figure 24: North America Market Y-o-Y Growth Comparison by Application, 2025-2035
  • Figure 25: North America Market Attractiveness Analysis by Application
  • Figure 26: Latin America Market Value Share and BPS Analysis by Country, 2025 and 2035
  • Figure 27: Latin America Market Value Share and BPS Analysis by Type , 2025 and 2035
  • Figure 28: Latin America Market Y-o-Y Growth Comparison by Type , 2025-2035
  • Figure 29: Latin America Market Attractiveness Analysis by Type
  • Figure 30: Latin America Market Value Share and BPS Analysis by Application, 2025 and 2035
  • Figure 31: Latin America Market Y-o-Y Growth Comparison by Application, 2025-2035
  • Figure 32: Latin America Market Attractiveness Analysis by Application
  • Figure 33: Western Europe Market Value Share and BPS Analysis by Country, 2025 and 2035
  • Figure 34: Western Europe Market Value Share and BPS Analysis by Type , 2025 and 2035
  • Figure 35: Western Europe Market Y-o-Y Growth Comparison by Type , 2025-2035
  • Figure 36: Western Europe Market Attractiveness Analysis by Type
  • Figure 37: Western Europe Market Value Share and BPS Analysis by Application, 2025 and 2035
  • Figure 38: Western Europe Market Y-o-Y Growth Comparison by Application, 2025-2035
  • Figure 39: Western Europe Market Attractiveness Analysis by Application
  • Figure 40: Eastern Europe Market Value Share and BPS Analysis by Country, 2025 and 2035
  • Figure 41: Eastern Europe Market Value Share and BPS Analysis by Type , 2025 and 2035
  • Figure 42: Eastern Europe Market Y-o-Y Growth Comparison by Type , 2025-2035
  • Figure 43: Eastern Europe Market Attractiveness Analysis by Type
  • Figure 44: Eastern Europe Market Value Share and BPS Analysis by Application, 2025 and 2035
  • Figure 45: Eastern Europe Market Y-o-Y Growth Comparison by Application, 2025-2035
  • Figure 46: Eastern Europe Market Attractiveness Analysis by Application
  • Figure 47: East Asia Market Value Share and BPS Analysis by Country, 2025 and 2035
  • Figure 48: East Asia Market Value Share and BPS Analysis by Type , 2025 and 2035
  • Figure 49: East Asia Market Y-o-Y Growth Comparison by Type , 2025-2035
  • Figure 50: East Asia Market Attractiveness Analysis by Type
  • Figure 51: East Asia Market Value Share and BPS Analysis by Application, 2025 and 2035
  • Figure 52: East Asia Market Y-o-Y Growth Comparison by Application, 2025-2035
  • Figure 53: East Asia Market Attractiveness Analysis by Application
  • Figure 54: South Asia and Pacific Market Value Share and BPS Analysis by Country, 2025 and 2035
  • Figure 55: South Asia and Pacific Market Value Share and BPS Analysis by Type , 2025 and 2035
  • Figure 56: South Asia and Pacific Market Y-o-Y Growth Comparison by Type , 2025-2035
  • Figure 57: South Asia and Pacific Market Attractiveness Analysis by Type
  • Figure 58: South Asia and Pacific Market Value Share and BPS Analysis by Application, 2025 and 2035
  • Figure 59: South Asia and Pacific Market Y-o-Y Growth Comparison by Application, 2025-2035
  • Figure 60: South Asia and Pacific Market Attractiveness Analysis by Application
  • Figure 61: Middle East & Africa Market Value Share and BPS Analysis by Country, 2025 and 2035
  • Figure 62: Middle East & Africa Market Value Share and BPS Analysis by Type , 2025 and 2035
  • Figure 63: Middle East & Africa Market Y-o-Y Growth Comparison by Type , 2025-2035
  • Figure 64: Middle East & Africa Market Attractiveness Analysis by Type
  • Figure 65: Middle East & Africa Market Value Share and BPS Analysis by Application, 2025 and 2035
  • Figure 66: Middle East & Africa Market Y-o-Y Growth Comparison by Application, 2025-2035
  • Figure 67: Middle East & Africa Market Attractiveness Analysis by Application
  • Figure 68: Global Market - Tier Structure Analysis
  • Figure 69: Global Market - Company Share Analysis
Dashboard
Dashboard
Dashboard
Dashboard
Dashboard
Dashboard

Our Research Products

Full Research Suite

The "Full Research Suite" delivers actionable market intel, deep dives on markets or technologies, so clients act faster, cut risk, and unlock growth.

Competitor Leaderboard Report

The Leaderboard benchmarks and ranks top vendors, classifying them as Established Leaders, Leading Challengers, or Disruptors & Challengers.

Future Leaders Index

Locates where complements amplify value and substitutes erode it, forecasting net impact by horizon

Market Data & Forecasts

We deliver granular, decision-grade intel: market sizing, 5-year forecasts, pricing, adoption, usage, revenue, and operational KPIs—plus competitor tracking, regulation, and value chains—across 60 countries broadly.

Market Focus Report

Spot the shifts before they hit your P&L. We track inflection points, adoption curves, pricing moves, and ecosystem plays to show where demand is heading, why it is changing, and what to do next across high-growth markets and disruptive tech

Survey Report

Real-time reads of user behavior. We track shifting priorities, perceptions of today’s and next-gen services, and provider experience, then pace how fast tech moves from trial to adoption, blending buyer, consumer, and channel inputs with social signals (#WhySwitch, #UX).

Bespoke Reports

Partner with our analyst team to build a custom report designed around your business priorities. From analysing market trends to assessing competitors or crafting bespoke datasets, we tailor insights to your needs.

Supplier Intelligence

Discovery & Profiling

Capacity & Footprint

Performance & Risk

Compliance & Governance

Commercial Readiness

Who Supplies Whom

Scorecards & Shortlists

Playbooks & Docs

Category Intelligence

Definition & Scope

Demand & Use Cases

Cost Drivers

Market Structure

Supply Chain Map

Trade & Policy

Operating Norms

Deliverables

Buyer Intelligence

Account Basics

Spend & Scope

Procurement Model

Vendor Requirements

Terms & Policies

Entry Strategy

Pain Points & Triggers

Outputs

Pricing Analysis

Benchmarks

Trends

Should-Cost

Indexation

Landed Cost

Commercial Terms

Deliverables

Brand Analysis

Positioning & Value Prop

Share & Presence

Customer Evidence

Go-to-Market

Digital & Reputation

Compliance & Trust

KPIs & Gaps

Outputs

Full Research Suite comprises of:

Market outlook & trends analysis

Market outlook & trends analysis

Interviews & case studies

Interviews & case studies

Strategic recommendations

Strategic recommendations

Vendor profiles & capabilities analysis

Vendor profiles & capabilities analysis

5-year forecasts

5-year forecasts

8 regions and 60+ country-level data splits

8 regions and 60+ country-level data splits

Market segment data splits

Market segment data splits

12 months of continuous data updates

12 months of continuous data updates

DELIVERED AS:

PDF EXCEL ONLINE

Full Research Suite


$5000

$7500

$10000

Buy Report Now
Similar Industry Reports

Similar Industry Reports

Public Announcement System Market

Public Announcement System Market Size and Share Forecast Outlook 2025 to 2035

Public Cloud Application Infrastructure Services Market

Public Cloud Application Infrastructure Services Market Size and Share Forecast Outlook 2025 to 2035

Public Safety & Security Market

Public Safety & Security Market Size and Share Forecast Outlook 2025 to 2035

Public Cloud Application Services Market

Public Cloud Application Services Market Analysis - Size, Share, and Forecast Outlook 2025 to 2035

Public Key Infrastructure (PKI) Market

Public Key Infrastructure (PKI) Market Analysis - Growth & Forecast through 2034

Public Safety In-Building Wireless DAS System Market

Public Safety In-Building Wireless DAS System Market

Public Cloud Storage Market

Public Cloud Storage Market

AI for Public Security and Safety Market

AI for Public Security and Safety Market

Outdoor Public Safety Market

Outdoor Public Safety Market Growth Size, Demand & Forecast 2025 to 2035

IoT for Public Safety Market

IoT for Public Safety Market

Research Publication Support Service Market

Research Publication Support Service Market Size and Share Forecast Outlook 2025 to 2035

Mobile Notary Public Market

Mobile Notary Public Market Size and Share Forecast Outlook 2025 to 2035

AI In Government And Public Services Market

AI In Government And Public Services Market Size and Share Forecast Outlook 2025 to 2035

Transportation and Security System Market

Transportation and Security System Market Size and Share Forecast Outlook 2025 to 2035

Transportation Biofuel Market

Transportation Biofuel Market Size and Share Forecast Outlook 2025 to 2035

Transportation Infrastructure Construction Market

Transportation Infrastructure Construction Market Size and Share Forecast Outlook 2025 to 2035

Transportation Aggregators Market

Transportation Aggregators Market Size and Share Forecast Outlook 2025 to 2035

Transportation Based Hydrogen Energy Storage Market

Transportation Based Hydrogen Energy Storage Market Size and Share Forecast Outlook 2025 to 2035

Transportation Analytics Market

Transportation Analytics Market Analysis - Size, Share, and Forecast Outlook 2025 to 2035

Transportation Condensing Units Market

Transportation Condensing Units Market Growth – Trends & Forecast 2025 to 2035

Future Market Insights

Public Transportation Full Payment Platform Market

Chat With MaRIA

Chat With

MaRIA

Hi There, I am MaRIA, Your Market Research Intelligence Assistant. How may I help you?