The rubber frame monitors market is estimated at USD 4,469.4 million in 2025 and is likely to reach USD 7,349.8 million by 2035, reflecting a CAGR of 5.1%. The initial year sets a strong baseline, with the market value advancing to USD 4,697.3 million in 2026 and USD 4,936.9 million in 2027. This early phase demonstrates consistent annual growth, supported by the integration of durable rubber frames in industrial and outdoor monitor applications. The steady expansion indicates a long-term growth trend rather than stagnation or decline, with early adoption in safety-critical and ruggedized environments contributing significantly to the cumulative market increase.
The global rubber frame monitors market is projected to grow from USD 4,469.4 million in 2025 to approximately USD 7,349.8 million by 2035, recording an absolute increase of USD 2,880.4 million over the forecast period. This translates into a total growth of 64.4%, with the market forecast to expand at a compound annual growth rate (CAGR) of 5.1% between 2025 and 2035. The overall market size is expected to grow by nearly 1.6 times during the same period, supported by increasing demand for rugged display solutions, growing adoption of industrial automation systems, and a rising need for reliable monitoring equipment in harsh operating environments that require shock-resistant and weatherproof display technologies.
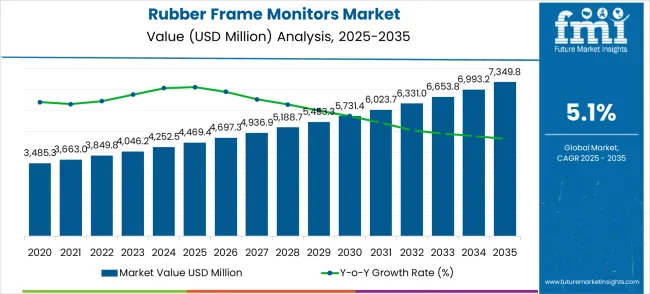
Between 2028 and 2031, the market value progresses from USD 5,188.7 million to USD 6,023.7 million, reflecting sustained mid-decade momentum. The CAGR during this period aligns closely with the forecast, confirming consistent market performance. Several factors contribute to this growth, including increasing industrial automation, demand for outdoor digital signage, and the adoption of high-impact-resistant monitors across manufacturing and commercial sectors. The mid-decade phase accounts for the largest portion of incremental value, with year-on-year contributions representing over 55% of total ten-year growth, highlighting the importance of this period for cumulative market expansion.Between 2025 and 2030, the rubber frame monitors market is projected to expand from USD 4,469.4 million to USD 5,709.3 million, resulting in a value increase of USD 1,239.9 million, which represents 43.0% of the total forecast growth for the decade. This phase of growth will be shaped by increasing industrial digitalization, growing adoption of Industry 4.0 technologies, and rising demand for ruggedized display solutions in manufacturing environments. Display manufacturers are expanding their rubber frame monitor portfolios to address the growing demand for durable display systems with enhanced environmental protection and operational reliability characteristics.
| Metric | Value |
|---|---|
| Estimated Value in (2025E) | USD 4,469.4 million |
| Forecast Value in (2035F) | USD 7,349.8 million |
| Forecast CAGR (2025 to 2035) | 5.1% |
From 2032 to 2034, the market exhibits values rising from USD 6,331.0 million to USD 6,993.2 million. This period reflects a slight moderation in growth velocity, indicative of approaching market maturity in core regions. Ongoing technological enhancements in touchscreen functionality, impact resistance, and energy efficiency maintain positive momentum. Incremental adoption in emerging economies, driven by infrastructure development and increasing demand for digital interfaces in public spaces, sustains market trajectory and offsets any deceleration in mature markets.
By 2035, the market reaches USD 7,349.8 million, completing a steady upward trajectory over the decade. Trendline visualization suggests a near-linear pattern, with minor curvature reflecting gradual acceleration during the mid-decade years. Long-term analysis confirms a growing market with no significant stagnation or decline phases. Each year contributes proportionally to the cumulative expansion, with early technological adoption, mid-decade segment penetration, and late-stage market maturation collectively shaping the 10-year growth pattern. The market demonstrates stable, continuous growth with predictable year-on-year increments.From 2030 to 2035, the market is forecast to grow from USD 5,709.3 million to USD 7,349.8 million, adding another USD 1,640.5 million, which constitutes 57.0% of the overall ten-year expansion. This period is expected to be characterized by widespread deployment of smart manufacturing systems, integration with IoT and edge computing platforms, and development of next-generation ruggedized display technologies. The growing demand for advanced human-machine interfaces and real-time monitoring capabilities will drive adoption of sophisticated rubber frame monitors with enhanced connectivity and interactive features.
Between 2020 and 2025, the rubber frame monitors market experienced steady growth, driven by increasing adoption of industrial automation systems and growing recognition of the importance of reliable display solutions in demanding operating environments. The market evolved as manufacturers recognized the superior environmental protection and durability advantages of rubber frame construction compared to conventional monitor designs. Progress in display technology integration and environmental sealing established the foundation for more robust and versatile monitoring solutions across various industrial and commercial applications.
Market expansion is being supported by the increasing demand for ruggedized display solutions that can withstand harsh industrial environments while maintaining reliable performance and visual quality. Modern manufacturing facilities and industrial operations are increasingly focused on display technologies that can operate consistently in challenging conditions including temperature extremes, humidity, vibration, and chemical exposure. The proven capability of rubber frame monitors to deliver environmental protection, shock resistance, and operational reliability makes them essential components of industrial automation and monitoring systems.
The growing emphasis focus on industrial digitalization and smart manufacturing is driving demand for advanced display solutions that can support human-machine interfaces, process monitoring, and data visualization in demanding environments. Industry preference for display systems that can integrate with existing automation infrastructure while providing enhanced durability and maintenance efficiency is creating opportunities for ruggedized monitor development. The rising influence of Industry 4.0 initiatives and IoT deployment is also contributing to increased adoption of reliable display technologies across different industrial sectors and applications.
The market is segmented by classification, application, and region. By classification, the market is divided into embedded, rack-mount, and others. Based on application, the market is categorized into industrial automation, automotive industry, medical equipment, and others. Regionally, the market is divided into Asia Pacific, North America, Europe, Latin America, and Middle East & Africa.
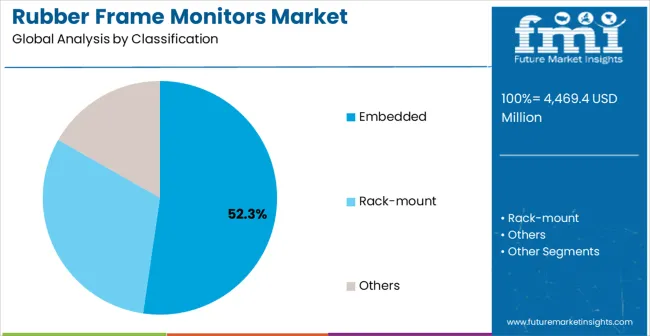
The embedded classification is projected to account for 52.3% of the rubber frame monitors market in 2025, reaffirming its position as the category's dominant installation type. Industrial system integrators increasingly recognize the space-efficient design and seamless integration capabilities provided by embedded rubber frame monitors for modern automation and control systems. This classification addresses the most demanding integration requirements while providing essential environmental protection characteristics.
This classification forms the foundation of most industrial automation and control panel applications, as it represents the most space-efficient and aesthetically integrated approach for display system installation. Technology development and design optimization continue to strengthen confidence in embedded monitor performance for demanding industrial applications. With increasing recognition of the importance of streamlined system integration and space optimization, embedded solutions align with both current installation requirements and future automation objectives. Their comprehensive integration capabilities across multiple mounting configurations ensures sustained market dominance, making them the central growth driver of rubber frame monitor adoption.
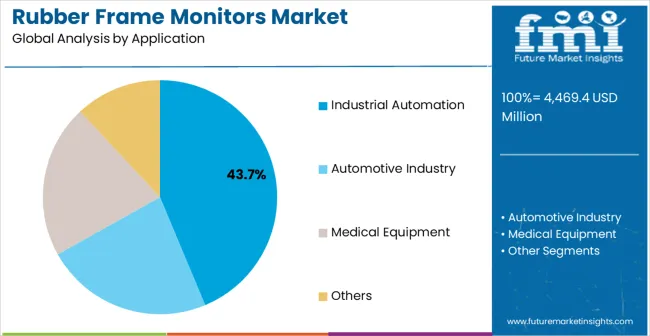
Industrial automation applications are projected to represent 43.7% of rubber frame monitors demand in 2025, underscoring highlighting their role as the primary application driving market development. Manufacturing companies recognize that industrial automation systems require the most reliable and durable display solutions to ensure consistent operation in demanding production environments. Industrial automation applications demand exceptional environmental resistance and operational reliability that rubber frame monitors are uniquely positioned to deliver.
The segment is supported by the continuous expansion of manufacturing automation requiring comprehensive human-machine interface solutions and the increasing adoption of Industry 4.0 technologies across industrial facilities. Additionally The , industrial automation is increasingly implementing advanced display systems that can support both process monitoring and data visualization requirements. As understanding of industrial automation display requirements advances, rubber frame monitor applications will continue to serve as the primary commercial driver, reinforcing their essential position within the industrial display technology market.
The rubber frame monitors market is advancing steadily due to increasing industrial automation adoption and growing demand for ruggedized display solutions in harsh environments. However T, the market faces challenges including higher costs compared to standard monitors, design limitations for certain applications, and competition from alternative ruggedization approaches. Innovation in display technology integration and environmental protection continues to influence product development and market expansion patterns.
The growing implementation of Industry 4.0 technologies is creating enhanced opportunities for rubber frame monitor integration with advanced manufacturing execution systems and IoT platforms. Smart manufacturing facilities require reliable display solutions that can interface with sophisticated automation systems and provide real-time operational visibility. Advanced manufacturing integration provides opportunities for intelligent display systems that can support both human-machine interaction and automated process monitoring.
Modern display manufacturers are incorporating high-resolution display panels, touch interface capabilities, and industrial connectivity standards to enhance rubber frame monitor functionality and user experience. These technologies improve visual clarity, enable intuitive operation, and provide enhanced system integration throughout industrial applications. Advanced technology integration also enables optimized power consumption and improved operational efficiency characteristics.
| Country | CAGR (2025-2035) |
|---|---|
| China | 6.9% |
| India | 6.4% |
| Germany | 5.9% |
| Brazil | 5.4% |
| USA | 4.8% |
| UK | 4.3% |
| Japan | 3.8% |
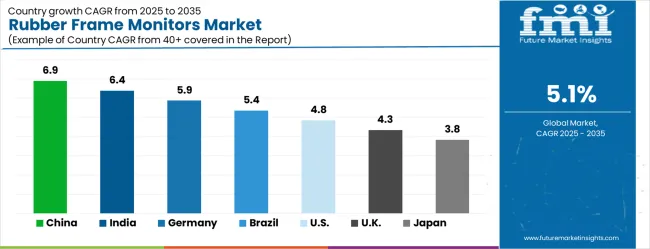
The global market is anticipated to grow at a CAGR of 5.1% between 2025 and 2035, driven by rising demand for durable, impact-resistant display solutions in industrial, educational, and commercial applications. China leads with 6.9% growth, supported by expanding electronics manufacturing and adoption of ruggedized display technologies. India follows at 6.4%, reflecting growing IT infrastructure, rising demand for protective monitors, and increasing adoption in industrial settings. Germany records 5.9%, driven by high-quality manufacturing standards and demand for durable display solutions. Brazil is projected at 5.4%, supported by gradual adoption in commercial and industrial sectors. The United States grows at 4.8%, influenced by replacement demand and use in specialized environments, while the United Kingdom expands at 4.3% and Japan at 3.8%, reflecting steady adoption in mature markets and controlled industrial applications.The rubber frame monitors market is experiencing solid growth globally, with China leading at a 6.9% CAGR through 2035, driven by massive manufacturing sector expansion, government support for industrial automation, and rapidly growing adoption of smart manufacturing technologies. India follows at 6.4%, supported by expanding industrial automation initiatives, increasing manufacturing capabilities, and growing investment in modernization programs. Germany shows growth at 5.9%, emphasizing precision manufacturing excellence and comprehensive industrial automation systems. Brazil records 5.4% growth, focusing on expanding industrial modernization and growing adoption of automation technologies. The USA shows 4.8% growth, representing steady demand from established industrial operations and technology integration programs.
The report covers an in-depth analysis of 40+ countries; seven top-performing countries are highlighted below.
China is projected to grow at a CAGR of 6.9% from 2025 to 2035, supported by the expansion of industrial machinery, automotive electronics, and consumer display sectors. Rubber frame monitors are increasingly adopted due to their high durability, shock resistance, and ability to withstand harsh operating conditions. Domestic manufacturers are integrating advanced polymer materials, precision molding techniques, and multi-touch capabilities to meet growing industrial and consumer demand. Growth is further reinforced by the adoption of smart factory solutions, automotive infotainment systems, and public infrastructure projects such as smart kiosks and healthcare monitoring devices. Collaborations with global display component suppliers are facilitating technology transfer and enhancing product quality. Rising investments in transportation, retail automation, and medical devices are further fueling market expansion in both domestic and export segments.
India is expected to expand at a CAGR of 6.4% from 2025 to 2035, driven by rising adoption across industrial automation, automotive electronics, consumer devices, and healthcare equipment. Rubber frame monitors are preferred for long-term reliability, resistance to vibration, and performance in challenging operational environments. Indian manufacturers are investing in cost-effective polymer compounds, precision molding processes, and integration of touchscreen interfaces to meet rising industrial and commercial demand. Expansion in EV production, industrial modernization initiatives, and smart retail deployments are fueling adoption. Collaborations with international display technology firms provide access to high-quality materials and design innovation. Demand from commercial, healthcare, and factory automation applications continues to grow as more industries recognize the benefits of durable display solutions.
Germany is forecasted to grow at a CAGR of 5.9% from 2025 to 2035, driven by adoption in industrial automation, automotive infotainment, and healthcare monitoring systems. Rubber frame monitors are preferred due to their durability, resistance to vibration, and ability to maintain performance in industrial and harsh operational settings. German manufacturers focus on high-quality polymer frames, precise touchscreen integration, and robust display modules for long-term use. Industrial hubs and automotive clusters, particularly in Bavaria and Baden-Württemberg, are driving high-volume adoption. Collaboration with European display technology firms enables innovation in coating, materials, and assembly processes. Demand from medical devices, factory automation, and automotive dashboards reinforces growth, with the premium manufacturing ecosystem ensuring consistent high-quality output across diverse applications.
Brazil is expected to expand at a CAGR of 5.4% from 2025 to 2035, supported by growing adoption in industrial, automotive, and commercial applications. Rubber frame monitors are favored for long-term durability, resistance to environmental stress, and performance in tropical climates. Local manufacturers are producing cost-effective solutions, while imports from Asia and Europe supplement professional-grade applications. Growth is driven by industrial modernization, automotive manufacturing expansion, and deployment of retail and commercial kiosks. Partnerships with international suppliers improve product quality and access to advanced coatings and polymers. The market is further supported by rising demand from industrial machinery, automotive dashboards, and public infrastructure, where long-lasting and reliable display units are increasingly required.
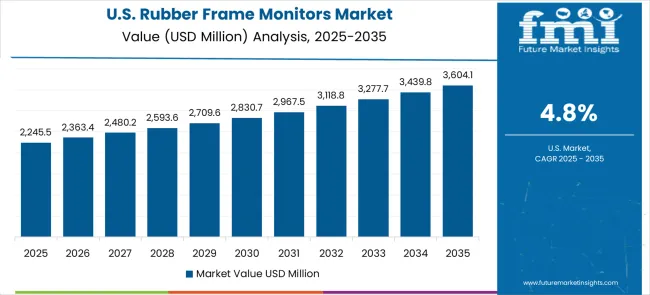
The United States is projected to grow at a CAGR of 4.8% from 2025 to 2035, driven by industrial, automotive, and healthcare sectors. Rubber frame monitors are preferred for durability, vibration resistance, and long operational life. USA manufacturers focus on polymer innovation, ruggedized designs, and advanced touchscreen integration to meet domestic demand across factories, automotive dashboards, and medical monitoring devices. Expansion of smart factories, EV adoption, and hospital equipment upgrades reinforces growth. Collaborations with international component suppliers enhance material quality, coating technologies, and assembly efficiency. Adoption is further supported by federal and state investments in industrial modernization, transportation, and healthcare technology, which are expanding deployment across multiple end-use sectors.
The United Kingdom is expected to grow at a CAGR of 4.3% during 2025–2035, with adoption driven by industrial, automotive, and healthcare applications. Rubber frame monitors are valued for their vibration resistance, durability, and reliability in demanding operational environments. UK manufacturers focus on high-quality polymer frames, touchscreen integration, and compatibility with industrial, medical, and commercial applications. Expansion of factory automation, EV dashboard deployment, and healthcare monitoring systems is driving growth. Collaborations with European optics and display firms ensure technological advancement and access to high-performance materials. Consumer awareness of durable and ruggedized displays for commercial and professional use further strengthens market adoption.
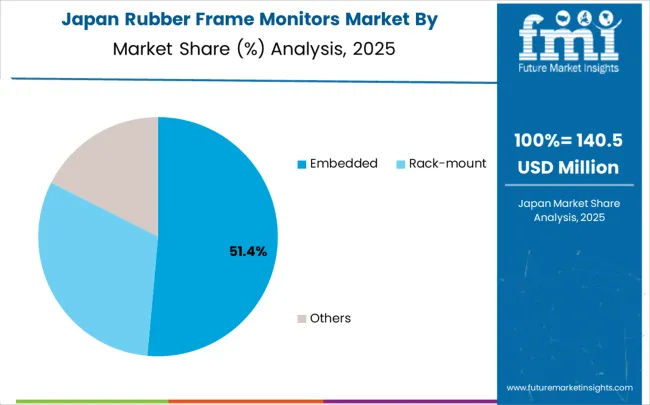
Japan is projected to grow at a CAGR of 3.8% from 2025 to 2035, driven by industrial automation, automotive electronics, robotics, and healthcare equipment. Rubber frame monitors are preferred for durability, vibration resistance, and extended operational life in high-performance applications. Japanese manufacturers emphasize precision polymer molding, multi-layer coatings, and advanced touchscreen integration. Adoption is supported by automotive clusters in Nagoya and Osaka, industrial machinery production, and increasing deployment of robotics in factories. Medical equipment manufacturers continue to demand ruggedized displays for critical monitoring applications. Collaborations with global display technology firms ensure access to high-quality materials and innovative designs, strengthening both domestic and export market presence.
Revenue from rubber frame monitors in China is projected to exhibit solid growth with a CAGR of 6.9% through 2035, driven by unprecedented manufacturing sector modernization and comprehensive government support for industrial automation and smart manufacturing development. The country's massive industrial base and increasing adoption of advanced manufacturing technologies are creating substantial opportunities for ruggedized display solutions. Major domestic and international display manufacturers are establishing comprehensive production and distribution capabilities to serve the rapidly expanding industrial automation market.
Government initiatives supporting manufacturing transformation and substantial investment in industrial automation infrastructure are driving steady adoption of ruggedized display systems throughout major industrial regions.
Manufacturing sector modernization and Industry 4.0 implementation are supporting increased deployment of rubber frame monitors among leading manufacturers, automation companies, and system integrators nationwide.
Revenue from rubber frame monitors in India is expanding at a CAGR of 6.4%, supported by rapidly growing industrial automation sector, increasing manufacturing capabilities, and expanding investment in modernization programs. The country's substantial manufacturing growth and commitment to technology advancement are driving demand for reliable display solutions. International display manufacturers and domestic companies are establishing partnerships to serve the growing demand for industrial display technologies.
Rising investment in industrial automation and manufacturing modernization are creating significant opportunities for ruggedized display systems across automotive, electronics, and general manufacturing sectors.
Growing government support for digitalization initiatives and smart manufacturing development is supporting increased adoption of rubber frame monitors among industrial facilities and automation providers.
Revenue from rubber frame monitors in Germany is projected to grow at a CAGR of 5.9%, supported by the country's leadership in precision manufacturing and comprehensive expertise in industrial automation technologies. German manufacturers and automation companies consistently invest in advanced display technologies and human-machine interface solutions. The market is characterized by engineering excellence, comprehensive quality standards, and established relationships between display suppliers and industrial users.
Industrial automation leadership and manufacturing excellence are supporting continued investment in advanced display systems throughout leading manufacturers and automation providers.
Research institution collaboration and engineering excellence are facilitating advancement of industrial display applications while ensuring superior performance and operational reliability.
Revenue from rubber frame monitors in Brazil is projected to grow at a CAGR of 5.4% through 2035, driven by expanding industrial modernization, increasing adoption of automation technologies, and growing focus on manufacturing efficiency improvement. Brazilian manufacturers are increasingly recognizing the importance of reliable display solutions in achieving operational excellence and competitive positioning.
Industrial modernization programs and manufacturing automation expansion are supporting increased deployment of ruggedized display systems across diverse manufacturing applications and industrial sectors.
Growing collaboration between international display companies and local manufacturers is enhancing technology adoption and supporting development of domestic industrial automation capabilities.
Revenue from rubber frame monitors in the USA is projected to grow at a CAGR of 4.8%, supported by established industrial automation infrastructure, continued innovation in manufacturing technologies, and comprehensive adoption of advanced display systems. American manufacturers and automation companies maintain consistent advancement of display technologies through established technology integration programs and operational excellence initiatives.
Industrial automation leadership and manufacturing innovation are driving continued investment in advanced display systems throughout leading industrial facilities and automation providers.
Technology innovation programs and industry collaboration are supporting continued advancement in ruggedized display performance and industrial application capabilities.
Revenue from rubber frame monitors in the UK is projected to grow at a CAGR of 4.3% through 2035, supported by industrial technology innovation initiatives and increasing investment in manufacturing automation systems. British manufacturers emphasize advanced display technologies within comprehensive industrial frameworks that prioritize operational efficiency and technology integration.
Industrial technology development programs and manufacturing modernization initiatives are supporting systematic adoption of ruggedized display systems across established industrial sectors and automation applications.
Innovation programs and industrial excellence initiatives are maintaining high standards for display technology performance while supporting continued development of advanced human-machine interface capabilities.
Revenue from rubber frame monitors in Japan is projected to grow at a CAGR of 3.8% through 2035, supported by the country's leadership in precision manufacturing and comprehensive approach to industrial display technologies. Japanese manufacturers emphasize technology-driven development of sophisticated display systems within established frameworks that prioritize technical excellence and operational reliability.
Advanced manufacturing capabilities and precision engineering expertise are supporting continued leadership in display technology innovation across leading companies and research institutions.
Industry collaboration initiatives and comprehensive technology standards are maintaining excellence in industrial display applications while supporting commercial success and market development.
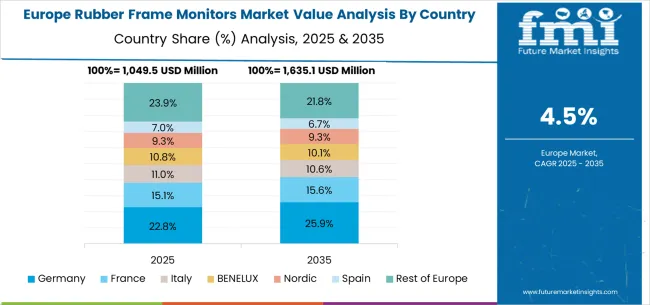
The rubber frame monitors market in Europe is projected to expand steadily through 2035, supported by established manufacturing industries, comprehensive industrial automation adoption, and ongoing modernization of production facilities. Germany will continue to lead the regional market, accounting for 28.7% in 2025 and rising to 29.4% by 2035, supported by strong manufacturing capabilities, advanced industrial automation infrastructure, and comprehensive display technology expertise. The United Kingdom follows with 18.9% in 2025, increasing to 19.2% by 2035, driven by industrial technology innovation initiatives, government support for manufacturing modernization, and expanding automation adoption.
France holds 16.4% in 2025, edging up to 16.7% by 2035 as manufacturers expand automation capabilities and demand grows for reliable display systems. Italy contributes 12.6% in 2025, remaining stable at 12.8% by 2035, supported by manufacturing sector strength and growing adoption of industrial automation technologies. Spain represents 9.7% in 2025, moving upward to 9.8% by 2035, underpinned by expanding industrial modernization and increasing investment in automation systems.
Nordic countries together account for 8.4% in 2025, maintaining their position at 8.5% by 2035, supported by advanced manufacturing initiatives and early adoption of innovative display technologies. The Rest of Europe represents 5.3% in 2025, declining slightly to 3.6% by 2035, as larger markets capture greater investment focus and established industrial infrastructure advantages.
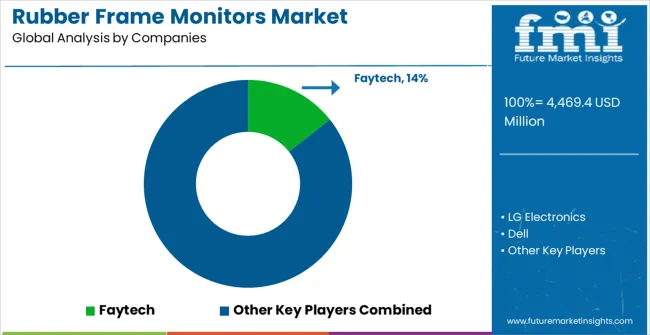
The market is competitive, driven by durability, display performance, and industrial application suitability. LG Electronics, Dell, Samsung, and BOE dominate with premium monitors combining high-resolution panels, rugged rubber frames, and advanced features such as touch integration, anti-glare coatings, and vibration resistance. Their competitive edge lies in global distribution, R&D capabilities, and established brand recognition. Product brochures emphasize shock absorption, environmental resistance, and long operational lifespan, catering to industrial, commercial, and transportation applications.
Faytech, Irontech Group, CCW, and Planar Systems focus on industrial-grade monitors designed for demanding environments. Faytech emphasizes waterproof and dustproof construction, while Irontech Group and CCW provide customizable sizes and mounting options. Planar Systems strengthens its position with high-precision displays suitable for control rooms, kiosks, and outdoor applications. Xenarc Technology, TRU-Vu Monitors, and Teguar differentiate through specialized designs for vehicle, marine, and medical applications, highlighting ruggedness, visibility under varying light conditions, and user-friendly installation.
Winmate, AU Optronics, Kontron, and Daktronics compete by targeting niche industrial and transportation markets with cost-effective solutions and regional support. Product brochures emphasize vibration tolerance, shock absorption, and thermal stability, ensuring performance in harsh operating conditions. Competition in this market is defined by display durability, operational reliability, and adaptability to diverse industrial applications. Leading firms invest in advanced panel technologies, rugged enclosures, and compliance with industrial certifications, while regional and specialized players leverage affordability, customization, and rapid delivery to maintain relevance in a market increasingly driven by industrial robustness and application-specific design.The rubber frame monitors market is characterized by competition among specialized industrial display manufacturers, established electronics companies, and innovative ruggedized technology providers. Companies are investing in advanced display technologies, environmental protection enhancement, strategic partnerships, and application development to deliver high-performance, reliable, and cost-effective rubber frame monitor solutions. Technology development, quality assurance, and customer support strategies are central to strengthening competitive advantages and market presence.
Faytech leads the market with significant expertise in industrial display technologies, offering comprehensive rubber frame monitor solutions with focus on ruggedization and industrial applications. LG Electronics provides established display technology capabilities with emphasis on advanced panel technologies and manufacturing excellence. Dell delivers comprehensive computing and display solutions with strong focus on industrial and commercial applications. Samsung operates with focus on advanced display panel technologies and comprehensive manufacturing capabilities.
Irontech Group specializes in industrial display solutions with emphasis on harsh environment applications. CCW provides ruggedized display technologies with focus on military and industrial markets. Planar Systems focuses on specialized display solutions with comprehensive industrial expertise. Xenarc Technology, TRU-Vu Monitors, Teguar, BOE, LG Display, Winmate, AU Optronics, Kontron, and Daktronics provide diverse technological approaches and application expertise to enhance overall market development and display technology advancement.
| Items | Values |
|---|---|
| Quantitative Units (2025) | USD 4,469.4 mMillion |
| Classification | Embedded, Rack-mount, Others |
| Application | Industrial Automation, Automotive Industry, Medical Equipment, Others |
| Regions Covered | Asia Pacific, North America, Europe, Latin America, Middle East & Africa |
| Countries Covered | China, India, Germany, Brazil, United States, United Kingdom, Japan and 40+ countries |
| Key Companies Profiled | Faytech, LG Electronics, Dell, Samsung, Irontech Group, CCW, Planar Systems, Xenarc Technology, TRU-Vu Monitors, Teguar, BOE, LG Display, Winmate, AU Optronics, Kontron, Daktronics |
| Additional Attributes | Dollar sales by monitor type and application, regional adoption trends, competitive landscape, industrial partnerships, integration with automation systems, innovations in display technology and ruggedization, durability analysis, and operational reliability optimization strategies |
The global rubber frame monitors market is estimated to be valued at USD 4,469.4 million in 2025.
The market size for the rubber frame monitors market is projected to reach USD 7,349.8 million by 2035.
The rubber frame monitors market is expected to grow at a 5.1% CAGR between 2025 and 2035.
The key product types in rubber frame monitors market are embedded, rack-mount and others.
In terms of application, industrial automation segment to command 43.7% share in the rubber frame monitors market in 2025.


Our Research Products

The "Full Research Suite" delivers actionable market intel, deep dives on markets or technologies, so clients act faster, cut risk, and unlock growth.

The Leaderboard benchmarks and ranks top vendors, classifying them as Established Leaders, Leading Challengers, or Disruptors & Challengers.

Locates where complements amplify value and substitutes erode it, forecasting net impact by horizon

We deliver granular, decision-grade intel: market sizing, 5-year forecasts, pricing, adoption, usage, revenue, and operational KPIs—plus competitor tracking, regulation, and value chains—across 60 countries broadly.

Spot the shifts before they hit your P&L. We track inflection points, adoption curves, pricing moves, and ecosystem plays to show where demand is heading, why it is changing, and what to do next across high-growth markets and disruptive tech

Real-time reads of user behavior. We track shifting priorities, perceptions of today’s and next-gen services, and provider experience, then pace how fast tech moves from trial to adoption, blending buyer, consumer, and channel inputs with social signals (#WhySwitch, #UX).

Partner with our analyst team to build a custom report designed around your business priorities. From analysing market trends to assessing competitors or crafting bespoke datasets, we tailor insights to your needs.
Supplier Intelligence
Discovery & Profiling
Capacity & Footprint
Performance & Risk
Compliance & Governance
Commercial Readiness
Who Supplies Whom
Scorecards & Shortlists
Playbooks & Docs
Category Intelligence
Definition & Scope
Demand & Use Cases
Cost Drivers
Market Structure
Supply Chain Map
Trade & Policy
Operating Norms
Deliverables
Buyer Intelligence
Account Basics
Spend & Scope
Procurement Model
Vendor Requirements
Terms & Policies
Entry Strategy
Pain Points & Triggers
Outputs
Pricing Analysis
Benchmarks
Trends
Should-Cost
Indexation
Landed Cost
Commercial Terms
Deliverables
Brand Analysis
Positioning & Value Prop
Share & Presence
Customer Evidence
Go-to-Market
Digital & Reputation
Compliance & Trust
KPIs & Gaps
Outputs
Full Research Suite comprises of:
Market outlook & trends analysis
Interviews & case studies
Strategic recommendations
Vendor profiles & capabilities analysis
5-year forecasts
8 regions and 60+ country-level data splits
Market segment data splits
12 months of continuous data updates
DELIVERED AS:
PDF EXCEL ONLINE
Rubber Molding Market Forecast Outlook 2025 to 2035
Rubber Track for Defense and Security Market Size and Share Forecast Outlook 2025 to 2035
Rubber Coating Market Size and Share Forecast Outlook 2025 to 2035
Rubber Anti-Tack Agents Market Size and Share Forecast Outlook 2025 to 2035
Rubber to Metal Bonded Articles Market Analysis Size and Share Forecast Outlook 2025 to 2035
Rubber-to-Metal Adhesion Market Analysis - Size, Share, and Forecast Outlook 2025-2035
Rubber Coatings Market Growth - Trends & Forecast 2025 to 2035
Rubber Conveyor Belt Market Size, Growth, and Forecast 2025 to 2035
Rubber Testing Equipment Market Growth – Trends & Forecast 2025 to 2035
Rubber Tapes Market Trends - Growth & Forecast 2025 to 2035
Rubber Extruder Market Growth - Trends & Forecast 2025 to 2035
Rubber choppers Market
Gas Scrubber Market Size and Share Forecast Outlook 2025 to 2035
Air Scrubbers Market
Sleeve Rubber Stopper Market Size and Share Forecast Outlook 2025 to 2035
Europe Rubber Derived Unrefined Pyrolysis Oil Market Size and Share Forecast Outlook 2025 to 2035
Sterile Rubber Stopper Market Size and Share Forecast Outlook 2025 to 2035
Natural Rubber Market Size and Share Forecast Outlook 2025 to 2035
Plastic-Rubber Composite Market Trend Analysis Based on Product, Application, and Region 2025 to 2035
Snap on Rubber Stopper Market

Thank you!
You will receive an email from our Business Development Manager. Please be sure to check your SPAM/JUNK folder too.
Chat With
MaRIA