Soy-based Food Market Outlook (2022 to 2032)

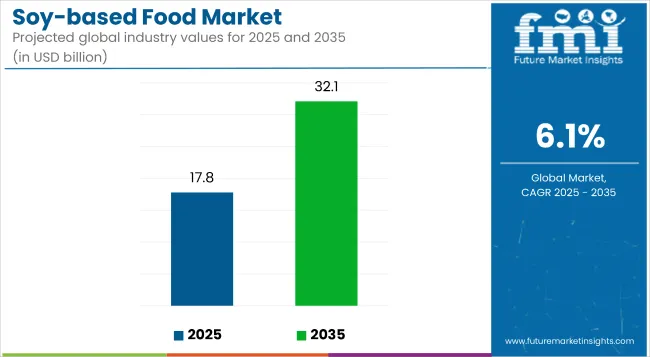
The global soy-based food market is estimated at USD 15.8 Billion in 2022 and is projected to reach USD 27.1 Billion by 2032, at a CAGR of 5.8% from 2022 to 2032. As per a study by Future Market Insights, the demand for soy-based food is expected to remain steady, exhibiting growth at 5.8% CAGR between 2022 and 2032 in comparison to the CAGR of 3.7% posted between 2017 and 2021.

Traditional soy-based foods like soymilk, tofu, soybeans, soybean oil, and soy cheese have been designed to fit the contemporary taste patterns of consumers. These are also categorized as indispensable parts of dessert supplements and meat substitutes. Due to its higher protein content and nutritional value, soy food has been an essential part of the majority of vegetarian consumers.

A lateral change in consumer demand for cooking oil is being brought on by the prevalence of cardiac illnesses. Consumers who are concerned about their health are searching for low-bad cholesterol, heart-friendly substitutes for standard cooking oil. This has significantly changed the soy-based food market outlook. Although the availability of substitutes like olive oil is restricting the soy-based food market expansion, the producers are increasing their production capacities to offer their goods at competitive prices.

Attribute Details
Soy-based Food Size (2022E) USD 15.8 Billion
Soy-based Food Projected Size (2032F) USD 27.1 Billion
Value CAGR (2022 to 2032) 5.8%
Top 3 Countries' Market Share 47.7%

The versatile nature of soy-based food and meat analogs production is responsible for driving the soy-based food market over the past few years. In fact, it has been claimed by various researchers that consuming soy-based foods aids in cardiovascular risk reduction, controlling flow of sexual hormones, and curing disruption held in thyroid function. These key soy-based food market trends have shifted the global scenario.

Don't pay for what you don't need

Customize your report by selecting specific countries or regions and save 30%!

2017 to 2021 Soy-based Food Outlook in Comparison With 2022 to 2032 Growth Forecast

As per the soy-based food market study, over the past half-decade, the protein quality of soy food has become an area of interest for fitness freaks and is expected to provide notable opportunities in the upcoming 5 years. With the growing adoption of greener and vegetarian kind of lifestyles, varieties of soy-based food products available in the market will start gaining traction in grocery stores. Higher protein content along with lower content of carbohydrates makes soy-based food products a unique energy source with high nutritional value.

The soy-based food market analysis indicated that the majority of soy-based food consumption was held within Asian countries historically. But, with increasing awareness about its nutritional value, European and American countries started adopting it as a regular partner on their dining table.

Soy-based Food Market

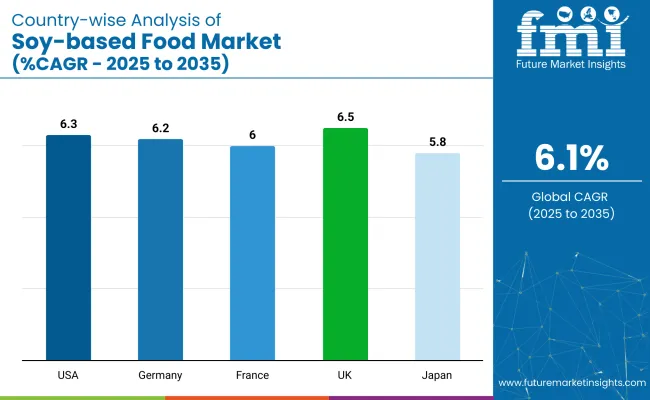
Country-wise Analysis

USA Market for Soy-based Food

North America continues to lead the demand for soy-based food. The USA generated the most soy oil, at a significant 11 Million metric tonnes, according to SOPA projections. The continuous rise in consumer demand for soy oil and soy-based goods is expected to increase the sales of soy-based food.

China to Uplift Demand for Soy-based Food

Currently, China accounts for 37.6% of the total soy-based food market share and is projected to generate around 40.3% of the total valuation for the East Asia soy-based food market by the end of 2032.

Initially, as Asian countries had a majority of the vegetarian population, to fulfill the protein demand, soy-based food products became an indispensable part of their life. Asian food recipes containing soy-based products as their essential ingredients have been a continuous source of demand for soy-based food. A vast majority of soy-based food manufacturers have invested their money in establishing a strong supply-chain network in Asian countries.

Japan and Korea to dominate the Asia Pacific Soy-based Food

Japan has also emerged as a lucrative soy-based food market and exhibits high potential to expand further in the coming years. It is predicted to show a considerable growth rate of 5.5% over the assessment period.

Being a country with a consumption capacity of 50-110 milligrams per day for soy and soy-based foods, which is approximately equivalent to that of China with numbers as 25-135 milligrams per day, which is a key driver for the rise in the demand for soy-based food.

The key soy-based food market trends indicate that Japan is also a leading consumer of soy-based food in the Asian subcontinent. Japan and China are expected to account for the maximum market value share of the global soy-based food business.

Nandini Roy Choudhury

Principal Consultant

Talk to Analyst

Find your sweet spots for generating winning opportunities in this market.

Category-wise Insights

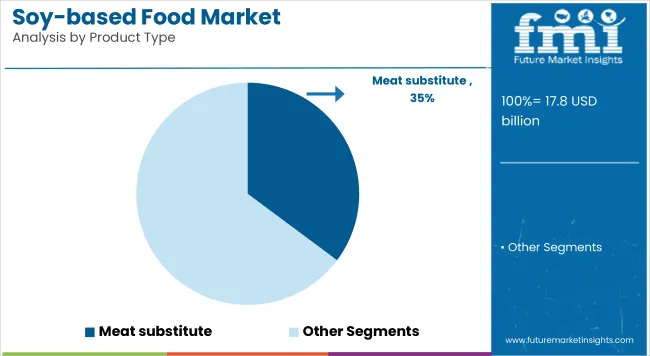
Meat Products to Gain Traction

Soya-based food products being highly digestible in nature makes them a good contender for being used as an ingredient in meat-based recipes. Its high nutritional value along with high protein and low carbohydrates completely fulfills the meal.

The presence of soy-based food products as ingredients in non-vegetarian dishes makes them easy to digest and enhances their flavor. Therefore, the demand for soy-based food in meat products is expected to rise in the near future.

Indirect Channel to Remain Dominant

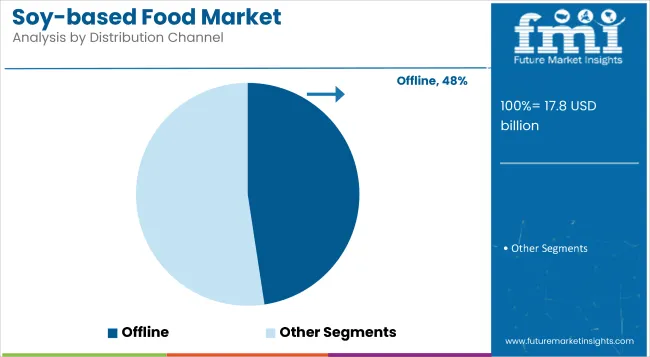
With the expansion of markets for meat products, bakery products, exercise supplements, and so on, the indirect sales channel for soy-based food products is gaining traction. It is expected to continue exhibiting high growth through the forecast period.

Competition Landscape: Top Companies in the Soy-based Food

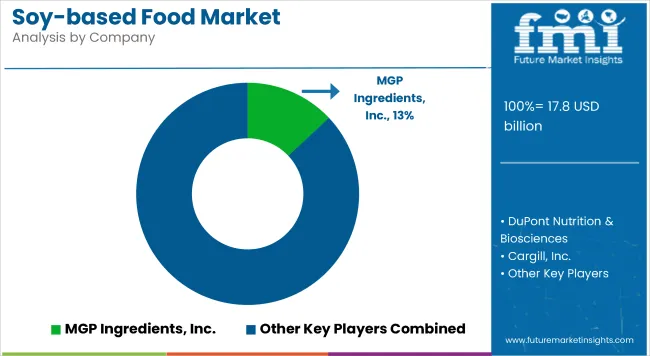
The market is highly competitive without many roles of dominant players such as Nestle S.A., Danone SA, Solbar Ltd, Cargill Inc., ADM Company, and others. Soy-based food manufacturers are focusing on introducing and innovating a wide variety of products in order to increase their consumer base and gain a competitive advantage.

Recent Developments

In February 2021, Danone and Earth Island, the company behind the Follow Your Heart line of vegan and plant-based goods, entered into a deal for Danone to buy all of Earth Island's shares. Danone will be able to strengthen its plant-based business thanks to this acquisition. Vegenaise, a brand of dairy- and egg-free mayonnaise owned by Earth Island, is also a manufacturer of dressings and cheese substitutes.

Get the data you need at a Fraction of the cost

Personalize your report by choosing insights you need
and save 40%!

Scope of Report

Attribute Details
Forecast Period 2022 to 2032
Historical Data Available for 2017 to 2021
Market Analysis USD Billion for Value and MT for Volume
Key Regions Covered North America; Latin America; Europe; East Asia; South Asia; Oceania; and the Middle East & Africa
Key Countries Covered USA, Canada, Brazil, Mexico, Chile, Peru, Germany, United Kingdom, Spain, Italy, France, Russia, Poland, China, India, Japan, Australia, New Zealand, GCC Countries, North Africa, South Africa, and Turkey
Key Segments Covered Product Type, Application, Distribution Channel, and Region
Key Companies Profiled DuPont Solae; Northern Soy Inc.; Cargill Inc.; ADM Inc.; Solbar Ltd.; Whole Soy & Co.; The Scoular Company; Linyi Shansong Biological Products Co. Ltd.; Unilever Group; Impossible Food; Danone SA; Nestle SA; Gathered Food Corporation; Others
Report Coverage Market Forecast, Company Share Analysis, Competition Intelligence, Drivers, Restraints, Opportunities and Threats Analysis, Market Dynamics and Challenges, and Strategic Growth Initiatives
Customization & Pricing Available upon Request

Global Soy-based Food by Category

By Product Type, Global Soy-based Food is segmented as:

  • Meat Substitutes
    • Textured Vegetable Protein
    • Tofu
    • Tempeh
  • Non- dairy Yogurt
  • Non-dairy Spread
  • Non- dairy Ice Cream
  • Non- dairy Cheese

By Application, Global Soy-based Food is segmented as:

  • Meat Products
  • Dairy Products
  • Bakery and Confectionery
  • Functional Food
  • Instant Food

By Distribution Channel, Global Soy-based Food is segmented as:

  • Direct
  • Indirect
    • Hypermarkets/Supermarkets
    • Convenience Store
    • Specialty Stores
    • Independent Retailers
    • Online Retailers

By Region, Global Soy-based Food is segmented as:

  • North America
  • Latin America
  • Europe
  • East Asia
  • South Asia
  • Oceania
  • Middle East & Africa

Frequently Asked Questions

What is the market scenario of soy-based food?

The soy-based food market is expected to reach a value of USD 15.8 Billion by 2022 end.

At what rate is the global soy-based food expected to grow?

Soy-based food consumption is expected to increase at a CAGR of around 5.8% over the forecast period (2022 to 2032).

How are market players reacting to the new developments in the soy-based food?

The soy-based food market players are opting for partnerships, mergers and acquisitions, product innovation, and production capacity expansion.

How much share does the top 10 companies in the soy-based food hold?

The top 10 producers of soy-based food including Nestle S.A., Danone SA, Cargill Inc., Northern Soy, DuPont, and others hold around 35 to 40% of the market share.

Which are the major countries driving demand for butter?

China, Japan, and Korea are the major countries driving demand for soy-based food.

Table of Content
1. Executive Summary | Soy-based Food Market
    1.1. Global Market Outlook
    1.2. Demand-side Trends
    1.3. Supply-side Trends
    1.4. Technology Roadmap Analysis
    1.5. Analysis and Recommendations
2. Market Overview
    2.1. Market Coverage / Taxonomy
    2.2. Market Definition / Scope / Limitations
3. Market Background
    3.1. Market Dynamics
        3.1.1. Drivers
        3.1.2. Restraints
        3.1.3. Opportunity 
        3.1.4. Trends
    3.2. Scenario Forecast
        3.2.1. Demand in Optimistic Scenario
        3.2.2. Demand in Likely Scenario
        3.2.3. Demand in Conservative Scenario
    3.3. Product launches & Recent Developments
    3.4. Product Life Cycle Analysis
    3.5. Value Chain Analysis
        3.5.1. Supply Side Participants and their Roles
            3.5.1.1. Producers
            3.5.1.2. Mid-Level Participants (Traders/ Agents/ Brokers)
            3.5.1.3. Wholesalers and Distributors
        3.5.2. % of Operating Margin Analysis
        3.5.3. List of Raw Material Suppliers
        3.5.4. List of Existing and Potential Buyers
    3.6. Global Market - Pricing Analysis
        3.6.1. Price Point Assessment by Region
        3.6.2. Price Point Assessment by Product Type
        3.6.3. Price Forecast till 2032
        3.6.4. Factors affecting pricing
    3.7. Forecast Factors - Relevance & Impact
    3.8. Regulatory Landscape
        3.8.1. Packaging & Labelling Regulations
        3.8.2. Certifications and Certifying Agency Overview
        3.8.3. Import/Export Policies
    3.9. Regional Parent Market Outlook
    3.10. Consumers Survey Analysis
    3.11. Macro-Economic Factors
    3.12. Product Claims & Nutritional Information scanned by Buyers
4. Global Market Analysis 2017 to 2021 and Forecast, 2022 to 2032
    4.1. Historical Market Size Value (US$ Million) & Volume (MT) Analysis, 2017 to 2021
    4.2. Current and Future Market Size Value (US$ Million) & Volume (MT) Projections, 2022 to 2032
        4.2.1. Y-o-Y Growth Trend Analysis
        4.2.2. Absolute $ Opportunity Analysis
5. Global Market Analysis 2017 to 2021 and Forecast 2022 to 2032, By Product Type
    5.1. Introduction / Key Findings
    5.2. Historical Market Size Value (US$ Million) & Volume (MT) Analysis By Product Type, 2017 to 2021
    5.3. Current and Future Market Size Value (US$ Million) & Volume (MT) Analysis and Forecast By Product Type, 2022 to 2032
        5.3.1. Meat Substitutes
            5.3.1.1. Textured Vegetable Protein
            5.3.1.2. Tofu
            5.3.1.3. Tempeh
        5.3.2. Non-Dairy Yogurt
        5.3.3. Non-Dairy Spread
        5.3.4. Non-Dairy Ice Cream
        5.3.5. Non-Dairy Cheese
    5.4. Y-o-Y Growth Trend Analysis By Product Type, 2017 to 2021
    5.5. Absolute $ Opportunity Analysis By Product Type, 2022 to 2032
6. Global Market Analysis 2017 to 2021 and Forecast 2022 to 2032, By Application
    6.1. Introduction / Key Findings
    6.2. Historical Market Size Value (US$ Million) & Volume (MT) Analysis By Application, 2017 to 2021
    6.3. Current and Future Market Size Value (US$ Million) & Volume (MT) Analysis and Forecast By Application, 2022 to 2032
        6.3.1. Meat Products
        6.3.2. Dairy Products
        6.3.3. Bakery & Confectionery
        6.3.4. Functional Food
        6.3.5. Instant Food
    6.4. Y-o-Y Growth Trend Analysis By Application, 2017 to 2021
    6.5. Absolute $ Opportunity Analysis By Application, 2022 to 2032
7. Global Market Analysis 2017 to 2021 and Forecast 2022 to 2032, By Distribution Channel
    7.1. Introduction / Key Findings
    7.2. Historical Market Size Value (US$ Million) & Volume (MT) Analysis By Distribution Channel, 2017 to 2021
    7.3. Current and Future Market Size Value (US$ Million) & Volume (MT) Analysis and Forecast By Distribution Channel, 2022 to 2032
        7.3.1. Direct
        7.3.2. Indirect
            7.3.2.1. Hypermarkets/Supermarkets
            7.3.2.2. Convenience Store
            7.3.2.3. Specialty Stores
            7.3.2.4. Independent Retailers
            7.3.2.5. Online Retailers
    7.4. Y-o-Y Growth Trend Analysis By Distribution Channel, 2017 to 2021
    7.5. Absolute $ Opportunity Analysis By Distribution Channel, 2022 to 2032
8. Global Market Analysis 2017 to 2021 and Forecast 2022 to 2032, By Region
    8.1. Introduction
    8.2. Historical Market Size Value (US$ Million) & Volume (MT) Analysis By Region, 2017 to 2021
    8.3. Current Market Size Value (US$ Million) & Volume (MT) Analysis and Forecast By Region, 2022 to 2032
        8.3.1. North America
        8.3.2. Latin America
        8.3.3. Europe
        8.3.4. East Asia
        8.3.5. South Asia
        8.3.6. Oceania
        8.3.7. Middle East and Africa
    8.4. Market Attractiveness Analysis By Region
9. North America Market Analysis 2017 to 2021 and Forecast 2022 to 2032, By Country
    9.1. Historical Market Size Value (US$ Million) & Volume (MT) Trend Analysis By Market Taxonomy, 2017 to 2021
    9.2. Market Size Value (US$ Million) & Volume (MT) Forecast By Market Taxonomy, 2022 to 2032
        9.2.1. By Country
            9.2.1.1. USA
            9.2.1.2. Canada
        9.2.2. By Product Type
        9.2.3. By Application
        9.2.4. By Distribution Channel
    9.3. Market Attractiveness Analysis
        9.3.1. By Country
        9.3.2. By Product Type
        9.3.3. By Application
        9.3.4. By Distribution Channel
    9.4. Key Takeaways
10. Latin America Market Analysis 2017 to 2021 and Forecast 2022 to 2032, By Country
    10.1. Historical Market Size Value (US$ Million) & Volume (MT) Trend Analysis By Market Taxonomy, 2017 to 2021
    10.2. Market Size Value (US$ Million) & Volume (MT) Forecast By Market Taxonomy, 2022 to 2032
        10.2.1. By Country
            10.2.1.1. Brazil
            10.2.1.2. Mexico
            10.2.1.3. Argentina
            10.2.1.4. Chile
            10.2.1.5. Peru
            10.2.1.6. Rest of Latin America
        10.2.2. By Product Type
        10.2.3. By Application
        10.2.4. By Distribution Channel
    10.3. Market Attractiveness Analysis
        10.3.1. By Country
        10.3.2. By Product Type
        10.3.3. By Application
        10.3.4. By Distribution Channel
    10.4. Key Takeaways
11. Europe Market Analysis 2017 to 2021 and Forecast 2022 to 2032, By Country
    11.1. Historical Market Size Value (US$ Million) & Volume (MT) Trend Analysis By Market Taxonomy, 2017 to 2021
    11.2. Market Size Value (US$ Million) & Volume (MT) Forecast By Market Taxonomy, 2022 to 2032
        11.2.1. By Country
            11.2.1.1. Germany
            11.2.1.2. Italy
            11.2.1.3. France
            11.2.1.4. United Kingdom
            11.2.1.5. Spain
            11.2.1.6. Russia
            11.2.1.7. BENELUX
            11.2.1.8. Poland
            11.2.1.9. Nordic Countries
            11.2.1.10. Rest of Europe
        11.2.2. By Product Type
        11.2.3. By Application
        11.2.4. By Distribution Channel
    11.3. Market Attractiveness Analysis
        11.3.1. By Country
        11.3.2. By Product Type
        11.3.3. By Application
        11.3.4. By Distribution Channel
    11.4. Key Takeaways
12. East Asia Market Analysis 2017 to 2021 and Forecast 2022 to 2032, By Country
    12.1. Historical Market Size Value (US$ Million) & Volume (MT) Trend Analysis By Market Taxonomy, 2017 to 2021
    12.2. Market Size Value (US$ Million) & Volume (MT) Forecast By Market Taxonomy, 2022 to 2032
        12.2.1. By Country
            12.2.1.1. China
            12.2.1.2. Japan
            12.2.1.3. South Korea
        12.2.2. By Product Type
        12.2.3. By Application
        12.2.4. By Distribution Channel
    12.3. Market Attractiveness Analysis
        12.3.1. By Country
        12.3.2. By Product Type
        12.3.3. By Application
        12.3.4. By Distribution Channel
    12.4. Key Takeaways
13. South Asia Market Analysis 2017 to 2021 and Forecast 2022 to 2032, By Country
    13.1. Historical Market Size Value (US$ Million) & Volume (MT) Trend Analysis By Market Taxonomy, 2017 to 2021
    13.2. Market Size Value (US$ Million) & Volume (MT) Forecast By Market Taxonomy, 2022 to 2032
        13.2.1. By Country
            13.2.1.1. India
            13.2.1.2. Thailand
            13.2.1.3. Malaysia
            13.2.1.4. Indonesia
            13.2.1.5. Singapore
            13.2.1.6. Rest of South Asia
        13.2.2. By Product Type
        13.2.3. By Application
        13.2.4. By Distribution Channel
    13.3. Market Attractiveness Analysis
        13.3.1. By Country
        13.3.2. By Product Type
        13.3.3. By Application
        13.3.4. By Distribution Channel
    13.4. Key Takeaways
14. Oceania Market Analysis 2017 to 2021 and Forecast 2022 to 2032, By Country
    14.1. Historical Market Size Value (US$ Million) & Volume (MT) Trend Analysis By Market Taxonomy, 2017 to 2021
    14.2. Market Size Value (US$ Million) & Volume (MT) Forecast By Market Taxonomy, 2022 to 2032
        14.2.1. By Country
            14.2.1.1. Australia
            14.2.1.2. New Zealand
        14.2.2. By Product Type
        14.2.3. By Application
        14.2.4. By Distribution Channel
    14.3. Market Attractiveness Analysis
        14.3.1. By Country
        14.3.2. By Product Type
        14.3.3. By Application
        14.3.4. By Distribution Channel
    14.4. Key Takeaways
15. Middle East and Africa Market Analysis 2017 to 2021 and Forecast 2022 to 2032, By Country
    15.1. Historical Market Size Value (US$ Million) & Volume (MT) Trend Analysis By Market Taxonomy, 2017 to 2021
    15.2. Market Size Value (US$ Million) & Volume (MT) Forecast By Market Taxonomy, 2022 to 2032
        15.2.1. By Country
            15.2.1.1. GCC Countries
            15.2.1.2. South Africa
            15.2.1.3. Central Africa
            15.2.1.4. North Africa
        15.2.2. By Product Type
        15.2.3. By Application
        15.2.4. By Distribution Channel
    15.3. Market Attractiveness Analysis
        15.3.1. By Country
        15.3.2. By Product Type
        15.3.3. By Application
        15.3.4. By Distribution Channel
    15.4. Key Takeaways
16. Key Countries Market Analysis
    16.1. USA
        16.1.1. Pricing Analysis
        16.1.2. Market Share Analysis, 2021
            16.1.2.1. By Product Type
            16.1.2.2. By Application
            16.1.2.3. By Distribution Channel
    16.2. Canada
        16.2.1. Pricing Analysis
        16.2.2. Market Share Analysis, 2021
            16.2.2.1. By Product Type
            16.2.2.2. By Application
            16.2.2.3. By Distribution Channel
    16.3. Brazil
        16.3.1. Pricing Analysis
        16.3.2. Market Share Analysis, 2021
            16.3.2.1. By Product Type
            16.3.2.2. By Application
            16.3.2.3. By Distribution Channel
    16.4. Mexico
        16.4.1. Pricing Analysis
        16.4.2. Market Share Analysis, 2021
            16.4.2.1. By Product Type
            16.4.2.2. By Application
            16.4.2.3. By Distribution Channel
    16.5. Argentina
        16.5.1. Pricing Analysis
        16.5.2. Market Share Analysis, 2021
            16.5.2.1. By Product Type
            16.5.2.2. By Application
            16.5.2.3. By Distribution Channel
    16.6. Chile
        16.6.1. Pricing Analysis
        16.6.2. Market Share Analysis, 2021
            16.6.2.1. By Product Type
            16.6.2.2. By Application
            16.6.2.3. By Distribution Channel
    16.7. Peru
        16.7.1. Pricing Analysis
        16.7.2. Market Share Analysis, 2021
            16.7.2.1. By Product Type
            16.7.2.2. By Application
            16.7.2.3. By Distribution Channel
    16.8. Germany
        16.8.1. Pricing Analysis
        16.8.2. Market Share Analysis, 2021
            16.8.2.1. By Product Type
            16.8.2.2. By Application
            16.8.2.3. By Distribution Channel
    16.9. Italy
        16.9.1. Pricing Analysis
        16.9.2. Market Share Analysis, 2021
            16.9.2.1. By Product Type
            16.9.2.2. By Application
            16.9.2.3. By Distribution Channel
    16.10. France
        16.10.1. Pricing Analysis
        16.10.2. Market Share Analysis, 2021
            16.10.2.1. By Product Type
            16.10.2.2. By Application
            16.10.2.3. By Distribution Channel
    16.11. Spain
        16.11.1. Pricing Analysis
        16.11.2. Market Share Analysis, 2021
            16.11.2.1. By Product Type
            16.11.2.2. By Application
            16.11.2.3. By Distribution Channel
    16.12. United Kingdom
        16.12.1. Pricing Analysis
        16.12.2. Market Share Analysis, 2021
            16.12.2.1. By Product Type
            16.12.2.2. By Application
            16.12.2.3. By Distribution Channel
    16.13. Russia
        16.13.1. Pricing Analysis
        16.13.2. Market Share Analysis, 2021
            16.13.2.1. By Product Type
            16.13.2.2. By Application
            16.13.2.3. By Distribution Channel
    16.14. Poland
        16.14.1. Pricing Analysis
        16.14.2. Market Share Analysis, 2021
            16.14.2.1. By Product Type
            16.14.2.2. By Application
            16.14.2.3. By Distribution Channel
    16.15. BENELUX
        16.15.1. Pricing Analysis
        16.15.2. Market Share Analysis, 2021
            16.15.2.1. By Product Type
            16.15.2.2. By Application
            16.15.2.3. By Distribution Channel
    16.16. Nordic Countries
        16.16.1. Pricing Analysis
        16.16.2. Market Share Analysis, 2021
            16.16.2.1. By Product Type
            16.16.2.2. By Application
            16.16.2.3. By Distribution Channel
    16.17. China
        16.17.1. Pricing Analysis
        16.17.2. Market Share Analysis, 2021
            16.17.2.1. By Product Type
            16.17.2.2. By Application
            16.17.2.3. By Distribution Channel
    16.18. Japan
        16.18.1. Pricing Analysis
        16.18.2. Market Share Analysis, 2021
            16.18.2.1. By Product Type
            16.18.2.2. By Application
            16.18.2.3. By Distribution Channel
    16.19. South Korea
        16.19.1. Pricing Analysis
        16.19.2. Market Share Analysis, 2021
            16.19.2.1. By Product Type
            16.19.2.2. By Application
            16.19.2.3. By Distribution Channel
    16.20. India
        16.20.1. Pricing Analysis
        16.20.2. Market Share Analysis, 2021
            16.20.2.1. By Product Type
            16.20.2.2. By Application
            16.20.2.3. By Distribution Channel
    16.21. Thailand
        16.21.1. Pricing Analysis
        16.21.2. Market Share Analysis, 2021
            16.21.2.1. By Product Type
            16.21.2.2. By Application
            16.21.2.3. By Distribution Channel
    16.22. Indonesia
        16.22.1. Pricing Analysis
        16.22.2. Market Share Analysis, 2021
            16.22.2.1. By Product Type
            16.22.2.2. By Application
            16.22.2.3. By Distribution Channel
    16.23. Malaysia
        16.23.1. Pricing Analysis
        16.23.2. Market Share Analysis, 2021
            16.23.2.1. By Product Type
            16.23.2.2. By Application
            16.23.2.3. By Distribution Channel
    16.24. Singapore
        16.24.1. Pricing Analysis
        16.24.2. Market Share Analysis, 2021
            16.24.2.1. By Product Type
            16.24.2.2. By Application
            16.24.2.3. By Distribution Channel
    16.25. Australia
        16.25.1. Pricing Analysis
        16.25.2. Market Share Analysis, 2021
            16.25.2.1. By Product Type
            16.25.2.2. By Application
            16.25.2.3. By Distribution Channel
    16.26. New Zealand
        16.26.1. Pricing Analysis
        16.26.2. Market Share Analysis, 2021
            16.26.2.1. By Product Type
            16.26.2.2. By Application
            16.26.2.3. By Distribution Channel
    16.27. GCC Countries
        16.27.1. Pricing Analysis
        16.27.2. Market Share Analysis, 2021
            16.27.2.1. By Product Type
            16.27.2.2. By Application
            16.27.2.3. By Distribution Channel
    16.28. South Africa
        16.28.1. Pricing Analysis
        16.28.2. Market Share Analysis, 2021
            16.28.2.1. By Product Type
            16.28.2.2. By Application
            16.28.2.3. By Distribution Channel
    16.29. North Africa
        16.29.1. Pricing Analysis
        16.29.2. Market Share Analysis, 2021
            16.29.2.1. By Product Type
            16.29.2.2. By Application
            16.29.2.3. By Distribution Channel
    16.30. Central Africa
        16.30.1. Pricing Analysis
        16.30.2. Market Share Analysis, 2021
            16.30.2.1. By Product Type
            16.30.2.2. By Application
            16.30.2.3. By Distribution Channel
17. Market Structure Analysis
    17.1. Competition Dashboard
    17.2. Competition Benchmarking
    17.3. Market Share Analysis of Top Players
        17.3.1. By Regional
        17.3.2. By Product Type
        17.3.3. By Application
        17.3.4. By Distribution Channel
18. Competition Analysis
    18.1. Competition Deep Dive
        18.1.1. DuPont Solae
            18.1.1.1. Overview
            18.1.1.2. Product Portfolio
            18.1.1.3. Profitability by Market Segments (Product Type/Application/Distribution Channel/Region)
            18.1.1.4. Sales Footprint
            18.1.1.5. Strategy Overview
                18.1.1.5.1. Marketing Strategy
                18.1.1.5.2. Product Strategy
                18.1.1.5.3. Channel Strategy
        18.1.2. Northern Soy Inc.
            18.1.2.1. Overview
            18.1.2.2. Product Portfolio
            18.1.2.3. Profitability by Market Segments (Product Type/Application/Distribution Channel/Region)
            18.1.2.4. Sales Footprint
            18.1.2.5. Strategy Overview
                18.1.2.5.1. Marketing Strategy
                18.1.2.5.2. Product Strategy
                18.1.2.5.3. Channel Strategy
        18.1.3. Cargill Inc.
            18.1.3.1. Overview
            18.1.3.2. Product Portfolio
            18.1.3.3. Profitability by Market Segments (Product Type/Application/Distribution Channel/Region)
            18.1.3.4. Sales Footprint
            18.1.3.5. Strategy Overview
                18.1.3.5.1. Marketing Strategy
                18.1.3.5.2. Product Strategy
                18.1.3.5.3. Channel Strategy
        18.1.4. ADM Inc.
            18.1.4.1. Overview
            18.1.4.2. Product Portfolio
            18.1.4.3. Profitability by Market Segments (Product Type/Application/Distribution Channel/Region)
            18.1.4.4. Sales Footprint
            18.1.4.5. Strategy Overview
                18.1.4.5.1. Marketing Strategy
                18.1.4.5.2. Product Strategy
                18.1.4.5.3. Channel Strategy
        18.1.5. Solbar Ltd.
            18.1.5.1. Overview
            18.1.5.2. Product Portfolio
            18.1.5.3. Profitability by Market Segments (Product Type/Application/Distribution Channel/Region)
            18.1.5.4. Sales Footprint
            18.1.5.5. Strategy Overview
                18.1.5.5.1. Marketing Strategy
                18.1.5.5.2. Product Strategy
                18.1.5.5.3. Channel Strategy
        18.1.6. Whole Soy & Co.
            18.1.6.1. Overview
            18.1.6.2. Product Portfolio
            18.1.6.3. Profitability by Market Segments (Product Type/Application/Distribution Channel/Region)
            18.1.6.4. Sales Footprint
            18.1.6.5. Strategy Overview
                18.1.6.5.1. Marketing Strategy
                18.1.6.5.2. Product Strategy
                18.1.6.5.3. Channel Strategy
        18.1.7. The Scoular Company
            18.1.7.1. Overview
            18.1.7.2. Product Portfolio
            18.1.7.3. Profitability by Market Segments (Product Type/Application/Distribution Channel/Region)
            18.1.7.4. Sales Footprint
            18.1.7.5. Strategy Overview
                18.1.7.5.1. Marketing Strategy
                18.1.7.5.2. Product Strategy
                18.1.7.5.3. Channel Strategy
        18.1.8. Linyi Shansong Biological Products Co. Ltd.
            18.1.8.1. Overview
            18.1.8.2. Product Portfolio
            18.1.8.3. Profitability by Market Segments (Product Type/Application/Distribution Channel/Region)
            18.1.8.4. Sales Footprint
            18.1.8.5. Strategy Overview
                18.1.8.5.1. Marketing Strategy
                18.1.8.5.2. Product Strategy
                18.1.8.5.3. Channel Strategy
        18.1.9. Unilever Group
            18.1.9.1. Overview
            18.1.9.2. Product Portfolio
            18.1.9.3. Profitability by Market Segments (Product Type/Application/Distribution Channel/Region)
            18.1.9.4. Sales Footprint
            18.1.9.5. Strategy Overview
                18.1.9.5.1. Marketing Strategy
                18.1.9.5.2. Product Strategy
                18.1.9.5.3. Channel Strategy
        18.1.10. Impossible Food
            18.1.10.1. Overview
            18.1.10.2. Product Portfolio
            18.1.10.3. Profitability by Market Segments (Product Type/Application/Distribution Channel/Region)
            18.1.10.4. Sales Footprint
            18.1.10.5. Strategy Overview
                18.1.10.5.1. Marketing Strategy
                18.1.10.5.2. Product Strategy
                18.1.10.5.3. Channel Strategy
        18.1.11. Danone SA
            18.1.11.1. Overview
            18.1.11.2. Product Portfolio
            18.1.11.3. Profitability by Market Segments (Product Type/Application/Distribution Channel/Region)
            18.1.11.4. Sales Footprint
            18.1.11.5. Strategy Overview
                18.1.11.5.1. Marketing Strategy
                18.1.11.5.2. Product Strategy
                18.1.11.5.3. Channel Strategy
        18.1.12. Nestle SA
            18.1.12.1. Overview
            18.1.12.2. Product Portfolio
            18.1.12.3. Profitability by Market Segments (Product Type/Application/Distribution Channel/Region)
            18.1.12.4. Sales Footprint
            18.1.12.5. Strategy Overview
                18.1.12.5.1. Marketing Strategy
                18.1.12.5.2. Product Strategy
                18.1.12.5.3. Channel Strategy
        18.1.13. Gathered Food Corporation
            18.1.13.1. Overview
            18.1.13.2. Product Portfolio
            18.1.13.3. Profitability by Market Segments (Product Type/Application/Distribution Channel/Region)
            18.1.13.4. Sales Footprint
            18.1.13.5. Strategy Overview
                18.1.13.5.1. Marketing Strategy
                18.1.13.5.2. Product Strategy
                18.1.13.5.3. Channel Strategy
        18.1.14. Others on Additional Request
            18.1.14.1. Overview
            18.1.14.2. Product Portfolio
            18.1.14.3. Profitability by Market Segments (Product Type/Application/Distribution Channel/Region)
            18.1.14.4. Sales Footprint
            18.1.14.5. Strategy Overview
                18.1.14.5.1. Marketing Strategy
                18.1.14.5.2. Product Strategy
                18.1.14.5.3. Channel Strategy
19. Assumptions & Acronyms Used
20. Research Methodology
Recommendations

Food and Beverage

Soluble Corn Fiber Market

January 2024

REP-GB-104

324 pages

Food and Beverage

Soy Food Products Market

September 2022

REP-GB-105

250 pages

Food and Beverage

Modified Soya Flour Market

June 2022

REP-GB-6360

350 pages

Explore Food and Beverage Insights

View Reports
Future Market Insights

Soy-based Food Market

Schedule a Call