The Spigot End Cap Market is estimated to be valued at USD 42.6 billion in 2025 and is projected to reach USD 80.0 billion by 2035, registering a compound annual growth rate (CAGR) of 6.5% over the forecast period.
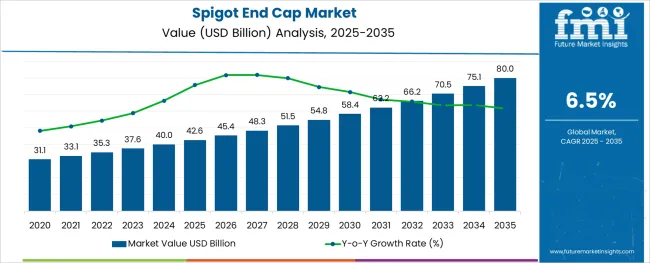
The spigot end cap market is gaining momentum as demand increases for durable sealing components in fluid transport systems across water, wastewater, and gas distribution networks. Market expansion is being supported by growing investments in urban infrastructure, coupled with upgrades to existing utility pipelines. The need for secure and pressure-resistant end connections has led manufacturers to develop caps with improved sealing performance and long service life.
Lightweight materials, cost efficiency, and corrosion resistance are key factors driving product innovation. Rapid urbanization and stringent construction codes have resulted in a rise in standardized pipeline installations, boosting the consumption of modular fittings such as spigot end caps.
Emerging economies are witnessing increased adoption due to government-backed housing and sanitation projects. With rising emphasis on leak-proof design, installation ease, and compatibility with a range of pipe materials, the market is expected to continue its upward trajectory driven by engineering-grade improvements and end-user demand for reliability and sustainability.
The market is segmented by Material, Thickness, and End Use and region. By Material, the market is divided into Plastic and Rubber. In terms of Thickness, the market is classified into 21-50 mm, 51-100 mm, Above 100 mm, and Up to 20 mm. Based on End Use, the market is segmented into Building & Construction, Automobile, and Electrical & Electronics. Regionally, the market is classified into North America, Latin America, Western Europe, Eastern Europe, Balkan & Baltic Countries, Russia & Belarus, Central Asia, East Asia, South Asia & Pacific, and the Middle East & Africa.
The market is segmented by Material, Thickness, and End Use and region. By Material, the market is divided into Plastic and Rubber. In terms of Thickness, the market is classified into 21-50 mm, 51-100 mm, Above 100 mm, and Up to 20 mm. Based on End Use, the market is segmented into Building & Construction, Automobile, and Electrical & Electronics. Regionally, the market is classified into North America, Latin America, Western Europe, Eastern Europe, Balkan & Baltic Countries, Russia & Belarus, Central Asia, East Asia, South Asia & Pacific, and the Middle East & Africa.
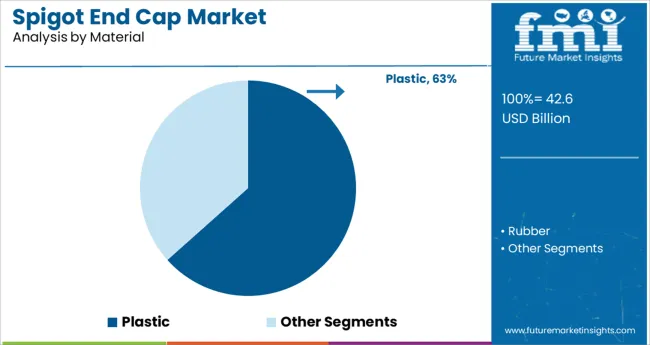
Plastic spigot end caps are expected to dominate the material segment with a 63.4% revenue share in 2025. This dominance is attributed to the widespread use of thermoplastics such as polyethylene and polypropylene which offer high chemical resistance, ease of installation, and low production costs. The lightweight nature of plastic enhances transport and handling efficiency while maintaining the structural integrity required in water and gas distribution applications.
Plastic variants are increasingly selected for corrosion-prone environments due to their longevity and compatibility with plastic pipeline systems. Regulatory support for non-metallic piping in potable water systems has further encouraged market preference.
In addition, sustainability trends are pushing for recyclable plastics in infrastructure components, reinforcing the material’s share within the market. The ease of injection molding and customization also makes plastic the material of choice for large-scale production.
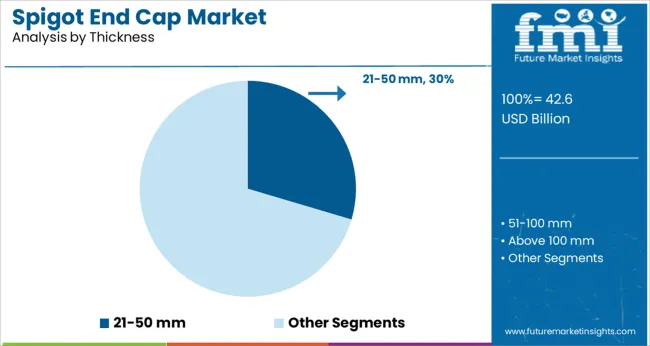
The 21 to 50 mm thickness range is projected to capture 29.6% of market revenue in 2025 under the thickness category. This segment leads due to its suitability across a wide array of medium-duty pipe sealing applications where balance between material economy and pressure durability is essential.
Spigot end caps in this thickness range are commonly used in municipal water systems, irrigation pipelines, and construction projects requiring moderate pressure handling. Manufacturers have optimized this range to offer performance reliability without unnecessary material excess, thereby enhancing cost efficiency.
Furthermore, the dimensional versatility of this segment supports standardized fitting systems that are easier to stock and deploy across different pipeline configurations. As demand grows for scalable and modular pipeline components, this thickness range is likely to retain a central role in volume-driven end-use applications.
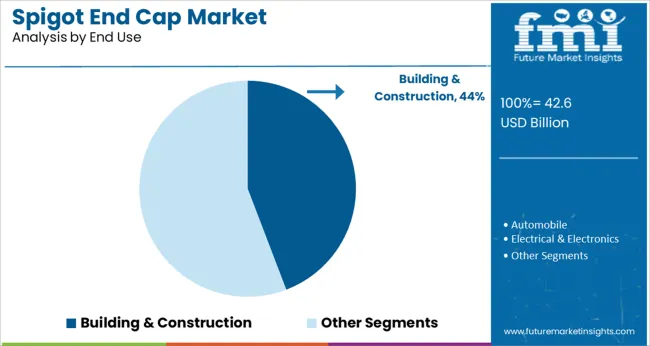
The building and construction segment is projected to hold 44.2% of market share in 2025 by end use, making it the most significant consumer of spigot end caps. Growth in this segment is being driven by rising residential and commercial development, especially in urban areas where reliable piping infrastructure is crucial. Spigot end caps are heavily utilized in concrete-embedded pipelines, HVAC systems, and plumbing networks that require durable sealing and minimal maintenance.
Construction standards mandating pressure-tested pipe ends and leak-proof sealing mechanisms have reinforced their application. Additionally, the increasing integration of pre-fabricated piping assemblies in modular construction has led to the consistent use of spigot fittings.
Contractors and engineers are prioritizing materials that reduce on-site labor and installation time, further supporting the demand for standardized end caps. As smart buildings and eco-friendly construction solutions evolve, the use of compatible and maintenance-free pipeline components will continue to drive adoption within the construction sector.
The demand for spigot end cap strong and durable solutions for building and construction applications, such as spigot end cap, has grown in recent years. The sales of spigot end cap is growing as manufacturers are now producing protective packaging solutions like spigot end caps based on consumer needs.
Another factor propelling the demand for spigot end caps is that they can be used in traditional packaging applications such as bottles, pipes, and so on.
The demand for spigot end cap is rising as they are gaining popularity in multiple end use industries. Spigot end cap are also used on packaging for building and construction applications, automobile spare parts, electronic appliances, consumer products, and other applications.
As a result, the sales of spigot end cap is projected to grow rapidly during the forecast period. Furthermore, the demand for spigot end cap is growing as it cost-effective closing solution which aids in boosting the safety of packed items and applications.
The spigot end cap market is anticipated to grow as they are created and built to protect products or goods from vibration, magnetic, atmospheric, and shock damage, among other things. The sales of spigot end cap are rising as they help to reduce waste and save money.
Spigot end caps are often made of high-density polyethylene (HDPE), low-density polyethylene (LDPE), expanded polystyrene (EPS), chloride (PVC), and other materials. Plastic spigot end caps are also employed in a variety of packing applications as a corrosion-resistant option. During the projection period, all of the aforementioned factors are anticipated to provide enormous opportunities for the spigot end cap market.
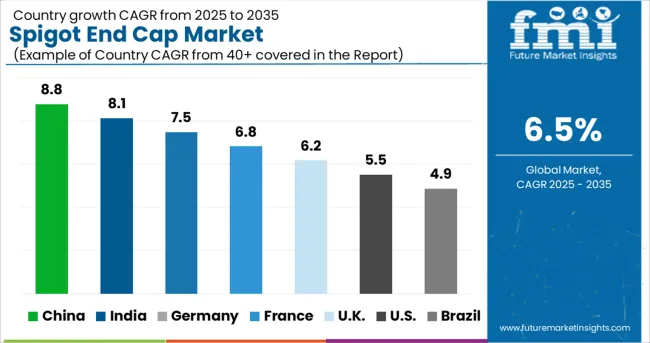
Due to rising sales of spigot end cap, Canada is expected to have significant expansion in the spigot end cap market share during the forecast period. Furthermore, due to high demand for spigot end cap from the building and construction industry, the United States is expected to dominate the North American spigot end cap market throughout the projection period.
Due to the widespread use of spigot end caps in irrigation and agriculture applications in the Asia Pacific area, India and China are expected to witness increase in the sales of spigot end cap.
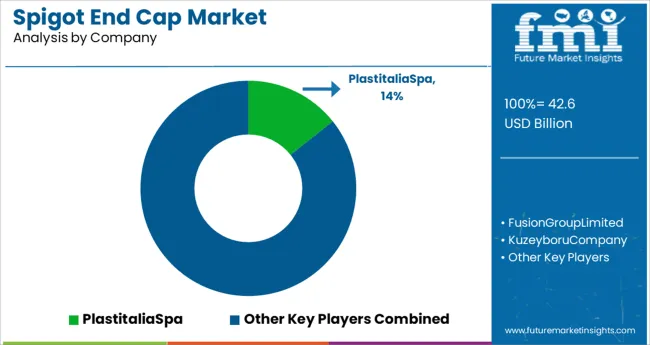
Plastitalia Spa, Fusion Group Limited, Kuzeyboru Company, Kimplas Piping Systems Ltd., T-mex Ltd, Adroit Piping Systems, and others are some of the key players in the spigot end cap market. During the projected period, some unorganized and local companies are also expected to contribute to the spigot end cap market growth.
Key Developments
| Report Attribute | Details |
|---|---|
| Growth rate | CAGR of 6.5% from 2025 to 2035 |
| Base year for estimation | 2024 |
| Historical data | 2020 to 2024 |
| Forecast period | 2025 to 2035 |
| Quantitative units | Revenue in million, volume in kilotons, and CAGR from 2025 to 2035 |
| Report coverage | Revenue forecast, volume forecast, company ranking, competitive landscape, growth factors, and trends, Pricing Analysis |
| Segments covered | Material type, thickness, application, end use industry, region |
| Regional scope | North America; Western Europe; Eastern Europe; Middle East; Africa; ASEAN; South Asia; Rest of Asia; Australia and New Zealand |
| Country scope | USA, Canada, Mexico, Germany, UK, France, Italy, Spain, Russia, Belgium, Poland, Czech Republic, China, India, Japan, Australia, Brazil, Argentina, Colombia, Saudi Arabia, UAE, Iran, South Africa |
| Key companies profiled | Plastitalia Spa; Fusion Group Limited; Kuzeyboru Company; Kimplas Piping Systems Ltd.; T-mex Ltd, Adroit Piping Systems |
| Customization scope | Free report customization (equivalent to up to 8 analysts working days) with purchase. Addition or alteration to country, regional & segment scope. |
| Pricing and purchase options | Avail customized purchase options to meet your exact research needs. |
The global spigot end cap market is estimated to be valued at USD 42.6 billion in 2025.
It is projected to reach USD 80.0 billion by 2035.
The market is expected to grow at a 6.5% CAGR between 2025 and 2035.
The key product types are plastic and rubber.
21-50 mm segment is expected to dominate with a 29.6% industry share in 2025.


Our Research Products

The "Full Research Suite" delivers actionable market intel, deep dives on markets or technologies, so clients act faster, cut risk, and unlock growth.

The Leaderboard benchmarks and ranks top vendors, classifying them as Established Leaders, Leading Challengers, or Disruptors & Challengers.

Locates where complements amplify value and substitutes erode it, forecasting net impact by horizon

We deliver granular, decision-grade intel: market sizing, 5-year forecasts, pricing, adoption, usage, revenue, and operational KPIs—plus competitor tracking, regulation, and value chains—across 60 countries broadly.

Spot the shifts before they hit your P&L. We track inflection points, adoption curves, pricing moves, and ecosystem plays to show where demand is heading, why it is changing, and what to do next across high-growth markets and disruptive tech

Real-time reads of user behavior. We track shifting priorities, perceptions of today’s and next-gen services, and provider experience, then pace how fast tech moves from trial to adoption, blending buyer, consumer, and channel inputs with social signals (#WhySwitch, #UX).

Partner with our analyst team to build a custom report designed around your business priorities. From analysing market trends to assessing competitors or crafting bespoke datasets, we tailor insights to your needs.
Supplier Intelligence
Discovery & Profiling
Capacity & Footprint
Performance & Risk
Compliance & Governance
Commercial Readiness
Who Supplies Whom
Scorecards & Shortlists
Playbooks & Docs
Category Intelligence
Definition & Scope
Demand & Use Cases
Cost Drivers
Market Structure
Supply Chain Map
Trade & Policy
Operating Norms
Deliverables
Buyer Intelligence
Account Basics
Spend & Scope
Procurement Model
Vendor Requirements
Terms & Policies
Entry Strategy
Pain Points & Triggers
Outputs
Pricing Analysis
Benchmarks
Trends
Should-Cost
Indexation
Landed Cost
Commercial Terms
Deliverables
Brand Analysis
Positioning & Value Prop
Share & Presence
Customer Evidence
Go-to-Market
Digital & Reputation
Compliance & Trust
KPIs & Gaps
Outputs
Full Research Suite comprises of:
Market outlook & trends analysis
Interviews & case studies
Strategic recommendations
Vendor profiles & capabilities analysis
5-year forecasts
8 regions and 60+ country-level data splits
Market segment data splits
12 months of continuous data updates
DELIVERED AS:
PDF EXCEL ONLINE
Endometriosis Treatment Market Size and Share Forecast Outlook 2025 to 2035
End-of-line Packaging Market Size and Share Forecast Outlook 2025 to 2035
End Mill Holders Market Size and Share Forecast Outlook 2025 to 2035
Endocrine Peptides Test Market Size and Share Forecast Outlook 2025 to 2035
Endoscope Protective Barrier Covers Market Size and Share Forecast Outlook 2025 to 2035
Endometrial Cancer Treatment Market Size and Share Forecast Outlook 2025 to 2035
Endovascular Aneurysm Repair (EVAR) Market Size and Share Forecast Outlook 2025 to 2035
End-of-line Packaging Industry Analysis in the United States Size and Share Forecast Outlook 2025 to 2035
Endobronchial Ultrasound Biopsy Market Size and Share Forecast Outlook 2025 to 2035
Endoscope Reprocessing Market Analysis - Size, Share, and Forecast Outlook 2025 to 2035
Endoscopic Probe Disinfection Market Size and Share Forecast Outlook 2025 to 2035
Endovascular Therapy Devices Market Size and Share Forecast Outlook 2025 to 2035
Endoscopic Vessel Harvesting System Market Size, Share, and Forecast 2025 to 2035
Endovenous Laser Therapy Market Size and Share Forecast Outlook 2025 to 2035
Endoscopy Visualization Systems Market Size and Share Forecast Outlook 2025 to 2035
Endoscope Procedure Kits Market Size and Share Forecast Outlook 2025 to 2035
Endoscopy Video Systems Market Size and Share Forecast Outlook 2025 to 2035
Endocrine Testing Market Size and Share Forecast Outlook 2025 to 2035
Endoscopic Ultrasound Needles Market Size and Share Forecast Outlook 2025 to 2035
Endoscopy Fluid Management Systems Market Size and Share Forecast Outlook 2025 to 2035

Thank you!
You will receive an email from our Business Development Manager. Please be sure to check your SPAM/JUNK folder too.
Chat With
MaRIA