

- Market Size (2026)
- USD 174.2 Mn
- Forecast (2036)
- USD 560.7 Mn
- CAGR (2026 to 2036)
- 12.4%
How big is Stubble Breakdown Additives Market in 2026?
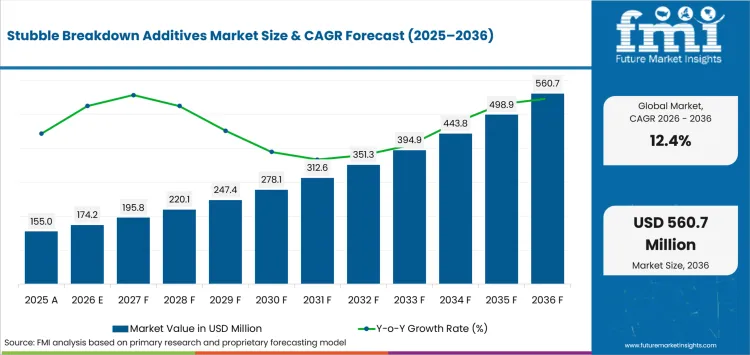
USD 174.2 million in 2026 and USD 560.7 million by 2036 at a 12.4% CAGR.
Demand for stubble breakdown additives is projected to expand at 12.4% CAGR between 2026 and 2036. Valuation is expected to rise from USD 174.2 million in 2026 to USD 560.7 million by 2036 over the forecast period. Large cereal harvests continue to create recurring demand for residue-management solutions across agricultural markets. Eurostat reported German cereal production of 39.1 million tonnes during 2024. Higher crop output translates into larger volumes of straw and stubble left after harvest, increasing the importance of decomposition and field-turnaround practices. Stubble breakdown additives provide growers with a tool for accelerating residue degradation while preserving soil incorporation and supporting preparation for subsequent planting operations.
Country conversion differs according to acreage scale and the usable interval available before planting operations begin. USDA NASS reported in June 2026 that United States growers expected to harvest 87.4 million corn acres for grain. That recurring stalk base gives dealers a larger trial pool than smaller arable systems provide. UK and German growers also compare additives with chopping or cultivation, so soil rejuvenation enzymes must prove incremental value inside an existing residue program.
Key Takeaways of Stubble Breakdown Additives Market
- Demand is projected to rise as retained stubble delays seedbed preparation and growers need faster biological turnover before the next planting operation.
- Cellulolytic enzyme blends are projected to account for 54.1% of product type demand in 2026, supported by direct action on cellulose-rich crop residue.
- By crop type, cereals & grains are estimated to hold 46.9% in 2026 owing to recurring straw and stalk volumes across broadacre rotations.
- Soil application is forecast to represent 40.4% of application method demand in 2026, supported by direct contact between residue and the soil biological zone.
- Variable moisture and temperature can extend decomposition beyond the required planting window, which raises the proof threshold for repeat purchasing.
- Some of the key players in this market include The Mosaic Company, CHS Inc., ADAMA Australia, ZymeCO, SoilBiotics, LLC, Huma, Inc., Converte, and JH Biotech, Inc.
Analyst Perspective
"Stubble breakdown additives deserve a place in the fall program only when field data show faster residue loss within the farm's existing pass schedule. The strongest offers pair crop-specific timing guidance with local dealer trials that compare planter access and residue condition against untreated acres."
- Nikhil Kaitwade, Principal Consultant, Future Market Insights
How is the Stubble Breakdown Additives Market segmented?
The stubble breakdown additives market is segmented by product type, crop type, application method, farm type, sales channel and region.
Product type covers cellulolytic enzyme blends, ligninolytic blends, enzyme + microbe combos and others. Crop type includes cereals & grains, fruits & vegetables, oilseeds & pulses, turf & ornamentals and others. Application method covers soil application, foliar application, fertigation / drip, seed application and others. Farm type distinguishes large commercial farms, mid-size farms, smallholders, greenhouses & nurseries and others. Sales channel includes agri-input distributors, cooperatives, agri-retail chains, online / direct-to-farm and others.
What makes Cellulolytic Enzyme blends central to the Product type category?
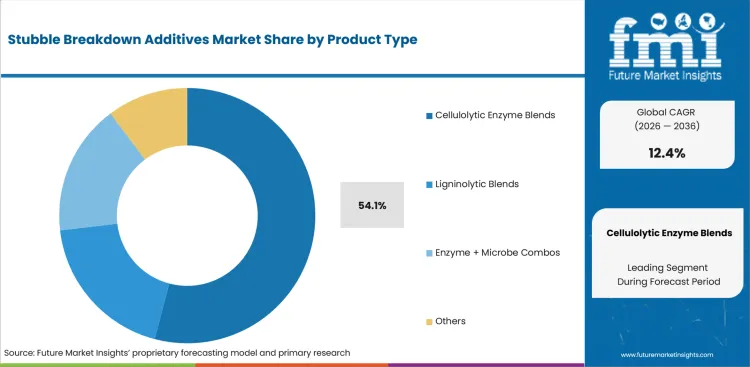
Cellulolytic blends attack the cellulose fraction that keeps cereal straw and corn stalks intact after harvest. Enzyme treatment begins hydrolysis before field microorganisms build enough activity under variable post-harvest operating conditions. That timing advantage also places these products beside enzyme portfolios used where repeatable biochemical action matters before planting.
- By product type, cellulolytic enzyme blends are estimated to hold 54.1% in 2026 owing to direct action on cellulose-rich residue during the narrow post-harvest interval.
- ADAMA Australia introduced RES+ in July 2025 with cellulase and a humectant for low-moisture stubble treatment, giving enzyme-led residue programs current broadacre proof.
Why do Cereals & Grains lead the Crop type category?
Cereal rotations return straw and stalk volumes to the same field each season, so residue management becomes a recurring decision. DEFRA reported in January 2026 that the 2025 UK wheat harvest reached 12.0 million tonnes and produced about 2.6 million tonnes of straw. That volume gives cereal growers a basis for comparing biological treatment with standard chopping and incorporation.
- Cereals & grains are projected to account for 46.9% of crop type demand in 2026, supported by recurring broadacre residue after wheat and coarse-grain harvests.
- Commercial cereal programs also fit sustainable agriculture programs that retain more straw while measuring residue loss against untreated strips before spring drilling.
How does Soil application shape demand within the Application method category?
Soil application places active ingredients beside incorporated or surface residue where moisture and decomposer activity determine turnover. The route can share a scheduled fall spray or residue-conditioning pass, which limits extra field traffic during the narrow post-harvest interval.
- In 2026, soil application is expected to lead application method with 40.4% share because direct residue contact supports treatment across the active soil biological zone.
- Converte reported in January 2025 that its barley Stubble Digest trial recorded 45% mass reduction after 120 days. That field result explains why soil metabolic enzymes and related biological inputs are evaluated around measurable residue loss before sowing.
What supports Large commercial farms within the Farm type category?
Large commercial farms can compare treated and untreated acres under consistent equipment and crop-management routines, making field proof easier to interpret at scale. USDA ERS reported in February 2026 that large-scale family farms represented about 5% of farms but 50% of production value. That concentration gives agronomy teams enough acreage to measure residue treatment across several field blocks.
- Large commercial farms are forecast to represent 41.4% of farm type demand in 2026, supported by standardized application rates across larger field programs.
- Large operations can test residue products beside biostimulant portfolios while tracking planter access and pass reduction across commercial field programs.
What are the drivers, restraints and opportunities in the Stubble Breakdown Additives Market?
High residue loads increase demand, variable field conditions constrain repeatability and proof-led application programs provide the clearest route to recurring orders.
- Driver: Retained straw and stalks become a purchasing problem when residue interferes with seedbed preparation or reduces planting consistency.
- Restraint: Moisture and temperature variability can delay decomposition beyond the operating window that growers require before planting.
- Opportunity: Field protocols that pair residue treatment with an existing spray or cultivation pass can reduce trial friction and support repeat orders.
Residue Retention Raises Turnover Pressure
Growers consider residue additives when chopping leaves enough cereal material to interfere with the following planting operation. USDA NASS reported in January 2025 that United States corn growers produced 14.9 billion bushels during 2024, leaving a recurring residue base across high-output fields. Commercial value rises when agronomists can tie faster turnover to planter access while retaining residue-derived nutrients beside humic acid inputs and related soil programs.
Mechanical Alternatives Raise the Proof Threshold
Residue-additive programs compete with mechanical conditioning whenever growers can spread or disturb stubble using equipment they already know. England's 2026 Farming Equipment and Technology Fund offers 40% support for a six-metre stubble rake that spreads residue and breaks damp straw mats. Additive manufacturers therefore need field evidence showing extra residue loss beyond basic mechanical conditioning during the same post-harvest schedule.
Measured Field Programs Convert Trials into Orders
Residue additives earn repeat business when the field program records an outcome that matters before the following crop. SoilBiotics reported a 2025 Nebraska DgradeR trial that produced a 4.21 bushel-per-acre soybean advantage after corn residue treatment. Comparable proof programs can place agricultural microbial products inside dealer recommendations that compare treatment timing and application cost against untreated acres.
Which country CAGRs are profiled in the Stubble Breakdown Additives Market?
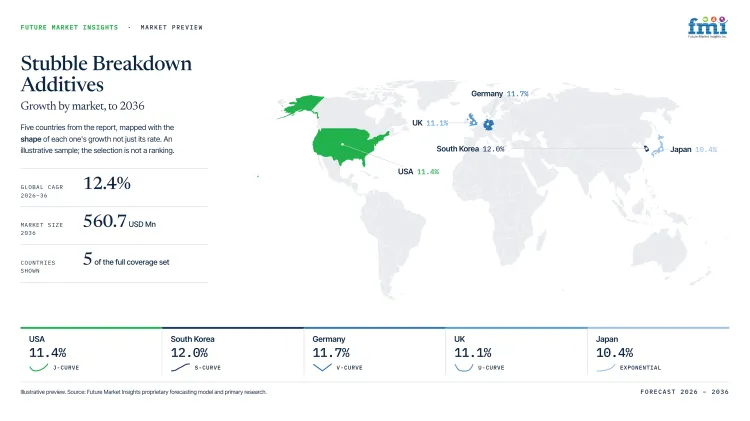
| Country | CAGR |
|---|---|
| South Korea | 12.0% |
| Germany | 11.7% |
| USA | 11.4% |
| UK | 11.1% |
| Japan | 10.4% |
How do country-level CAGRs compare in the Stubble Breakdown Additives Market?
The five profiled markets occupy a narrow 1.6 percentage-point range, with South Korea and Germany forming the upper group. USA and UK follow closely while Japan stays above ten percent, reflecting residue intensity and field-service economics instead of current market size or adoption.
- South Korea paddy protocols coordinate residue treatment with drainage and incorporation timing.
- Germany field trials compare biological turnover against established chopping and incorporation routines.
- USA trial acreage helps dealers measure residue loss across regional tillage programs.
- UK additive trials compete directly with subsidized mechanical residue conditioning before purchase.
- Japan low-complexity programs reduce labor demands across a consolidating national farm-management base.
Similar CAGRs therefore mask different entry conditions because residue loads and service models vary by country. The full report provides country-level CAGR analysis across North America, Latin America, Europe, East Asia, South Asia, Oceania and the Middle East and Africa.
Country-wise Analysis
- United States corn-soybean operations judge residue additives against planter access and the cost of another fall or spring pass across high-stover acres. USDA ERS reported in March 2025 that average farm size reached 466 acres during 2024, giving regional dealers enough acreage for replicated trials beside microbial seed treatments. Stubble breakdown additive demand in USA is forecast to rise at 11.4% CAGR over the forecast period as large farms standardize residue-treatment protocols across multiple field blocks. Moisture differences across corn regions limit repeatability, so distributors need crop-specific timing guidance before one-season demonstrations convert into recurring dealer orders across local territories.
- German cereal farms already use chopping and incorporation routines that give biological residue treatment a familiar mechanical benchmark before planting. Destatis reported in January 2026 that German farms harvested 45 million tonnes of grain during 2025, giving distributors a large recurring residue base for field trials. Regional agronomy networks provide the direct enabler by supporting side-by-side treatment checks under temperate field conditions. Germany is estimated to post 11.7% CAGR over the forecast period because cereal volumes sustain repeated commercial testing. Adoption still depends on proving faster field readiness beyond established cultivation routines, especially after wet harvest periods slow natural residue turnover.
- UK cereal operations cluster strongly in eastern arable regions, where contractors and distributors can support residue treatments across dense cereal acreage. Stubble breakdown additive sales in the United Kingdom are forecast to expand at 11.1% CAGR by 2036, aided by established spray and cultivation services. DEFRA reported in October 2025 that cereal farms represented 36% of holdings in East of England compared with 4.4% in North West, concentrating dealer activity in major arable regions. Wet autumns and variable harvest timing can narrow treatment windows, so products that fit existing post-harvest passes have a clearer route to repeat orders.
- Japanese farm managers increasingly cover larger areas with fewer operating entities, which raises the value of simple post-harvest routines that avoid extra labor. Dealer programs gain traction when one residue treatment fits established seasonal spraying schedules across nearby holdings. MAFF's December 2025 statistical yearbook recorded 883.3 thousand agricultural management entities during 2024 and 3.6 hectares of cultivated land per operating entity. Stubble breakdown additive sales in Japan are forecast to expand at 10.4% CAGR by 2036 as consolidation favors standardized treatment instructions. Small parcels and mountainous logistics raise service costs, leaving compact pack sizes and dependable technical support as practical entry requirements for regional distributors.
- South Korean paddy systems tie residue turnover to drainage and incorporation timing because rice straw must fit a short interval between harvest and the next cultivation cycle. The Ministry of Data and Statistics reported in November 2025 that rice production reached 3.539 million tonnes from 678 thousand hectares during the 2025 season. Adoption of stubble breakdown additives in South Korea is estimated to expand at 12.0% CAGR through 2036 as intensive rice systems preserve a concentrated residue base. Wet-soil variability keeps timing discipline central to repeat purchasing, so local distributors need application guidance aligned with drainage and incorporation schedules through each harvest cycle.
Who are the notable companies in the Stubble Breakdown Additives Market?
The Mosaic Company, CHS Inc., ADAMA Australia, ZymeCO, SoilBiotics, LLC, Huma, Inc., Converte, and JH Biotech, Inc. are the notable companies profiled in this market.
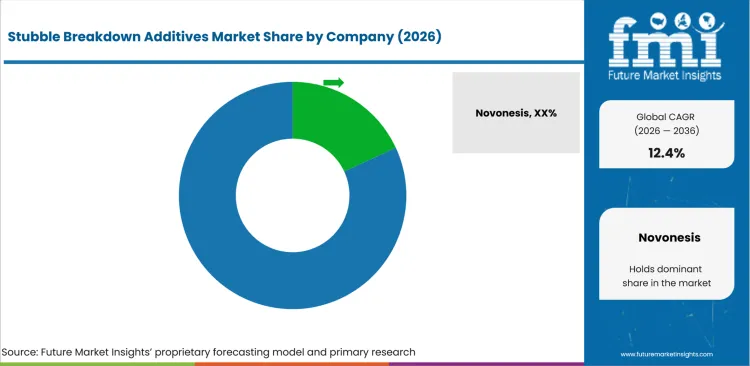
Competition separates direct enzyme residue products from microbial digesters and carbon-supported biological programs serving different field routines. The Mosaic Company and ADAMA Australia document direct enzyme routes while CHS Inc. and SoilBiotics, LLC use biological decomposition programs. ZymeCO extends enzyme commercialization through regional agricultural dealers that can support crop-residue trials before repeat purchasing. Huma, Inc. and Converte link residue turnover with broader seed biostimulant channels and agricultural microbial platforms. JH Biotech, Inc. brings a certified microbial stubble-digester offer to this residue-focused group across regional agricultural markets.
- Enzyme-led residue programs include The Mosaic Company, ADAMA Australia and ZymeCO with direct public evidence tied to residue breakdown.
- Biological residue digesters include CHS Inc., SoilBiotics, LLC and JH Biotech, Inc. across microbial treatment routes supported by different regional commercialization models.
- Carbon-supported biological programs include Huma, Inc. and Converte where residue decomposition is sold beside soil nutrient or microbial activity programs.
Competitive Benchmarking: Stubble Breakdown Additives Market
| Company | Direct Residue Treatment Evidence | Field Integration Evidence | Commercialization Evidence | Geographic Reach |
|---|---|---|---|---|
| The Mosaic Company | High | High | High | Global, including North America and more than 40 countries |
| CHS Inc. | High | High | High | United States cooperative and agronomy network |
| ADAMA Australia | High | High | High | Australia broadacre regions |
| ZymeCO | High | Medium | Medium | United States with Midwest dealer reach |
| SoilBiotics, LLC | High | High | Medium | United States dealer market |
| Huma, Inc. | High | High | Medium | United States regional sales network |
| Converte | High | Medium | Medium | Australia |
| JH Biotech, Inc. | Medium | Medium | Medium | United States with Asia-linked commercial reach |
Scoring basis: High requires direct exact-market evidence across multiple products or field programs, Medium requires narrower documented activity and Low identifies one verified route. Geographic reach records only regions supported by current official evidence and does not influence the capability ratings.
Key Developments in the Stubble Breakdown Additives Market
- In August 2026, The Mosaic Company launched Renuvis Enzara for faster crop-residue decomposition and spring field readiness using endoglucanase enzyme technology.
- In July 2026, ZymeCO closed a USD 4 million Series A financing round to scale enzyme manufacturing and commercial work for agricultural crop-residue management.
- In June 2025, CHS Inc. introduced Velora as a biological crop-residue digester designed to stimulate native fungi and bacteria against cellulose and lignin.
Key Players in the Stubble Breakdown Additives Market
Enzyme-Led Residue Programs
- The Mosaic Company
- ADAMA Australia
- ZymeCO
Biological Residue Digesters
- CHS Inc.
- SoilBiotics, LLC
- JH Biotech, Inc.
Carbon and Microbial-Support Programs
- Huma, Inc.
- Converte
Stubble Breakdown Additives Market - Report Scope
| Coverage field | Report scope |
|---|---|
| Market breakdown | By product type, crop type, application method, farm type, sales channel and region. |
| Quantitative Units | USD Million. |
| Market Definition | Commercial biological and enzyme-based additives used to accelerate breakdown of post-harvest crop stubble and residue within managed field programs. |
| Regions Covered | North America, Latin America, Europe, East Asia, South Asia and Pacific, and Middle East and Africa. |
| Countries Covered | South Korea, Germany, USA, UK, Japan, and 20+ countries included in the full report. |
| Key Companies Profiled | The Mosaic Company, CHS Inc., ADAMA Australia, ZymeCO, SoilBiotics, LLC, Huma, Inc., Converte, and JH Biotech, Inc. |
| Forecast Period | 2026 to 2036. |
| Approach | Primary and secondary research with market triangulation. |
Stubble Breakdown Additives Market - Research Methodology
| Method | Approach |
|---|---|
| Primary Research | FMI analysts gathered input from manufacturers, service providers, technology developers, distributors, end users, procurement teams, and subject-matter experts. Interviews examined purchasing decisions, product or service evaluation, adoption barriers, approval requirements, pricing considerations, and expectations for technical or commercial support. Respondents were also asked what evidence is required before a trial, pilot, or initial order develops into regular purchasing. |
| Desk Research | Desk research covered government statistics, regulatory publications, trade data, industry associations, technical literature, standards, company filings, product information, and official corporate announcements. Sources were reviewed for relevance, publication date, geographic coverage, and consistency with the defined market scope. Claims relating to performance, applications, approvals, capacity, investment, and commercial activity were retained only when supported by credible public evidence. |
| Market Sizing and Forecasting | The market model combined the baseline value with historical performance, segment structure, pricing and volume indicators, adoption levels, company participation, and country-level demand conditions. Forecast assumptions considered economic activity, investment trends, regulatory developments, technology adoption, purchasing cycles, supply availability, and barriers to wider market use. Segment and regional estimates were reconciled before the final market total was calculated. |
| Data Validation | Estimates were checked against multiple independent indicators, including public data, company activity, trade patterns, industry developments, and findings from primary interviews. Validation also tested whether products, services, applications, and company revenues fell within the defined market boundaries. Adjacent categories, unsupported claims, overlapping revenues, and activities without direct market relevance were excluded to reduce double counting and maintain consistency across segments and countries. |
Stubble Breakdown Additives Market by Segments
Stubble Breakdown Additives Market segmented by Product Type:
- Cellulolytic Enzyme Blends
- Ligninolytic Blends
- Enzyme + Microbe Combos
- Others
Stubble Breakdown Additives Market segmented by Crop Type:
- Cereals & Grains
- Fruits & Vegetables
- Oilseeds & Pulses
- Turf & Ornamentals
- Others
Stubble Breakdown Additives Market segmented by Application Method:
- Soil Application
- Foliar Application
- Fertigation / Drip
- Seed Application
- Others
Stubble Breakdown Additives Market segmented by Farm Type:
- Large Commercial Farms
- Mid-Size Farms
- Smallholders
- Greenhouses & Nurseries
- Others
Stubble Breakdown Additives Market segmented by Sales Channel:
- Agri-Input Distributors
- Cooperatives
- Agri-Retail Chains
- Online / Direct-to-Farm
- Others
Stubble Breakdown Additives Market by Region:
- North America
- United States
- Canada
- Latin America
- Brazil
- Mexico
- Chile
- Rest of Latin America
- Western Europe
- Germany
- United Kingdom
- Italy
- Spain
- France
- Nordics
- Benelux
- Rest of Western Europe
- Eastern Europe
- Russia
- Poland
- Hungary
- Balkan and Baltic States
- Rest of Eastern Europe
- East Asia
- China
- Japan
- South Korea
- South Asia and Pacific
- India
- ASEAN
- Australia and New Zealand
- Rest of South Asia and Pacific
- Middle East and Africa
- Kingdom of Saudi Arabia
- Other GCC Countries
- Türkiye
- South Africa
- Other African Union Countries
- Rest of Middle East and Africa
Research Sources and Bibliography
- Eurostat. (2025, October 27). Agricultural production - crops.
- USA Department of Agriculture, National Agricultural Statistics Service. (2026, June 30). Acreage.
- ADAMA Australia. (2025, July 24). ADAMA adds unique stubble management solution for multiple cropping benefits.
- Department for Environment, Food & Rural Affairs. (2026, January 20). Cereal and oilseed production in the United Kingdom 2025.
- Converte. (2025, January). Converte Newsletter.
- USA Department of Agriculture, Economic Research Service. (2026, February 5). Farming and Farm Income.
- USA Department of Agriculture, National Agricultural Statistics Service. (2025, January 10). Corn production down, soybean production up in 2024.
- Rural Payments Agency. (2026, May 12). Productivity items and specifications - Farming Equipment and Technology Fund (FETF) 2026.
- SoilBiotics, LLC. (2025). Trials and Farmer Stories.
- USA Department of Agriculture, Economic Research Service. (2025, March 12). The number of USA farms continues slow decline.
- Department for Environment, Food & Rural Affairs. (2025, October 30). Agricultural facts: Summary.
- German Federal Statistical Office (Destatis). (2026, January 23). 2025 grain and potato harvest: 45 million tons of grain and 14 million tons of potatoes.
- Ministry of Agriculture, Forestry and Fisheries of Japan. (2025, December). The 99th Statistical Yearbook of Ministry of Agriculture, Forestry and Fisheries.
- Ministry of Data and Statistics, Republic of Korea. (2025, November 13). Final Results of the Cultivated Area and Production of Rice in 2025.
- The Mosaic Company. (2026, August 17). Mosaic Biosciences Launches New Product to Accelerate Crop Residue Breakdown and Improve Spring Field Readiness.
- ZymeCO. (2026, July 1). ZymeCO Raises $4 Million Series A to Scale Enzyme Bio-Manufacturing for Turf Management and Agricultural Crop Residue Management.
- CHS Agronomy. (2025, June 13). CHS launches new solutions for the season ahead.
- ZymeCO. (2026, July 14). Dynamic Cropping Systems Bringing Enzyme Technology to Growers Across the Midwest.
- CHS Inc. (2025, November 3). 5 fall fertilizer strategies.
- Huma, Inc. (2025, August 18). Huma: Fall Fertility.
- JH Biotech, Inc. (2025, September 3). The ICM Alliance at 2025 Taiwan Smart Agriculture Week.
- The Mosaic Company. (2026, February 27). Annual Report on Form 10-K for the year ended December 31, 2025.
- Meristem Crop Performance. (2025, August 6). Meristem’s Breakthrough to Excellence set the stage for a big year ahead.
- BW Fusion. (2026, January 9). BW Fusion Acquires Low Mu Tech, Strengthening Leadership in Crop Nutrition and Seed Care Innovation.
- Tidal Grow AgriScience. (2025, July 8). Tidal Grow® AgriScience Establishes Formulator Strategic Alliance to Lead Crop Input Innovation Delivery.
- Agricen. (2025, September 2). Loveland Products Launches EXTRACT XC to Advance Residue and Nutrient Management Efficiency.
This bibliography is provided for reader reference and is not exhaustive. The full report contains the complete reference list and detailed citations
This Report Answers
- How large is the stubble breakdown additives market in 2026 and 2036?
- What operating conditions are increasing demand for faster crop-residue turnover?
- Why do cellulolytic enzyme blends account for 54.1% of product type demand in 2026?
- Why do cereals & grains account for 46.9% of crop type demand in 2026?
- How does soil application fit existing post-harvest field operations?
- What limits repeat purchasing when decomposition rates vary with field moisture?
- How do country growth rates differ across the five profiled stubble breakdown additives markets?
- Which companies have direct evidence of enzyme or microbial crop-residue treatment?
- How much incremental value is projected between 2026 and 2036?
Frequently Asked Questions
How big is the Stubble Breakdown Additives Market in 2026?
The stubble breakdown additives market is valued at USD 174.2 million in 2026 and is projected to reach USD 560.7 million by 2036. Growth is supported by recurring residue loads that interfere with timely seedbed preparation across broadacre cereal and grain production systems.
What is the CAGR of the Stubble Breakdown Additives Market from 2026 to 2036?
The stubble breakdown additives market is projected to grow at a CAGR of 12.4% between 2026 and 2036. Expansion is supported by retained stubble volumes and demand for faster biological turnover before planting.
Which product type leads the Stubble Breakdown Additives Market?
The cellulolytic enzyme blends segment is expected to hold 54.1% of the stubble breakdown additives market in 2026, driven by direct action on cellulose-rich residue. These formulations fit time-sensitive post-harvest treatment programs that require measurable residue loss before planting across commercial field operations.
Which crop type leads the Stubble Breakdown Additives Market?
The cereals & grains segment is expected to hold 46.9% of the stubble breakdown additives market in 2026, supported by recurring straw and stalk volumes across broadacre rotations. Repeated residue loads keep post-harvest treatment relevant each season for commercial cereal and grain growers.
How much value will the Stubble Breakdown Additives Market add between 2026 and 2036?
The stubble breakdown additives market is expected to add USD 386.5 million in value between 2026 and 2036. Growth reflects recurring broadacre residue management needs and greater commercial proof for enzyme-led field programs.
Which countries are projected to record the highest growth in the Stubble Breakdown Additives Market?
South Korea is projected to grow at 12.0% CAGR in the stubble breakdown additives market, followed by Germany at 11.7% and USA at 11.4% through 2036. Growth is supported by recurring residue volumes and local field-service capacity across cereal and paddy systems.
Which companies are active in the Stubble Breakdown Additives Market?
Key companies operating in the stubble breakdown additives market include The Mosaic Company, CHS Inc., ADAMA Australia, ZymeCO, SoilBiotics, LLC, Huma, Inc., Converte, and JH Biotech, Inc. The eight companies span enzyme technology and microbial treatment while dealer support determines local field conversion.
Preview the report firsthand - request a free sample
Get SampleGet the brochure for pricing and purchase details.
Get PDFTable of Content
- Key Takeaways
- Market Size and CAGR
- Top Growth Driver
- Fastest Growing Segment
- Leading Region
- Key Companies
- Emerging Opportunities
- Executive Summary
- Global Market Outlook
- Demand-side Trends
- Supply-side Trends
- Technology Roadmap Analysis
- Analysis and Recommendations
- Analyst Perspective (What is happening? Why now? What should investors know?)
- Key Questions Answered
- How large is the market?
- What is the CAGR?
- What are key trends?
- Which region dominates?
- Who are the leaders?
- Market Overview
- Market Coverage / Taxonomy
- Market Definition / Scope / Limitations
- Research Methodology
- Chapter Orientation
- Analytical Lens and Working Hypotheses
- Market Structure, Signals, and Trend Drivers
- Benchmarking and Cross-market Comparability
- Market Sizing, Forecasting, and Opportunity Mapping
- Research Design and Evidence Framework
- Desk Research Programme (Secondary Evidence)
- Expert Input and Fieldwork (Primary Evidence)
- Tooling, Models, and Reference Databases
- Data Engineering and Model Build
- Quality Assurance and Audit Trail
- Market Background
- Market Dynamics (Drivers, Restraints, Opportunity, Trends)
- Scenario Forecast (Optimistic, Likely, Conservative)
- Impact Analysis
- AI Impact
- Sustainability Impact
- Regulatory Impact
- Technology Impact
- Consumer / Buyer Analysis
- Purchase Drivers
- Adoption Barriers
- Buyer Journey
- Opportunity Map Analysis
- Product Life Cycle Analysis
- Supply Chain Analysis
- Investment Feasibility Matrix
- Value Chain Analysis
- PESTLE and Porter's Analysis
- Regulatory Landscape
- Regional Parent Market Outlook
- Production and Consumption Statistics
- Import and Export Statistics
- Global Market Analysis and Forecast, 2021 to 2036
- Historical Market Size Value (USD Million) Analysis, 2021 to 2025
- Current and Future Market Size Value (USD Million) Projections, 2026 to 2036
- Y-o-Y Growth Trend Analysis
- Absolute $ Opportunity Analysis
- Global Market Pricing Analysis, 2021 to 2036
- Global Market Analysis and Forecast, By Product Type, 2021 to 2036
- Introduction / Key Findings
- Historical Market Size Value (USD Million) Analysis By Product Type, 2021 to 2025
- Current and Future Market Size Value (USD Million) Analysis and Forecast By Product Type, 2026 to 2036
- Cellulolytic Enzyme Blends
- Ligninolytic Blends
- Enzyme + Microbe Combos
- Others
- Cellulolytic Enzyme Blends
- Y-o-Y Growth Trend Analysis By Product Type, 2021 to 2025
- Absolute $ Opportunity Analysis By Product Type, 2026 to 2036
- Global Market Analysis and Forecast, By Crop Type, 2021 to 2036
- Introduction / Key Findings
- Historical Market Size Value (USD Million) Analysis By Crop Type, 2021 to 2025
- Current and Future Market Size Value (USD Million) Analysis and Forecast By Crop Type, 2026 to 2036
- Cereals & Grains
- Fruits & Vegetables
- Oilseeds & Pulses
- Turf & Ornamentals
- Others
- Cereals & Grains
- Y-o-Y Growth Trend Analysis By Crop Type, 2021 to 2025
- Absolute $ Opportunity Analysis By Crop Type, 2026 to 2036
- Global Market Analysis and Forecast, By Application Method, 2021 to 2036
- Introduction / Key Findings
- Historical Market Size Value (USD Million) Analysis By Application Method, 2021 to 2025
- Current and Future Market Size Value (USD Million) Analysis and Forecast By Application Method, 2026 to 2036
- Soil Application
- Foliar Application
- Fertigation / Drip
- Seed Application
- Others
- Soil Application
- Y-o-Y Growth Trend Analysis By Application Method, 2021 to 2025
- Absolute $ Opportunity Analysis By Application Method, 2026 to 2036
- Global Market Analysis and Forecast, By Farm Type, 2021 to 2036
- Introduction / Key Findings
- Historical Market Size Value (USD Million) Analysis By Farm Type, 2021 to 2025
- Current and Future Market Size Value (USD Million) Analysis and Forecast By Farm Type, 2026 to 2036
- Large Commercial Farms
- Mid-Size Farms
- Smallholders
- Greenhouses & Nurseries
- Others
- Large Commercial Farms
- Y-o-Y Growth Trend Analysis By Farm Type, 2021 to 2025
- Absolute $ Opportunity Analysis By Farm Type, 2026 to 2036
- Global Market Analysis and Forecast, By Sales Channel, 2021 to 2036
- Introduction / Key Findings
- Historical Market Size Value (USD Million) Analysis By Sales Channel, 2021 to 2025
- Current and Future Market Size Value (USD Million) Analysis and Forecast By Sales Channel, 2026 to 2036
- Agri-Input Distributors
- Cooperatives
- Agri-Retail Chains
- Online / Direct-to-Farm
- Others
- Agri-Input Distributors
- Y-o-Y Growth Trend Analysis By Sales Channel, 2021 to 2025
- Absolute $ Opportunity Analysis By Sales Channel, 2026 to 2036
- Global Market Analysis and Forecast, By Region, 2021 to 2036
- Introduction
- Historical Market Size Value (USD Million) Analysis By Region, 2021 to 2025
- Current Market Size Value (USD Million) Analysis and Forecast By Region, 2026 to 2036
- North America
- Latin America
- Western Europe
- Eastern Europe
- East Asia
- South Asia and Pacific
- Middle East & Africa
- Market Attractiveness Analysis By Region
- North America Market Analysis and Forecast, By Country, 2021 to 2036
- Historical Market Size Value (USD Million) Trend Analysis By Market Taxonomy, 2021 to 2025
- Market Size Value (USD Million) Forecast By Market Taxonomy, 2026 to 2036
- By Country
- USA
- Canada
- By Product Type
- By Crop Type
- By Application Method
- By Farm Type
- By Sales Channel
- By Country
- Market Attractiveness Analysis
- By Country
- By Product Type
- By Crop Type
- By Application Method
- By Farm Type
- By Sales Channel
- Key Takeaways
- Latin America Market Analysis and Forecast, By Country
- Historical Market Size Value (USD Million) Trend Analysis By Market Taxonomy, 2021 to 2025
- Market Size Value (USD Million) Forecast By Market Taxonomy, 2026 to 2036
- By Country
- Brazil
- Mexico
- Chile
- Rest of Latin America
- By Product Type
- By Crop Type
- By Application Method
- By Farm Type
- By Sales Channel
- By Country
- Market Attractiveness Analysis
- By Country
- By Product Type
- By Crop Type
- By Application Method
- By Farm Type
- By Sales Channel
- Key Takeaways
- Western Europe Market Analysis and Forecast, By Country
- Historical Market Size Value (USD Million) Trend Analysis By Market Taxonomy, 2021 to 2025
- Market Size Value (USD Million) Forecast By Market Taxonomy, 2026 to 2036
- By Country
- Germany
- UK
- Italy
- Spain
- France
- Nordic
- BENELUX
- Rest of Western Europe
- By Product Type
- By Crop Type
- By Application Method
- By Farm Type
- By Sales Channel
- By Country
- Market Attractiveness Analysis
- By Country
- By Product Type
- By Crop Type
- By Application Method
- By Farm Type
- By Sales Channel
- Key Takeaways
- Eastern Europe Market Analysis and Forecast, By Country
- Historical Market Size Value (USD Million) Trend Analysis By Market Taxonomy, 2021 to 2025
- Market Size Value (USD Million) Forecast By Market Taxonomy, 2026 to 2036
- By Country
- Russia
- Poland
- Hungary
- Balkan & Baltic
- Rest of Eastern Europe
- By Product Type
- By Crop Type
- By Application Method
- By Farm Type
- By Sales Channel
- By Country
- Market Attractiveness Analysis
- By Country
- By Product Type
- By Crop Type
- By Application Method
- By Farm Type
- By Sales Channel
- Key Takeaways
- East Asia Market Analysis and Forecast, By Country
- Historical Market Size Value (USD Million) Trend Analysis By Market Taxonomy, 2021 to 2025
- Market Size Value (USD Million) Forecast By Market Taxonomy, 2026 to 2036
- By Country
- China
- Japan
- South Korea
- By Product Type
- By Crop Type
- By Application Method
- By Farm Type
- By Sales Channel
- By Country
- Market Attractiveness Analysis
- By Country
- By Product Type
- By Crop Type
- By Application Method
- By Farm Type
- By Sales Channel
- Key Takeaways
- South Asia and Pacific Market Analysis and Forecast, By Country
- Historical Market Size Value (USD Million) Trend Analysis By Market Taxonomy, 2021 to 2025
- Market Size Value (USD Million) Forecast By Market Taxonomy, 2026 to 2036
- By Country
- India
- ASEAN
- Australia & New Zealand
- Rest of South Asia and Pacific
- By Product Type
- By Crop Type
- By Application Method
- By Farm Type
- By Sales Channel
- By Country
- Market Attractiveness Analysis
- By Country
- By Product Type
- By Crop Type
- By Application Method
- By Farm Type
- By Sales Channel
- Key Takeaways
- Middle East & Africa Market Analysis and Forecast, By Country
- Historical Market Size Value (USD Million) Trend Analysis By Market Taxonomy, 2021 to 2025
- Market Size Value (USD Million) Forecast By Market Taxonomy, 2026 to 2036
- By Country
- Kingdom of Saudi Arabia
- Other GCC Countries
- Türkiye
- South Africa
- Other African Union
- Rest of Middle East & Africa
- By Product Type
- By Crop Type
- By Application Method
- By Farm Type
- By Sales Channel
- By Country
- Market Attractiveness Analysis
- By Country
- By Product Type
- By Crop Type
- By Application Method
- By Farm Type
- By Sales Channel
- Key Takeaways
- Key Countries Market Analysis
- USA
- Pricing Analysis
- Market Share Analysis, 2025
- By Product Type
- By Crop Type
- By Application Method
- By Farm Type
- By Sales Channel
- Canada
- Pricing Analysis
- Market Share Analysis, 2025
- By Product Type
- By Crop Type
- By Application Method
- By Farm Type
- By Sales Channel
- Mexico
- Pricing Analysis
- Market Share Analysis, 2025
- By Product Type
- By Crop Type
- By Application Method
- By Farm Type
- By Sales Channel
- Brazil
- Pricing Analysis
- Market Share Analysis, 2025
- By Product Type
- By Crop Type
- By Application Method
- By Farm Type
- By Sales Channel
- Chile
- Pricing Analysis
- Market Share Analysis, 2025
- By Product Type
- By Crop Type
- By Application Method
- By Farm Type
- By Sales Channel
- Germany
- Pricing Analysis
- Market Share Analysis, 2025
- By Product Type
- By Crop Type
- By Application Method
- By Farm Type
- By Sales Channel
- UK
- Pricing Analysis
- Market Share Analysis, 2025
- By Product Type
- By Crop Type
- By Application Method
- By Farm Type
- By Sales Channel
- Italy
- Pricing Analysis
- Market Share Analysis, 2025
- By Product Type
- By Crop Type
- By Application Method
- By Farm Type
- By Sales Channel
- Spain
- Pricing Analysis
- Market Share Analysis, 2025
- By Product Type
- By Crop Type
- By Application Method
- By Farm Type
- By Sales Channel
- France
- Pricing Analysis
- Market Share Analysis, 2025
- By Product Type
- By Crop Type
- By Application Method
- By Farm Type
- By Sales Channel
- India
- Pricing Analysis
- Market Share Analysis, 2025
- By Product Type
- By Crop Type
- By Application Method
- By Farm Type
- By Sales Channel
- ASEAN
- Pricing Analysis
- Market Share Analysis, 2025
- By Product Type
- By Crop Type
- By Application Method
- By Farm Type
- By Sales Channel
- Australia & New Zealand
- Pricing Analysis
- Market Share Analysis, 2025
- By Product Type
- By Crop Type
- By Application Method
- By Farm Type
- By Sales Channel
- China
- Pricing Analysis
- Market Share Analysis, 2025
- By Product Type
- By Crop Type
- By Application Method
- By Farm Type
- By Sales Channel
- Japan
- Pricing Analysis
- Market Share Analysis, 2025
- By Product Type
- By Crop Type
- By Application Method
- By Farm Type
- By Sales Channel
- South Korea
- Pricing Analysis
- Market Share Analysis, 2025
- By Product Type
- By Crop Type
- By Application Method
- By Farm Type
- By Sales Channel
- Russia
- Pricing Analysis
- Market Share Analysis, 2025
- By Product Type
- By Crop Type
- By Application Method
- By Farm Type
- By Sales Channel
- Poland
- Pricing Analysis
- Market Share Analysis, 2025
- By Product Type
- By Crop Type
- By Application Method
- By Farm Type
- By Sales Channel
- Hungary
- Pricing Analysis
- Market Share Analysis, 2025
- By Product Type
- By Crop Type
- By Application Method
- By Farm Type
- By Sales Channel
- Kingdom of Saudi Arabia
- Pricing Analysis
- Market Share Analysis, 2025
- By Product Type
- By Crop Type
- By Application Method
- By Farm Type
- By Sales Channel
- Türkiye
- Pricing Analysis
- Market Share Analysis, 2025
- By Product Type
- By Crop Type
- By Application Method
- By Farm Type
- By Sales Channel
- South Africa
- Pricing Analysis
- Market Share Analysis, 2025
- By Product Type
- By Crop Type
- By Application Method
- By Farm Type
- By Sales Channel
- USA
- Market Structure Analysis
- Competition Dashboard
- Competition Benchmarking
- Market Share Analysis of Top Players
- By Regional
- By Product Type
- By Crop Type
- By Application Method
- By Farm Type
- By Sales Channel
- Emerging Startups
- Innovation Benchmarking
- Competition Analysis
- Competition Deep Dive
- Novonesis
- Overview
- Product Portfolio
- Profitability by Market Segments
- Sales Footprint
- Strategy Overview
- Marketing Strategy
- Product Strategy
- Channel Strategy
- BASF
- Locus Agricultural Solutions
- Loam Bio
- UPL (NPP)
- Biodyne
- TerraMax
- Verdesian Life Sciences
- Novonesis
- Case Studies
- Success Stories
- Recent Developments
- Competition Deep Dive
- Assumptions & Acronyms Used


