

- Market Size (2026)
- USD 860.6 Mn
- Forecast (2036)
- USD 1512.4 Mn
- CAGR (2026 to 2036)
- 5.8%
How big is Surface Profilers Market in 2026?
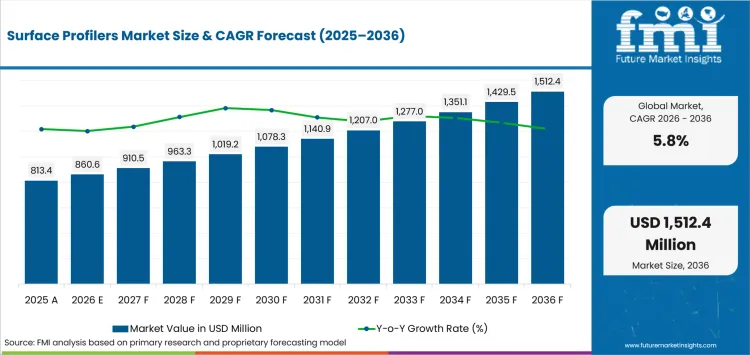
USD 860.6 million in 2026 and USD 1,512.4 million by 2036 at a 5.8% CAGR.
Demand for surface profilers is projected to expand at 5.8% CAGR between 2026 and 2036, increasing valuation from USD 860.6 million in 2026 to USD 1512.4 million by 2036. Factory quality teams place profilometer systems closer to machining as roughness results can guide immediate acceptance or rework. Mahr introduced the MarSurf MC 510 in April 2025 for in-machine roughness measurement, connecting metrology systems directly with CNC production control.
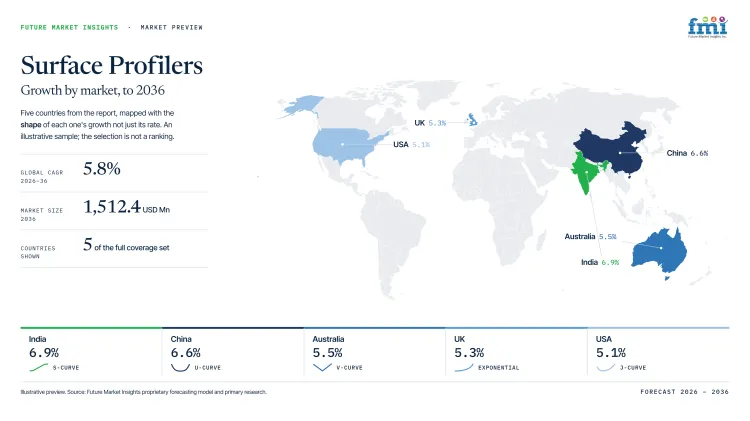
The United Kingdom’s 5.3% CAGR is predicted to be above Germany’s 4.9% CAGR and Japan’s 4.6% CAGR through 2036 as recurring local-road surveys maintain active surface-condition measurement. The Department for Transport reported in January 2026 that 5% of local A roads and 7% of B and C roads were classified red during 2025. The maintenance burden sustains recurring profile measurement even as survey technologies change across local road programs.
Key Takeaways of Surface Profilers Market
- Recurring road-condition surveys and production quality checks are expected to sustain demand for surface profilers across field and industrial measurement workflows.
- Based on profiler type, laser profilers are projected to account for 29.0% in 2026 due to repeatable non-contact measurement without stylus wear.
- The mobility category is forecast to be led by vehicle-mounted systems at 34.0% share in 2026, supported by continuous collection across long survey corridors.
- By application, road pavement testing is estimated to hold 31.0% in 2026 owing to recurring roughness and rutting requirements in maintenance programs.
- Calibration burden and cross-technology comparability are expected to lengthen qualification cycles for unfamiliar profiling systems entering recurring operational use.
- Dynatest A/S, Ames Engineering LLC, Greenwood Engineering A/S, International Cybernetics Company LP (ICC-IMS), FARO Technologies under AMETEK, Mitutoyo Corporation, Taylor Hobson Ltd and Mahr GmbH represent the eight profiled companies.
Analyst Perspective
“A surface profiler earns its place once measurement results can release a road section or machined part with confidence. Road programs prioritize repeatable geometry, whereas factory teams weigh surface-finish detail against setup time and calibration traceability.”
- Nikhil Kaitwade, Principal Consultant, Future Market Insights
How is the Surface Profilers Market segmented?
The surface profilers market is segmented by profiler type, output, mobility, application, sales channel and region.
The surface profilers market covers profiler type with laser profilers, inertial road profilers, contact profilometers, walking profilers and 3D surface profilers. Output includes IRI or roughness, flatness or levelness, texture depth, cross slope or rutting and 3D surface mapping. Mobility covers vehicle-mounted, cart-mounted, handheld or portable and benchtop or lab systems. Applications include road pavement testing, industrial floors, concrete slabs, airport runways and research or QA labs. Sales channels are direct OEM, testing distributors, calibration or service and rental channel.
What makes laser profilers central to the profiler type category?
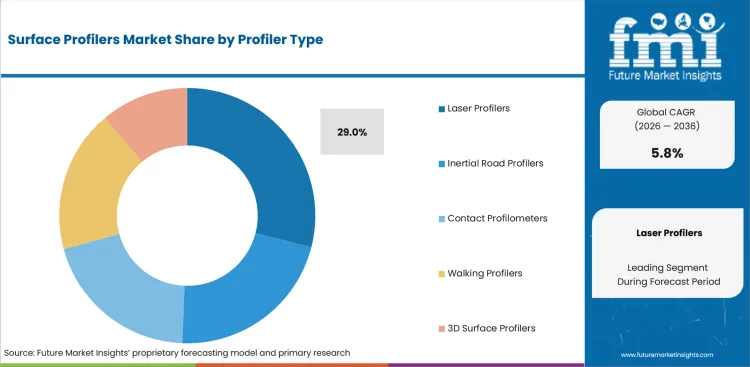
Laser profilers collect pavement or component geometry without physical contact, which removes stylus wear from repeated road and production inspection. Germany’s Federal Ministry for Transport reported in May 2025 that federal-road assessment covers about 100 thousand evaluation kilometers every four years using fast measurement vehicles with laser techniques.
- Based on profiler type, laser profilers are projected to account for 29.0% in 2026 due to repeatable non-contact capture across long inspection routes.
- Road survey teams compare calibration stability across speed and reflectivity as optical sensors must preserve profile consistency beyond controlled laboratory conditions during repeated network and factory inspection.
How does IRI or roughness shape selection within the output category?
IRI or roughness converts longitudinal profile data into a repeatable condition measure used across scheduled road surveys. A consistent output lets agencies compare deterioration between collection rounds without changing the condition metric or maintenance threshold used by the program.
- The output category is forecast to be led by IRI or roughness at 26.0% share in 2026, supported by established ride-quality reporting.
- Federal Highway Administration tables published in November 2025 recorded 851.3 thousand federal-aid miles with roughness or serviceability data. That reporting scale keeps comparable distance measurement central to test and measurement sensors used for recurring network surveys.
What supports demand for vehicle-mounted systems within the mobility category?
Department for Transport guidance updated in January 2026 states that automated road-condition surveys use vehicles with mounted lasers and cameras across England’s classified network. Vehicle-mounted profiling combines those surface sensors with positioning and distance references for network-scale collection at normal traffic speeds across long maintenance corridors.
- Vehicle-mounted systems are likely to capture 34.0% share in 2026 attributable to continuous data collection across long survey corridors.
- Field teams control mounting geometry and calibration drift as 3D laser scanners extend location-aware geometry review across complex surface records and repeated network-level survey programs with consistent longitudinal and transverse referencing.
What drives road pavement testing within the application category?
Road pavement testing converts longitudinal and transverse profile measurements into maintenance priorities or contractor acceptance records. Field teams need repeatability across roughness and rut depth without confusing surface geometry with material-property testing.
- By application, road pavement testing is forecast to represent 31.0% in 2026 driven by formal condition reporting across maintenance programs.
- Pavement testing equipment uses profile outputs for road-condition and contractor-acceptance decisions across scheduled programs. Asphalt testing equipment addresses material properties that sit outside the profiler’s measurement role. Japan’s Ministry of Land Infrastructure Transport and Tourism opened an October 2025 solicitation for technologies measuring cracking rate plus rut depth and IRI.
What are the drivers, restraints and opportunities in the Surface Profilers Market?
Recurring surveys and production checks are expected to sustain demand, with calibration comparability limiting switching as local application support shortens qualification for new profiling workflows.
- Driver: Recurring road surveys and production quality checks are expected to sustain replacement demand for profiling hardware and analysis software.
- Restraint: Calibration and cross-technology comparability requirements are anticipated to slow qualification of unfamiliar profilers within established reporting programs.
- Opportunity: Local application support and portable instruments are expected to shorten system evaluation for production cells and smaller field assignments.
National Road Surveys Sustain Recurring Measurement Demand
Road agencies increasingly specify measured surface outputs within recurring pavement inspection and reporting programs. Japan’s Ministry of Land Infrastructure Transport and Tourism reported in April 2026 that its catalog listed 55 pavement technologies measuring cracking rate plus rut depth and IRI. The larger qualified pool is expected to widen competition and make measurement performance central to procurement.
Calibration and Comparability Slow Technology Substitution
Surface-profiler manufacturers must preserve comparable outputs as instruments move between vehicles or established reporting systems. Qualification effort is expected to favor platforms that maintain repeatable calibration within existing survey databases.
Local Application Support Shortens Industrial Qualification
Compact profilers can move selected surface checks closer to production equipment or smaller field assignments without dedicated laboratories. AMETEK opened its Milan Customer Solutions Center in January 2025 with testing and demonstration capacity that includes Taylor Hobson technologies. Local application support is expected to help factory teams compare optical measuring systems during qualification and subsequent deployment.
Which country CAGRs are profiled in the Surface Profilers Market?
| Country | CAGR |
|---|---|
| Australia | 5.5% |
| United Kingdom | 5.3% |
| United States | 5.1% |
| Germany | 4.9% |
| Japan | 4.6% |
How do country-level CAGRs compare in the Surface Profilers Market?
The five profiled country CAGRs form a narrow overall band with Australia and the United Kingdom in the upper group. The United States sits between that group and the slower Germany-Japan pair. The 0.9-point spread reflects different survey mandates and service conditions instead of current market size or installed fleets.
- Australia’s long paved corridors increase field-service exposure across dispersed road-condition programs nationally.
- United Kingdom growth is tied to PAS 2161 approval and comparable survey outputs.
- Federal reporting keeps IRI measurement embedded within recurring network-condition programs in the United States.
- Germany combines scheduled federal surveys with a mature industrial surface-metrology base nationwide.
- Japan uses performance catalogs to qualify pavement inspection technologies against defined measurement outputs.
Comparable CAGRs therefore mask different qualification and service requirements for market entry. The full report provides country-level CAGR analysis across North America, Latin America, Europe, East Asia, South Asia, Oceania and the Middle East and Africa.
Country-wise Analysis
- Australia’s dispersed paved-road network makes survey travel and instrument service part of the operating cost for state maintenance programs as vehicle-mounted systems reduce repeated setup across long regional corridors and remote maintenance assignments. The Bureau of Infrastructure and Transport Research Economics reported in December 2025 that Australia had 476 thousand kilometers of paved roads in 2024, giving contractors a large recurring field base for profile collection and maintenance planning. Australia is estimated to post 5.5% CAGR over the forecast period, supported by recurring condition surveys that reward portable calibration and dependable spare-part coverage despite long travel times between regional assignments.
- United Kingdom road authorities are moving toward PAS 2161 condition monitoring, which gives approved technologies a common route into local-road survey programs and raises the evidence required for comparable outputs. United Kingdom’s surface profilers market outlook is anticipated to advance at 5.3% CAGR over the assessment period, aided by the Department for Transport’s September 2025 update that requires approved PAS 2161 technologies for funded local-road surveys. Survey contractors need stable calibration and data conversion across mixed legacy records, so service teams that maintain comparable outputs are better placed to convert technology approval into recurring orders across local authority contracts nationwide.
- United States road agencies operate large recurring pavement-reporting programs that link roughness data with federal condition reporting and state-level acceptance testing across rehabilitation cycles and scheduled maintenance planning for heavily used highway corridors. Surface profiler sales in the United States are forecast to expand at 5.1% CAGR by 2036, supported by continuing network measurement and established contractor use across federal and state highway programs with recurring route coverage. The Federal Highway Administration reported in November 2025 that rural National Highway System roughness reporting covered 127.6 thousand miles in 2024, but state-specific specifications can extend qualification for instruments moving between transportation departments.
- Germany combines scheduled federal road assessment with an established industrial metrology base, giving surface profilers two routes into public infrastructure surveys and factory inspection across transportation and manufacturing programs. The Federal Ministry for Transport stated in May 2025 that ZEB pavement measurements are commissioned every four years, giving road authorities a recurring national route for comparable surface-condition data and maintenance prioritization. Surface profiler demand in Germany is forecast to rise at 4.9% CAGR over the forecast period, shaped by replacement activity that favors traceable measurement as local calibration and service remain necessary for qualification across road and industrial accounts nationwide.
- Japanese measurement teams can connect portable roughness instruments with software-led data review, which supports factory use beyond fixed laboratory stations and reduces manual result transfer between inspection steps across distributed production sites. Mitutoyo released smartphone and PC software for its SJ-220 surface roughness instrument in January 2025, giving Japanese users another local route for managing measured profiles outside the instrument screen during routine shop-floor inspection. Adoption of surface profilers in Japan is estimated to expand at 4.6% CAGR through 2036, influenced by wider digital measurement workflows as formal road-inspection qualification and regional service coverage limit rapid substitution across local authority programs.
Who are the notable companies in the Surface Profilers Market?
Dynatest A/S, Ames Engineering LLC, Greenwood Engineering A/S, International Cybernetics Company LP (ICC-IMS), FARO Technologies under AMETEK, Mitutoyo Corporation, Taylor Hobson Ltd and Mahr GmbH are the notable companies serving this market.
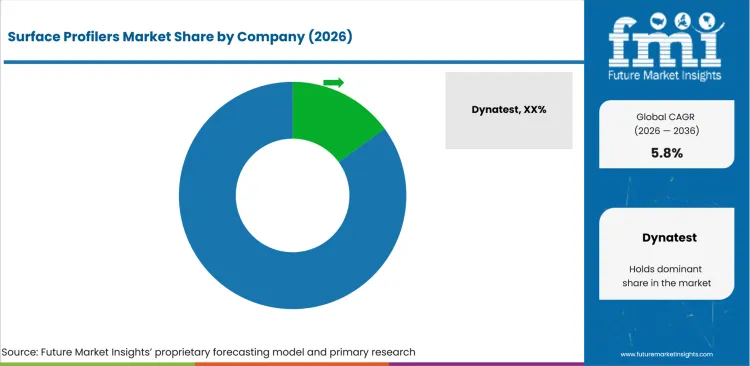
Road agencies compare high-speed profile capture and data conversion, whereas factory quality teams weigh surface detail against calibration support. Entry barriers therefore differ by application and remain tied to documented measurement performance plus local service.
- Dynatest A/S and Ames Engineering LLC focus on pavement profiling as Greenwood Engineering A/S and ICC-IMS combine mobile profilers with road-data workflows.
- FARO Technologies under AMETEK and Mitutoyo Corporation span broader 3D inspection workflows that connect surface geometry with coordinate measuring machine records.
- Taylor Hobson Ltd and Mahr GmbH concentrate on surface form and roughness measurement for industrial teams using test and measurement equipment.
Competitive Benchmarking: Surface Profilers Market
| Company | Surface Measurement Breadth | Data Analysis Depth | Calibration and Application Support | Geographic Reach |
|---|---|---|---|---|
| Dynatest A/S | High | High | Medium | Global |
| Ames Engineering LLC | High | Medium | Medium | North America and international sales |
| Greenwood Engineering A/S | High | Medium | Medium | Global |
| International Cybernetics Company LP (ICC-IMS) | High | High | Medium | North America and international projects |
| FARO Technologies under AMETEK | High | High | High | Global |
| Mitutoyo Corporation | Medium | Medium | High | Global |
| Taylor Hobson Ltd | High | High | High | Global |
| Mahr GmbH | High | Medium | High | Global |
Key Developments in the Surface Profilers Market
- In January 2026, Taylor Hobson Ltd introduced automatic centering and leveling for LUPHOScan 260 with non-contact 3D measurement and part alignment reported near 90 seconds.
- In November 2025, Mahr Inc. introduced the MarSurf M 510 Series for mobile roughness and waviness measurement across production and field applications.
- In July 2025, AMETEK Inc. completed its acquisition of FARO Technologies and placed FARO within its Ultra Precision Technologies Division for 3D metrology applications.
Key Players in the Surface Profilers Market
Road Profiling and Pavement Measurement Specialists
- Dynatest A/S
- Ames Engineering LLC
- Greenwood Engineering A/S
- International Cybernetics Company LP (ICC-IMS)
Industrial 3D and Dimensional Metrology Platforms
- FARO Technologies under AMETEK
- Mitutoyo Corporation
Surface Roughness and Profile Specialists
- Taylor Hobson Ltd
- Mahr GmbH
Surface Profilers Market - Report Scope
| Coverage field | Report scope |
|---|---|
| Market breakdown | By profiler type, output, mobility, application, sales channel and region. |
| Quantitative Units | Revenue in USD million and CAGR in %. |
| Market Definition | Commercial surface profiling instruments and systems that measure longitudinal profile, roughness, flatness, rutting, texture or 3D surface geometry across road, concrete, industrial and laboratory applications. |
| Regions Covered | North America, Latin America, Europe, East Asia, South Asia and Pacific and Middle East and Africa. |
| Countries Covered | Australia, United Kingdom, United States, Germany, Japan, and 20+ countries included in the full report. |
| Key Companies Profiled | Dynatest A/S, Ames Engineering LLC, Greenwood Engineering A/S, International Cybernetics Company LP (ICC-IMS), FARO Technologies under AMETEK, Mitutoyo Corporation, Taylor Hobson Ltd, Mahr GmbH. |
| Forecast Period | 2026 to 2036. |
| Approach | Primary and secondary research with market triangulation. |
Surface Profilers Market - Research Methodology
| Method | Approach |
|---|---|
| Primary Research | FMI analysts gathered input from manufacturers, service providers, technology developers, distributors, end users, procurement teams, and subject-matter experts. Interviews examined purchasing decisions, product or service evaluation, adoption barriers, approval requirements, pricing considerations, and expectations for technical or commercial support. Respondents were also asked what evidence is required before a trial, pilot, or initial order develops into regular purchasing. |
| Desk Research | Desk research covered government statistics, regulatory publications, trade data, industry associations, technical literature, standards, company filings, product information, and official corporate announcements. Sources were reviewed for relevance, publication date, geographic coverage, and consistency with the defined market scope. Claims relating to performance, applications, approvals, capacity, investment, and commercial activity were retained only when supported by credible public evidence. |
| Market Sizing and Forecasting | The market model combined the baseline value with historical performance, segment structure, pricing and volume indicators, adoption levels, company participation, and country-level demand conditions. Forecast assumptions considered economic activity, investment trends, regulatory developments, technology adoption, purchasing cycles, supply availability, and barriers to wider market use. Segment and regional estimates were reconciled before the final market total was calculated. |
| Data Validation | Estimates were checked against multiple independent indicators, including public data, company activity, trade patterns, industry developments, and findings from primary interviews. Validation also tested whether products, services, applications, and company revenues fell within the defined market boundaries. Adjacent categories, unsupported claims, overlapping revenues, and activities without direct market relevance were excluded to reduce double counting and maintain consistency across segments and countries. |
Surface Profilers Market by Segments
Surface Profilers Market segmented by Profiler Type:
- Laser Profilers
- Inertial Road Profilers
- Contact Profilometers
- Walking Profilers
- 3D Surface Profilers
Surface Profilers Market segmented by Output:
- IRI or Roughness
- Flatness or Levelness
- Texture Depth
- Cross Slope or Rutting
- 3D Surface Mapping
Surface Profilers Market segmented by Mobility:
- Vehicle-mounted
- Cart-mounted
- Handheld or Portable
- Benchtop or Lab
Surface Profilers Market segmented by Application:
- Road Pavement Testing
- Industrial Floors
- Concrete Slabs
- Airport Runways
- Research or QA Labs
Surface Profilers Market segmented by Sales Channel:
- Direct OEM
- Testing Distributors
- Calibration or Service
- Rental Channel
Surface Profilers Market by Region:
- North America
- United States
- Canada
- Latin America
- Brazil
- Mexico
- Chile
- Rest of Latin America
- Western Europe
- Germany
- United Kingdom
- Italy
- Spain
- France
- Nordics
- Benelux
- Rest of Western Europe
- Eastern Europe
- Russia
- Poland
- Hungary
- Balkan and Baltic States
- Rest of Eastern Europe
- East Asia
- China
- Japan
- South Korea
- South Asia and Pacific
- India
- ASEAN
- Australia and New Zealand
- Rest of South Asia and Pacific
- Middle East and Africa
- Kingdom of Saudi Arabia
- Other GCC Countries
- Türkiye
- South Africa
- Other African Union Countries
- Rest of Middle East and Africa
Research Sources and Bibliography
- Mahr GmbH. (2025, April 22). MarSurf MC 510: Measuring Roughness in the Machine Tool.
- Department for Transport. (2026, January 21). Road conditions in England to March 2025.
- Bundesministerium für Verkehr. (2025, May 6). Zustandserfassung und -bewertung (ZEB) auf Bundesfernstraßen.
- Federal Highway Administration. (2025, November). Table HM-47I - Policy | Federal Highway Administration.
- Department for Transport. (2026, January 21). Road condition statistics - a basic guide and quality assessment.
- Ministry of Land, Infrastructure, Transport and Tourism. (2025, October 3).
- Ministry of Land, Infrastructure, Transport and Tourism. (2026, April 1).
- International Cybernetics Company LP. (2025, September 8). Now Available: Drive™ 1.9.6.
- AMETEK Inc. (2025, January 16). AMETEK Italy unveils new Customer Solutions Center in Milan.
- Bureau of Infrastructure and Transport Research Economics. (2025, December 12). Australian Infrastructure and Transport Statistics Yearbook 2025: Roads chapter.
- Department for Transport. (2025, May 28). Road condition monitoring standard - PAS 2161.
- Federal Highway Administration. (2025, November). Table HM-47 - Policy | Federal Highway Administration.
- Bundesministerium für Verkehr. (2025, May 6). Erhaltungsrahmenplan (ERaP).
- Mitutoyo Corporation. (2025, January 6).
- Dynatest A/S. (2026, July 1). Dynatest at ERPUG 2026: Road Profiling, Pavement Management and Infrastructure Data.
- Ames Engineering LLC. Our Company. Retrieved August 9, 2026.
- Greenwood Engineering A/S. About Greenwood Engineering. Retrieved August 9, 2026.
- FARO Technologies. (2026, January 13). A New Era Unfolds: FARO and Creaform Combine to Form Two New Business Units.
- Mitutoyo America Corporation. Precision Metrology Solutions. Retrieved August 9, 2026.
- Taylor Hobson Ltd. (2026, January 5). LUPHOScan 260 - NEW Automatic Centre and Level Capability.
- Mahr Inc. (2025, November 4). Mahr Inc. Introduces the MarSurf M 510 Series: A Compact, Versatile Mobile Surface Measuring Solution.
- AMETEK Inc. (2025, July 21). AMETEK Completes Acquisition of FARO Technologies.
- Taylor Hobson Ltd. (2026, July 1). Metrology 4.0 CAD PRO.
- FARO CREAFORM. (2026, April 14). FARO CREAFORM Cuts Laser Line Probe Time to Data on Challenging Surfaces.
- Mahr Inc. (2025, December 10). Mahr Inc. Introduces MarSurf3D Comprehensive Scattered Light Portfolio.
- FARO Technologies. (2025, June 3). FARO Factory Manufacturing and Service ISO Accreditation-Certification.
- Taylor Hobson Ltd. Calibration & Contract Measurement. Retrieved August 9, 2026.
- Dynatest A/S. Road Surface Profiler MK IV (RSP4) - The Ultimate Pavement Diagnostic System. Retrieved August 9, 2026.
- Ames Engineering LLC. 8300 High Speed Inertial Road Profiler. Retrieved August 9, 2026.
- Greenwood Engineering A/S. Profiler. Retrieved August 9, 2026.
- International Cybernetics Company LP. IrisPRO Every Speed. Retrieved August 9, 2026.
This bibliography is provided for reader reference and is not exhaustive. The full report contains the complete reference list and detailed citations
This Report Answers
- How large is the surface profilers market in 2026 and 2036?
- Which operating conditions keep surface-profiler demand recurring across road and industrial inspection?
- Why do laser profilers account for 29.0% of profiler type demand in 2026?
- How do IRI or roughness outputs influence equipment selection in recurring road surveys?
- Why do vehicle-mounted systems represent 34.0% of mobility demand in 2026?
- How do the five profiled country growth paths differ in qualification and service requirements?
- Which companies cover road profiling and industrial surface metrology applications?
- What limits substitution between profiling technologies within established measurement programs?
Frequently Asked Questions
How big is the Surface Profilers Market in 2026?
The surface profilers market is estimated at USD 860.6 million in 2026 and is projected to reach USD 1512.4 million by 2036. Growth is driven by recurring demand for road-condition monitoring, pavement surveys, and industrial surface inspection applications.
What is the CAGR of the Surface Profilers Market from 2026 to 2036?
The surface profilers market is projected to grow at a CAGR of 5.8% between 2026 and 2036. Expansion is supported by ongoing infrastructure maintenance activities and increasing use of precision surface measurement technologies in manufacturing.
Which profiler type is projected to account for 29.0% of the Surface Profilers Market?
Laser profilers are projected to account for 29.0% of the market in 2026. Their leading share is supported by non-contact measurement capabilities, high accuracy, and reduced maintenance requirements compared with contact-based systems.
How much is the Surface Profilers Market projected to add between 2026 and 2036?
The surface profilers market is expected to add USD 651.8 million in value between 2026 and 2036. Growth reflects continued investment in inspection equipment, road monitoring programs, and surface metrology solutions.
Which companies are active in the Surface Profilers Market?
Key companies operating in the market include Dynatest A/S, Ames Engineering LLC, Greenwood Engineering A/S, ICC-IMS, FARO, Mitutoyo, Taylor Hobson, and Mahr. These companies provide road profiling systems and industrial surface measurement solutions for infrastructure and manufacturing applications.
Preview the report firsthand - request a free sample
Get SampleGet the brochure for pricing and purchase details.
Get PDFTable of Content
- Key Takeaways
- Market Size and CAGR
- Top Growth Driver
- Fastest Growing Segment
- Leading Region
- Key Companies
- Emerging Opportunities
- Executive Summary
- Global Market Outlook
- Demand-side Trends
- Supply-side Trends
- Technology Roadmap Analysis
- Analysis and Recommendations
- Analyst Perspective (What is happening? Why now? What should investors know?)
- Key Questions Answered
- How large is the market?
- What is the CAGR?
- What are key trends?
- Which region dominates?
- Who are the leaders?
- Market Overview
- Market Coverage / Taxonomy
- Market Definition / Scope / Limitations
- Research Methodology
- Chapter Orientation
- Analytical Lens and Working Hypotheses
- Market Structure, Signals, and Trend Drivers
- Benchmarking and Cross-market Comparability
- Market Sizing, Forecasting, and Opportunity Mapping
- Research Design and Evidence Framework
- Desk Research Programme (Secondary Evidence)
- Expert Input and Fieldwork (Primary Evidence)
- Tooling, Models, and Reference Databases
- Data Engineering and Model Build
- Quality Assurance and Audit Trail
- Market Background
- Market Dynamics (Drivers, Restraints, Opportunity, Trends)
- Scenario Forecast (Optimistic, Likely, Conservative)
- Impact Analysis
- AI Impact
- Sustainability Impact
- Regulatory Impact
- Technology Impact
- Consumer / Buyer Analysis
- Purchase Drivers
- Adoption Barriers
- Buyer Journey
- Opportunity Map Analysis
- Product Life Cycle Analysis
- Supply Chain Analysis
- Investment Feasibility Matrix
- Value Chain Analysis
- PESTLE and Porter's Analysis
- Regulatory Landscape
- Regional Parent Market Outlook
- Production and Consumption Statistics
- Import and Export Statistics
- Global Market Analysis and Forecast, 2021 to 2036
- Historical Market Size Value (USD Million) Analysis, 2021 to 2025
- Current and Future Market Size Value (USD Million) Projections, 2026 to 2036
- Y-o-Y Growth Trend Analysis
- Absolute $ Opportunity Analysis
- Global Market Pricing Analysis, 2021 to 2036
- Global Market Analysis and Forecast, By Profiler Type, 2021 to 2036
- Introduction / Key Findings
- Historical Market Size Value (USD Million) Analysis By Profiler Type, 2021 to 2025
- Current and Future Market Size Value (USD Million) Analysis and Forecast By Profiler Type, 2026 to 2036
- Laser Profilers
- Inertial Road Profilers
- Contact Profilometers
- Walking Profilers
- 3D Surface Profilers
- Laser Profilers
- Y-o-Y Growth Trend Analysis By Profiler Type, 2021 to 2025
- Absolute $ Opportunity Analysis By Profiler Type, 2026 to 2036
- Global Market Analysis and Forecast, By Output, 2021 to 2036
- Introduction / Key Findings
- Historical Market Size Value (USD Million) Analysis By Output, 2021 to 2025
- Current and Future Market Size Value (USD Million) Analysis and Forecast By Output, 2026 to 2036
- IRI or Roughness
- Flatness or Levelness
- Texture Depth
- Cross Slope or Rutting
- 3D Surface Mapping
- IRI or Roughness
- Y-o-Y Growth Trend Analysis By Output, 2021 to 2025
- Absolute $ Opportunity Analysis By Output, 2026 to 2036
- Global Market Analysis and Forecast, By Mobility, 2021 to 2036
- Introduction / Key Findings
- Historical Market Size Value (USD Million) Analysis By Mobility, 2021 to 2025
- Current and Future Market Size Value (USD Million) Analysis and Forecast By Mobility, 2026 to 2036
- Vehicle-mounted
- Cart-mounted
- Handheld or Portable
- Benchtop or Lab
- Vehicle-mounted
- Y-o-Y Growth Trend Analysis By Mobility, 2021 to 2025
- Absolute $ Opportunity Analysis By Mobility, 2026 to 2036
- Global Market Analysis and Forecast, By Application, 2021 to 2036
- Introduction / Key Findings
- Historical Market Size Value (USD Million) Analysis By Application, 2021 to 2025
- Current and Future Market Size Value (USD Million) Analysis and Forecast By Application, 2026 to 2036
- Road Pavement Testing
- Industrial Floors
- Concrete Slabs
- Airport Runways
- Research or QA Labs
- Road Pavement Testing
- Y-o-Y Growth Trend Analysis By Application, 2021 to 2025
- Absolute $ Opportunity Analysis By Application, 2026 to 2036
- Global Market Analysis and Forecast, By Sales Channel, 2021 to 2036
- Introduction / Key Findings
- Historical Market Size Value (USD Million) Analysis By Sales Channel, 2021 to 2025
- Current and Future Market Size Value (USD Million) Analysis and Forecast By Sales Channel, 2026 to 2036
- Direct OEM
- Testing Distributors
- Calibration or Service
- Rental Channel
- Direct OEM
- Y-o-Y Growth Trend Analysis By Sales Channel, 2021 to 2025
- Absolute $ Opportunity Analysis By Sales Channel, 2026 to 2036
- Global Market Analysis and Forecast, By Region, 2021 to 2036
- Introduction
- Historical Market Size Value (USD Million) Analysis By Region, 2021 to 2025
- Current Market Size Value (USD Million) Analysis and Forecast By Region, 2026 to 2036
- North America
- Latin America
- Western Europe
- Eastern Europe
- East Asia
- South Asia and Pacific
- Middle East & Africa
- Market Attractiveness Analysis By Region
- North America Market Analysis and Forecast, By Country, 2021 to 2036
- Historical Market Size Value (USD Million) Trend Analysis By Market Taxonomy, 2021 to 2025
- Market Size Value (USD Million) Forecast By Market Taxonomy, 2026 to 2036
- By Country
- USA
- Canada
- By Profiler Type
- By Output
- By Mobility
- By Application
- By Sales Channel
- By Country
- Market Attractiveness Analysis
- By Country
- By Profiler Type
- By Output
- By Mobility
- By Application
- By Sales Channel
- Key Takeaways
- Latin America Market Analysis and Forecast, By Country
- Historical Market Size Value (USD Million) Trend Analysis By Market Taxonomy, 2021 to 2025
- Market Size Value (USD Million) Forecast By Market Taxonomy, 2026 to 2036
- By Country
- Brazil
- Mexico
- Chile
- Rest of Latin America
- By Profiler Type
- By Output
- By Mobility
- By Application
- By Sales Channel
- By Country
- Market Attractiveness Analysis
- By Country
- By Profiler Type
- By Output
- By Mobility
- By Application
- By Sales Channel
- Key Takeaways
- Western Europe Market Analysis and Forecast, By Country
- Historical Market Size Value (USD Million) Trend Analysis By Market Taxonomy, 2021 to 2025
- Market Size Value (USD Million) Forecast By Market Taxonomy, 2026 to 2036
- By Country
- Germany
- UK
- Italy
- Spain
- France
- Nordic
- BENELUX
- Rest of Western Europe
- By Profiler Type
- By Output
- By Mobility
- By Application
- By Sales Channel
- By Country
- Market Attractiveness Analysis
- By Country
- By Profiler Type
- By Output
- By Mobility
- By Application
- By Sales Channel
- Key Takeaways
- Eastern Europe Market Analysis and Forecast, By Country
- Historical Market Size Value (USD Million) Trend Analysis By Market Taxonomy, 2021 to 2025
- Market Size Value (USD Million) Forecast By Market Taxonomy, 2026 to 2036
- By Country
- Russia
- Poland
- Hungary
- Balkan & Baltic
- Rest of Eastern Europe
- By Profiler Type
- By Output
- By Mobility
- By Application
- By Sales Channel
- By Country
- Market Attractiveness Analysis
- By Country
- By Profiler Type
- By Output
- By Mobility
- By Application
- By Sales Channel
- Key Takeaways
- East Asia Market Analysis and Forecast, By Country
- Historical Market Size Value (USD Million) Trend Analysis By Market Taxonomy, 2021 to 2025
- Market Size Value (USD Million) Forecast By Market Taxonomy, 2026 to 2036
- By Country
- China
- Japan
- South Korea
- By Profiler Type
- By Output
- By Mobility
- By Application
- By Sales Channel
- By Country
- Market Attractiveness Analysis
- By Country
- By Profiler Type
- By Output
- By Mobility
- By Application
- By Sales Channel
- Key Takeaways
- South Asia and Pacific Market Analysis and Forecast, By Country
- Historical Market Size Value (USD Million) Trend Analysis By Market Taxonomy, 2021 to 2025
- Market Size Value (USD Million) Forecast By Market Taxonomy, 2026 to 2036
- By Country
- India
- ASEAN
- Australia & New Zealand
- Rest of South Asia and Pacific
- By Profiler Type
- By Output
- By Mobility
- By Application
- By Sales Channel
- By Country
- Market Attractiveness Analysis
- By Country
- By Profiler Type
- By Output
- By Mobility
- By Application
- By Sales Channel
- Key Takeaways
- Middle East & Africa Market Analysis and Forecast, By Country
- Historical Market Size Value (USD Million) Trend Analysis By Market Taxonomy, 2021 to 2025
- Market Size Value (USD Million) Forecast By Market Taxonomy, 2026 to 2036
- By Country
- Kingdom of Saudi Arabia
- Other GCC Countries
- Türkiye
- South Africa
- Other African Union
- Rest of Middle East & Africa
- By Profiler Type
- By Output
- By Mobility
- By Application
- By Sales Channel
- By Country
- Market Attractiveness Analysis
- By Country
- By Profiler Type
- By Output
- By Mobility
- By Application
- By Sales Channel
- Key Takeaways
- Key Countries Market Analysis
- USA
- Pricing Analysis
- Market Share Analysis, 2025
- By Profiler Type
- By Output
- By Mobility
- By Application
- By Sales Channel
- Canada
- Pricing Analysis
- Market Share Analysis, 2025
- By Profiler Type
- By Output
- By Mobility
- By Application
- By Sales Channel
- Mexico
- Pricing Analysis
- Market Share Analysis, 2025
- By Profiler Type
- By Output
- By Mobility
- By Application
- By Sales Channel
- Brazil
- Pricing Analysis
- Market Share Analysis, 2025
- By Profiler Type
- By Output
- By Mobility
- By Application
- By Sales Channel
- Chile
- Pricing Analysis
- Market Share Analysis, 2025
- By Profiler Type
- By Output
- By Mobility
- By Application
- By Sales Channel
- Germany
- Pricing Analysis
- Market Share Analysis, 2025
- By Profiler Type
- By Output
- By Mobility
- By Application
- By Sales Channel
- UK
- Pricing Analysis
- Market Share Analysis, 2025
- By Profiler Type
- By Output
- By Mobility
- By Application
- By Sales Channel
- Italy
- Pricing Analysis
- Market Share Analysis, 2025
- By Profiler Type
- By Output
- By Mobility
- By Application
- By Sales Channel
- Spain
- Pricing Analysis
- Market Share Analysis, 2025
- By Profiler Type
- By Output
- By Mobility
- By Application
- By Sales Channel
- France
- Pricing Analysis
- Market Share Analysis, 2025
- By Profiler Type
- By Output
- By Mobility
- By Application
- By Sales Channel
- India
- Pricing Analysis
- Market Share Analysis, 2025
- By Profiler Type
- By Output
- By Mobility
- By Application
- By Sales Channel
- ASEAN
- Pricing Analysis
- Market Share Analysis, 2025
- By Profiler Type
- By Output
- By Mobility
- By Application
- By Sales Channel
- Australia & New Zealand
- Pricing Analysis
- Market Share Analysis, 2025
- By Profiler Type
- By Output
- By Mobility
- By Application
- By Sales Channel
- China
- Pricing Analysis
- Market Share Analysis, 2025
- By Profiler Type
- By Output
- By Mobility
- By Application
- By Sales Channel
- Japan
- Pricing Analysis
- Market Share Analysis, 2025
- By Profiler Type
- By Output
- By Mobility
- By Application
- By Sales Channel
- South Korea
- Pricing Analysis
- Market Share Analysis, 2025
- By Profiler Type
- By Output
- By Mobility
- By Application
- By Sales Channel
- Russia
- Pricing Analysis
- Market Share Analysis, 2025
- By Profiler Type
- By Output
- By Mobility
- By Application
- By Sales Channel
- Poland
- Pricing Analysis
- Market Share Analysis, 2025
- By Profiler Type
- By Output
- By Mobility
- By Application
- By Sales Channel
- Hungary
- Pricing Analysis
- Market Share Analysis, 2025
- By Profiler Type
- By Output
- By Mobility
- By Application
- By Sales Channel
- Kingdom of Saudi Arabia
- Pricing Analysis
- Market Share Analysis, 2025
- By Profiler Type
- By Output
- By Mobility
- By Application
- By Sales Channel
- Türkiye
- Pricing Analysis
- Market Share Analysis, 2025
- By Profiler Type
- By Output
- By Mobility
- By Application
- By Sales Channel
- South Africa
- Pricing Analysis
- Market Share Analysis, 2025
- By Profiler Type
- By Output
- By Mobility
- By Application
- By Sales Channel
- USA
- Market Structure Analysis
- Competition Dashboard
- Competition Benchmarking
- Market Share Analysis of Top Players
- By Regional
- By Profiler Type
- By Output
- By Mobility
- By Application
- By Sales Channel
- Emerging Startups
- Innovation Benchmarking
- Competition Analysis
- Competition Deep Dive
- Dynatest
- Overview
- Product Portfolio
- Profitability by Market Segments
- Sales Footprint
- Strategy Overview
- Marketing Strategy
- Product Strategy
- Channel Strategy
- Ames Engineering
- KJ Law Engineers
- Greenwood Engineering
- GSSI
- SurPRO
- FARO
- Mitutoyo
- Taylor Hobson
- Mahr
- Dynatest
- Case Studies
- Success Stories
- Recent Developments
- Competition Deep Dive
- Assumptions & Acronyms Used


