
- Market Size (2026)
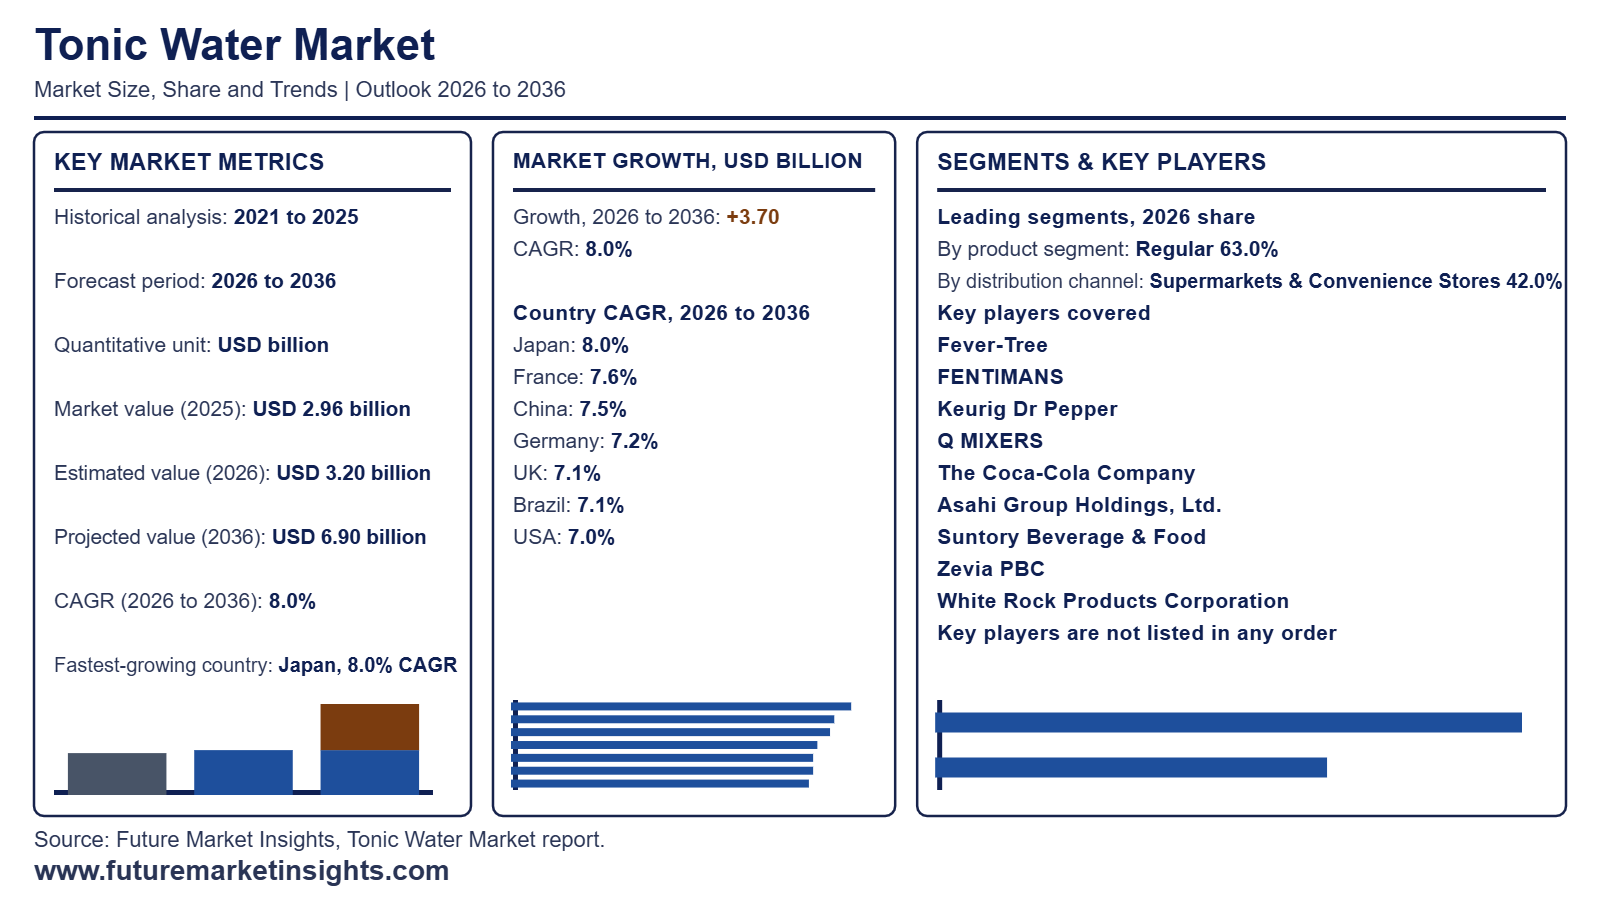
- USD 3.20 Bn
- Forecast (2036)
- USD 6.90 Bn
- CAGR (2026 to 2036)
- 8.0%
How Big Is the Tonic Water Market in 2026?
Starting from USD 2.96 billion in 2025, the global tonic water market valuation advanced to USD 3.20 billion in 2026, with projections by Future Market Insights (FMI) pointing toward USD 6.90 billion by 2036 at a CAGR of 8.0% to generate USD 3.70 billion in incremental opportunity.
| Market Metric | Valuation / Share / Forecast Benchmark |
|---|---|
| 2025 Market Size (Historical) | USD 2.96 billion |
| 2026 Market Size (Estimated) | USD 3.20 billion |
| 2036 Market Size (Projected) | USD 6.90 billion |
| Compound Annual Growth Rate (2026 to 2036) | 8.0% CAGR |
| Incremental Dollar Opportunity (2026 to 2036) | USD 3.70 billion |
| Dominant Product Segment (2026 Share) | Regular (63.0% share in 2026) | Other Segment Combined (37.0% share) |
| Fastest-Growing Product Segment | Diet (8.6% CAGR from 2026 to 2036) |
| Dominant Distribution Channel (2026 Share) | Hypermarkets, Supermarkets & Convenience Stores (42.0% share in 2026) |
| Fastest-Growing Distribution Channel | Online (9.1% CAGR from 2026 to 2036) |
| Largest Country Markets (2026 Global Share) | USA (26.0%), UK (18.0%), Germany (11.0%) |
| Fastest-Growing Country Markets (2026 to 2036) | Japan (8.0% CAGR), France (7.6% CAGR), China (7.5% CAGR) |
| Leading Tier-1 Companies | Fever-Tree, FENTIMANS, Keurig Dr Pepper, Q MIXERS, The Coca-Cola Company, Asahi Group Holdings, Ltd., Suntory Beverage & Food, Zevia PBC, White Rock Products Corporation, Bickford's Group |
Source: Future Market Insights analysis of the tonic water market, 2026.
This Report Answers
- How large the tonic water market is in 2026 and what it reaches by 2036
- Which product and distribution channel segments lead in 2026
- What is driving demand and what is holding the category back
- Which countries grow fastest between 2026 and 2036
- What Fever-Tree and other leading players have launched
- How the tonic water market is defined, segmented and measured
Executive Market Overview
Craft cocktail culture and consumer willingness to trade up to artisanal spirits are accelerating retail demand for botanical tonic waters flavored with natural cinchona bark quinine and reduced sugar content. non-alcoholic and zero-proof spirits. FMI finds that beverage groups with established national beer and soft-drink distribution networks are capturing on-trade pour agreements faster than standalone craft labels, owing to lower cold-chain delivery costs and consolidated account billing. In January 2025, Molson Coors Beverage Company (January 2025) entered an exclusive strategic partnership to manage United States production and retail commercialization for Fever-Tree tonics and commercial drink mixers starting in February 2025. Interim corporate filings from Fevertree Drinks plc (June 2026) confirm that completing the transition into the Molson Coors distribution system expanded supermarket shelf facings and bar tap replenishment across North America through mid-2026.
Standard quinine tonic faces tighter shelf-price scrutiny in grocery aisles because mainstream shoppers compare four-pack glass mixers directly against sparkling bottled water and flavored water. In FMI's view, beverage formulators are protecting unit margins by introducing calorie-free botanical variants and recycled-content multipacks that meet retailer packaging targets without triggering sugar excise levies. In August 2026, Asahi Beverages (August 2026) transitioned 100% of its Australian plastic soft-drink and Schweppes mixer bottles to recycled PET resin, helping supermarket buyers meet corporate packaging goals. Market sizing covers finished packaged quinine tonic water sold across retail and hospitality channels, while excluding spirits, prepared cocktails, plain carbonated water, and uncarbonated tonic syrups.
Analyst Perspective
"Tonic water brand owners will expand revenue faster through single-serve 150 ml and 200 ml bar cans and low-sugar botanical extensions than through standard 1-litre grocery bottles, because hospitality operators want exact single-cocktail portion control without flat bottle waste. The primary commercial risk is European hospitality volume contraction and tightening sugar-levy thresholds."
- Nandini Roy Choudhury, Principal Consultant, Future Market Insights (FMI)
Key Market Trends & Insights
- National Brewer Distribution Alliances Scale On-Trade Replenishment:Specialist mixer brands previously relied on fragmented specialty food wholesalers to reach independent bars and liquor stores, which raised per-case freight expenses and slowed reorder velocity. FMI observes that pairing craft tonic equity with major brewer truck fleets unlocks national grocery chain authorizations and stadium pouring contracts. Regulatory filings published by Fevertree Drinks plc (February 2025) document the issuance of 10,856,628 ordinary shares to Molson Coors to cement their long-term United States commercialization alliance, while Molson Coors Beverage Company (November 2026) reported USD 852.0 million in nine-month underlying free cash flow in 2026 as non-alcohol mixer distribution scaled.
- Sugar-Levy Threshold Reductions Accelerate Low-Calorie Reformulation:Beverage manufacturers across Europe and the United Kingdom are reformulating classic sucrose tonics with stevia and citrus flavonoids to stay below statutory sugar-tax thresholds while preserving bitter quinine mouthfeel. FMI projects the Diet tonic water segment to expand at an 8.6% CAGR through 2036, outpacing the 8.0% global market average as bar operators stock lighter mixers for daytime serves. Policy updates issued by HM Revenue & Customs (October 2026) confirm that the United Kingdom Soft Drinks Industry Levy lower threshold will drop from 5.0 grams to 4.5 grams of sugar per 100 milliliters on 1 January 2028.
- Zero-Sugar Natural Sweetener Systems and Recycled PET Reshape Retail Packs:Supermarket category managers increasingly require mixer suppliers to validate both clean-label sweetener declarations and circular container materials before granting promotional end-cap space. FMI notes that zero-sugar tonic lines formulated with stevia and monk fruit are capturing health-conscious households that avoid artificial aspartame and acesulfame potassium. Full-year financial disclosures from Zevia PBC (February 2026) show net sales rose to USD 161.3 million in 2025 with gross profit margin improving 1.6 percentage points to 48.0% as zero-sugar soda and mixer distribution widened across North American grocery chains.
What Are the Main Drivers, Restraints, and Opportunities?
Rising premium gin and zero-proof cocktail occasions expand core mixer volume, whereas hospitality spending softness and sugar-tax reformulation costs restrain margin expansion, leaving portion-controlled cans and natural low-sugar tonics as the primary growth avenues.
Driver: Expanding At-Home Mixed Drink and Zero-Proof Highball Occasions
Retail demand for packaged tonic water is rising as consumers replicate bar-style highballs at home using premium gin and botanical zero-proof distillates. FMI believes single-serve glass bottles and sleek aluminum cans allow households to prepare measured drinks without losing carbonation in half-used plastic bottles, driven by wider flavor innovation from major North American beverage groups. In February 2026, Keurig Dr Pepper (February 2026) expanded its 2026 refreshment portfolio across United States retail channels following 8.6% adjusted full-year net sales growth to USD 16.60 billion in 2025 reported by Keurig Dr Pepper (February 2026).
Restraint: On-Trade Hospitality Margin Pressure and Sugar-Tax Compliance
Independent bars and full-service restaurants face elevated operating costs that limit their willingness to pay premium wholesale prices for single-serve glass tonic mixers when guest traffic slows.In FMI's view, weak real foodservice receipts force venue operators to favor fountain gun mixers or domestic private-label bottles over imported craft tonics, due to tighter per-serve gross margin targets and ready-to-drink cocktails. Official hospitality data from Statistisches Bundesamt Destatis (February 2026) confirms that German hospitality revenue fell 2.1% in real terms during 2025, while Suntory Beverage & Food Limited (May 2025) reported softer European Schweppes tonic volume in France and Spain following sugar-tax adjustments.
Opportunity: Botanical Flavor Extensions and Portion-Controlled Bar Formats
Mixer manufacturers are unlocking higher revenue per litre by pairing cinchona bark quinine with yuzu and elderflower extracts crafted from botanical flavors and natural high-intensity sweeteners. FMI expects flavor-matched 150 ml and 200 ml cans to capture incremental restaurant menu listings and airline catering contracts, helped by curated spirit-pairing programs that simplify bartender service. In April 2026, Fentimans (April 2026) expanded its botanical tonic pairing program across Connoisseur and Valencia Orange variants, while Bickford's Group (July 2025) rolled out export-ready 4-pack 275 ml glass mixer formats across 47 international territories.
How Is the Tonic Water Market Segmented?
Tonic Water Market is segmented by Product, Distribution Channel, and Region. Forecast period from 2026 to 2036.
| Segmentation Axis | Sub-Segments Covered | 2026 Leading Segment & Share | Remainder & Total Alignment (2026 to 2036) |
|---|---|---|---|
| Product | Regular, Diet | Regular (63.0% share in 2026) | Other Segment Combined (37.0% share) | Total (100.0%) |
| Distribution Channel | Hypermarkets, Supermarkets & Convenience Stores, On-Trade, Online, Others | Hypermarkets, Supermarkets & Convenience Stores (42.0% share in 2026) | Other Segment Combined (58.0% share) | Total (100.0%) |
| Region | North America, Western Europe, East Asia, Latin America, Eastern Europe, South Asia and Pacific, Middle East and Africa | North America & Western Europe (Leading regional revenue bases in 2026) | Japan (8.0% CAGR) & France (7.6% CAGR) lead national growth through 2036 |
Source: Future Market Insights analysis of the tonic water market, 2026.
Why Does the Regular Segment Lead by Product?
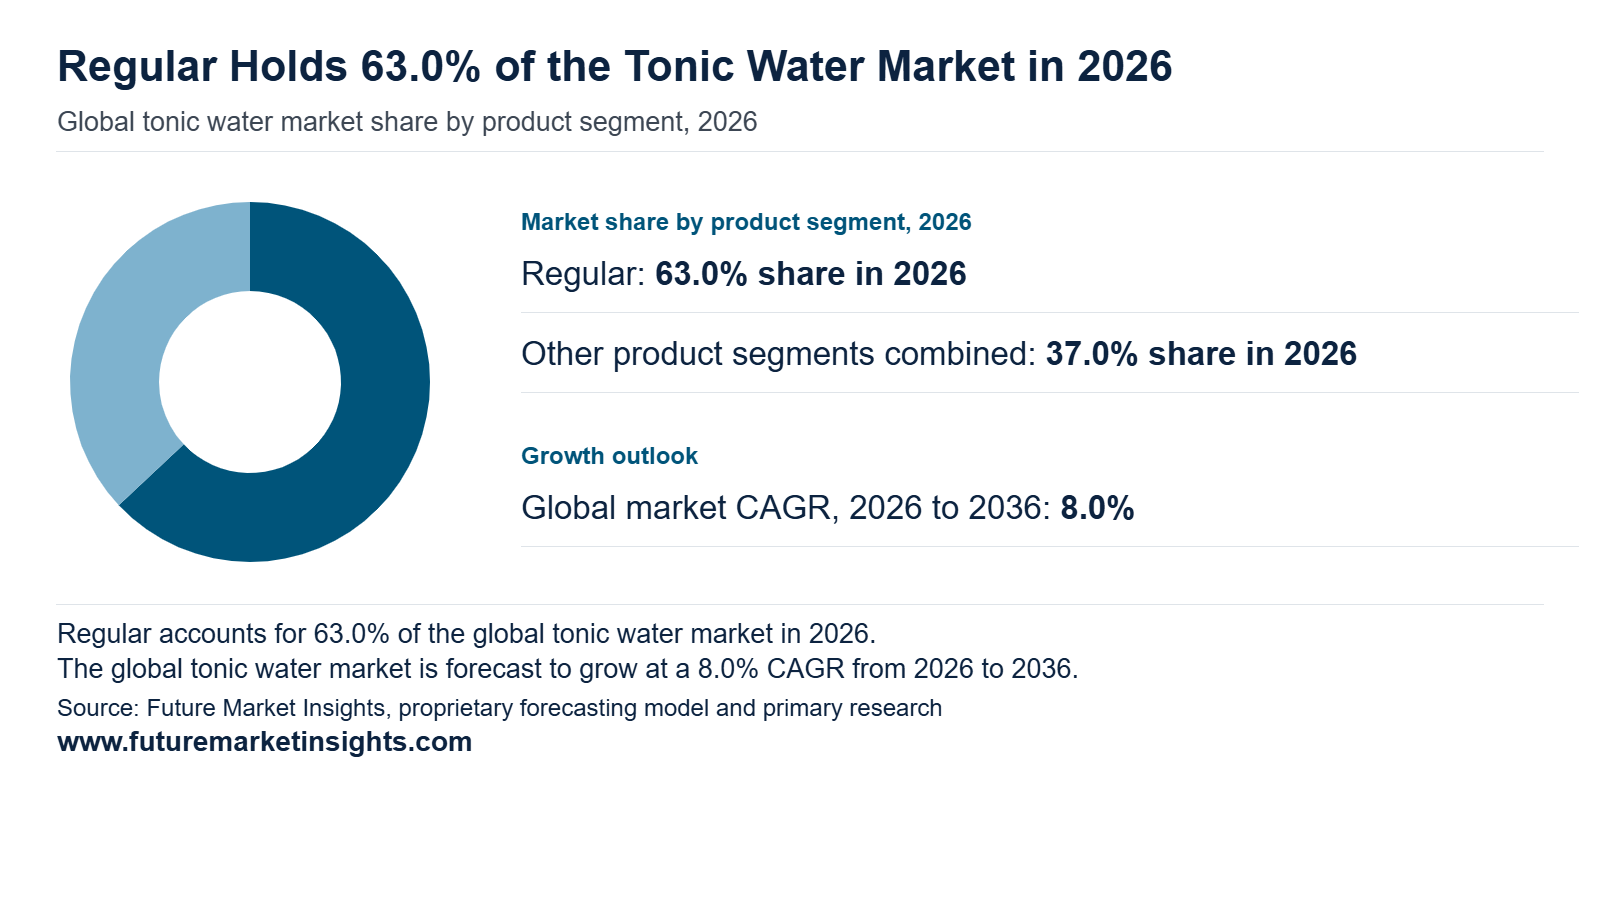
Regular varieties secure a leading 63.0% share of product revenue in 2026, favored by beverage bars for clean bitter-sweet balance and carbonation retention when mixed with dry spirits or botanical sugar infusions. Bartenders and hospitality beverage directors specify full-sugar quinine tonic as their core house pour because alternative sweeteners can alter astringency unless recipes are custom-calibrated. Portfolio disclosures from Q Mixers (June 2025) and federal additive rules enforced by the U.S. Government Publishing Office (2021) capping quinine at 83 parts per million in carbonated beverages confirm that standardized quinine dosing and crisp agave or cane-sugar profiles remain the primary commercial benchmark through 2036.
Why Do Hypermarkets, Supermarkets & Convenience Stores Lead by Distribution Channel?
Supermarkets and Convenience Stores capture 42.0% of distribution channel revenue in 2026, dominating off-trade sales through chilled multi-pack availability and cross-merchandising beside packaged spirits and ready-to-drink alcoholic beverages. Household shoppers replenish four-packs and six-packs of glass bottles or slim cans during routine grocery trips rather than paying single-bottle delivery fees. Retail sales tracking from the National Bureau of Statistics of China (January 2026) shows convenience-store retail sales rose 5.5% and supermarket sales advanced 4.3% in 2025, reinforcing brick-and-mortar grocery aisles as the primary volume engine through 2036.
Regional & Country Outlook
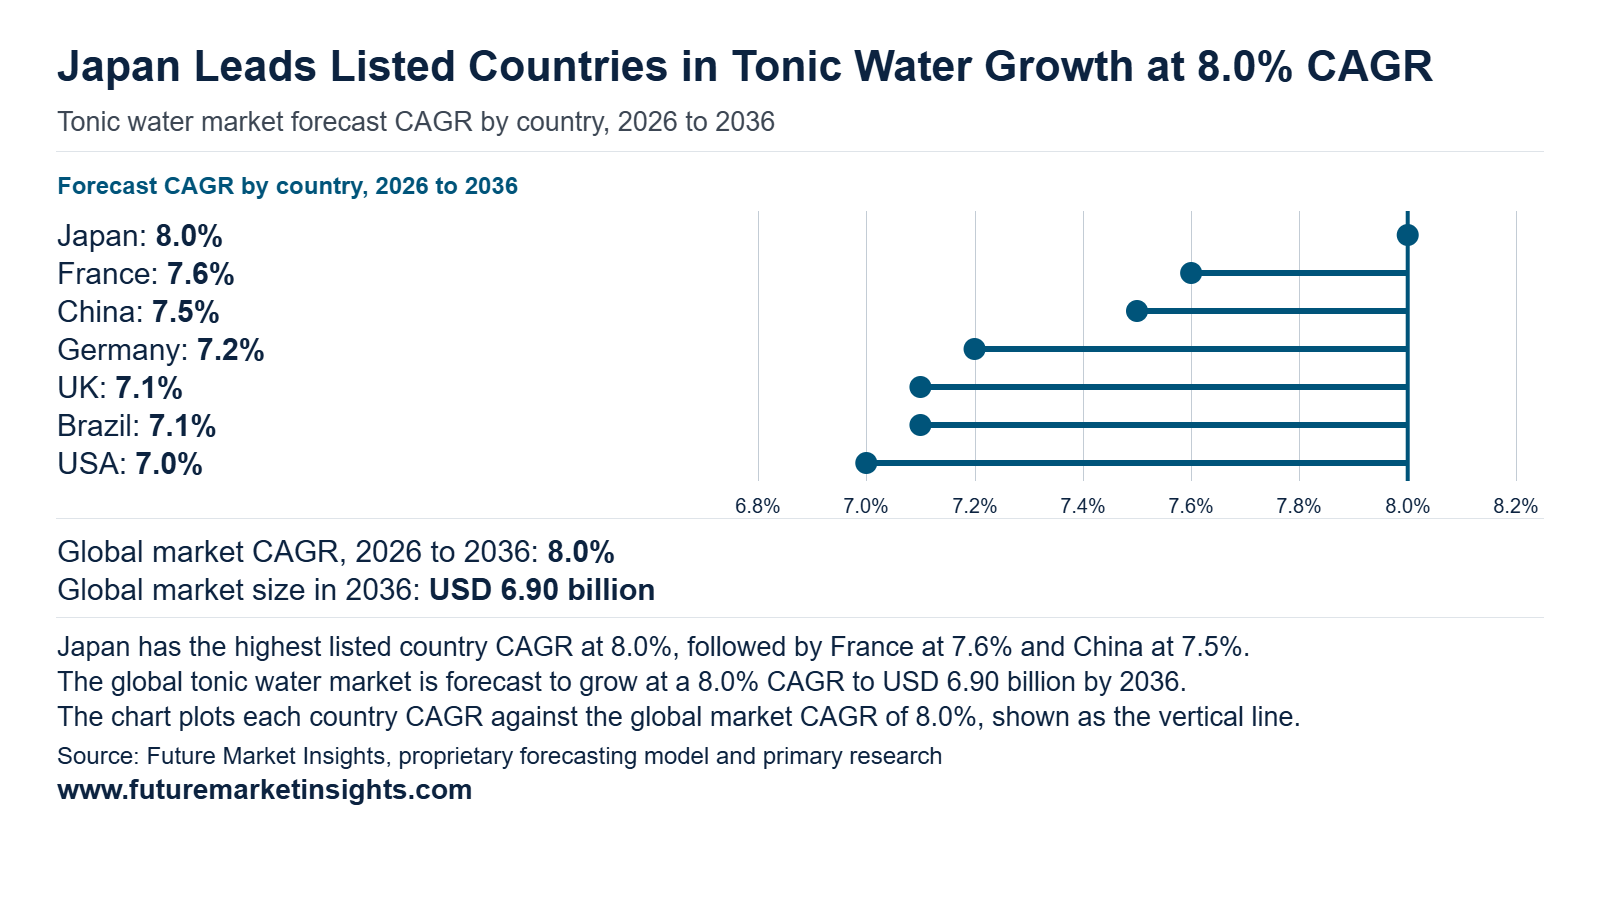
Western Europe and North America anchor current global tonic water revenue in 2026, while East Asia records the fastest percentage expansion through 2036 as craft cocktail bars and modern convenience chains scale chilled mixer assortments. FMI projects the seven core profiled countries, the United States, the United Kingdom and Germany, to account for 76.0% of global tonic water valuation in 2026, totaling USD 2.43 billion in 2026 and rising to USD 5.01 billion by 2036. Japan leads national growth at an 8.0% CAGR, followed closely by France at 7.6% and China at 7.5%, whereas the United States delivers the largest single-country dollar addition of USD 0.80 billion over the forecast decade.
| Country | 2026 Revenue | 2036 Revenue | 10-Year Addition | 2026 to 2036 CAGR | Global Share (2026 -> 2036) |
|---|---|---|---|---|---|
| Japan | USD 0.16 billion | USD 0.35 billion | +USD 0.19 billion | 8.0% | 5.0% -> 5.0% |
| France | USD 0.22 billion | USD 0.46 billion | +USD 0.24 billion | 7.6% | 6.9% -> 6.7% |
| China | USD 0.26 billion | USD 0.54 billion | +USD 0.28 billion | 7.5% | 8.1% -> 7.8% |
| Germany | USD 0.35 billion | USD 0.70 billion | +USD 0.35 billion | 7.2% | 10.9% -> 10.1% |
| UK | USD 0.58 billion | USD 1.15 billion | +USD 0.57 billion | 7.1% | 18.1% -> 16.7% |
| Brazil | USD 0.03 billion | USD 0.06 billion | +USD 0.03 billion | 7.1% | 0.9% -> 0.9% |
| USA | USD 0.83 billion | USD 1.63 billion | +USD 0.80 billion | 7.0% | 25.9% -> 23.6% |
Source: Future Market Insights analysis of the tonic water market, 2026.
Japan
Demand for tonic water in Japan is projected to rise from USD 0.16 billion in 2026 to USD 0.35 billion by 2036, advancing at a 8.0% CAGR and adding USD 0.19 billion in new revenue. FMI finds that demand in Japan is driven by hotel bars and specialty supermarkets stocking bitter quinine mixers for craft gin highballs and non-alcoholic beer. Food-processing trade analysis from the USDA Foreign Agricultural Service (April 2026) confirms that soft drinks and refreshing beverages expanded within Japan's USD 174 billion food-processing sector in 2025, while the Japan National Tourism Organization (January 2026) recorded 42,683,600 inbound visitors in 2025, up 15.8% year over year. FMI expects rising domestic off-trade multipack listings and premium bar programs to sustain rapid tonic water sales expansion across Japan through 2036.
France
Buyer adoption of tonic water across France is estimated to expand from USD 0.22 billion in 2026 to USD 0.46 billion by 2036, spurred by a 7.6% CAGR and generating USD 0.24 billion in commercial expansion. In FMI's assessment, French cafe-terrace aperitif habits and cocktail menu upgrades support steady procurement of 200 ml glass mixer bottles, helped by strict ingredient transparency under European Parliament and Council (October 2011) food-information rules requiring explicit quinine flavoring declarations. National consumption records from INSEE (June 2025) show real household expenditure on catering and beverage-serving services rose 2.2%, while Suntory Beverage & Food Limited (August 2026) documented second-quarter 2026 European revenue growth following late-2025 price revisions and promotional resets for core brands including Schweppes. FMI projects low-sugar botanical tonic extensions and supermarket aperitif promotions to drive French retail and hospitality reorders through 2036.
China
Tonic water industry in China is set to scale from USD 0.26 billion in 2026 to USD 0.54 billion by 2036, driven by a 7.5% CAGR and adding USD 0.28 billion in incremental market value. FMI observes that buyer adoption in Tier-1 and Tier-2 Chinese cities is fueled by home mixology among young urban adults and cold-chain convenience store expansion. Market intelligence published by the USDA Foreign Agricultural Service (March 2026) highlights growing cocktail mixer trial across Chinese e-commerce and modern retail channels, while the National Bureau of Statistics of China (January 2026) reported a 5.5% rise in convenience-store sales and a 5.2% increase in physical-goods online retail in 2025. In FMI's view, domestic e-commerce multipack bundling and western-style lounge openings will anchor sustained tonic water demand growth in China through 2036.
Germany
Sales of tonic water throughout Germany are projected to increase from USD 0.35 billion in 2026 to USD 0.70 billion by 2036, progressing at a 7.2% CAGR and creating USD 0.35 billion in additional revenue. FMI notes that while German bars and restaurants face cost pressure, off-trade hypermarket and beverage-store sales of returnable glass tonic crates remain resilient owing to strong home entertaining demand. Sector reporting from Statistisches Bundesamt Destatis (February 2026) shows German hospitality revenue contracted 2.1% in real terms in 2025, whereas the USDA Foreign Agricultural Service (March 2026) valued Germany's broader food and beverage processing sector at USD 270.1 billion across 5,991 enterprises in March 2026. FMI anticipates disciplined unit pricing and zero-sugar tonic launches across German grocery chains to support steady category expansion through 2036.
UK
Consumption of tonic water across UK is estimated to climb from USD 0.58 billion in 2026 to USD 1.15 billion by 2036, reflecting a 7.1% CAGR and contributing USD 0.57 billion over the forecast decade. FMI believes the United Kingdom remains Europe's largest national tonic water market anchored by mature pub and supermarket gin-and-tonic consumption and rapid adoption of light and flavored variants. Statutory tax updates from HM Revenue & Customs (October 2026) lowering the Soft Drinks Industry Levy threshold to 4.5 grams of sugar per 100 milliliters from January 2028 are accelerating recipe reformulation, while Fevertree Drinks plc (March 2026) confirmed sustained domestic brand leadership across UK off-trade and on-trade accounts. FMI expects sugar-levy-compliant formulations and miniature can multipacks to drive UK retail volume and value growth through 2036.
Brazil
Revenue generated by tonic water suppliers in Brazil is forecast to expand from USD 0.03 billion in 2026 to USD 0.06 billion by 2036, anchored by a 7.1% CAGR and generating USD 0.03 billion in new category sales. FMI's analysis indicates that Brazilian demand is shifting from seasonal coastal hospitality venues toward year-round urban supermarket and cash-and-carry purchases as a result of wider imported spirit availability. Retail trade reporting from the USDA Foreign Agricultural Service (November 2025) confirms a 12% increase in consumer-oriented food and distilled spirit imports in Brazil, complemented by Secretaria de Comunicacao Social, Brazil (January 2026) recording 9.3 million international arrivals and USD 7.9 billion in visitor spending in 2025. FMI projects expanding domestic aluminum can filling and modern supermarket distribution to sustain Brazilian tonic water sales through 2036.
USA
Buyer procurement of tonic water throughout USA is tracking from USD 0.83 billion in 2026 to USD 1.63 billion by 2036, exhibiting a 7.0% CAGR and contributing USD 0.80 billion to national market value. FMI observes that United States growth is attributed to national brewer distribution partnerships and multi-venue hospitality supply contracts that place premium tonics into mainstream grocery stores and stadium bars and ready-to-drink beverages. In January 2025, Molson Coors Beverage Company (January 2025) acquired Fevertree USA Inc. for USD 23.9 million in cash to scale United States distribution, while Keurig Dr Pepper (February 2026) expanded Canada Dry marketing and mixer shelf execution across national grocery chains in 2026. FMI expects wider supermarket cooler placement and zero-sugar tonic adoption to keep the United States as the primary global dollar growth contributor through 2036.
Competitive Environment and Notable Companies
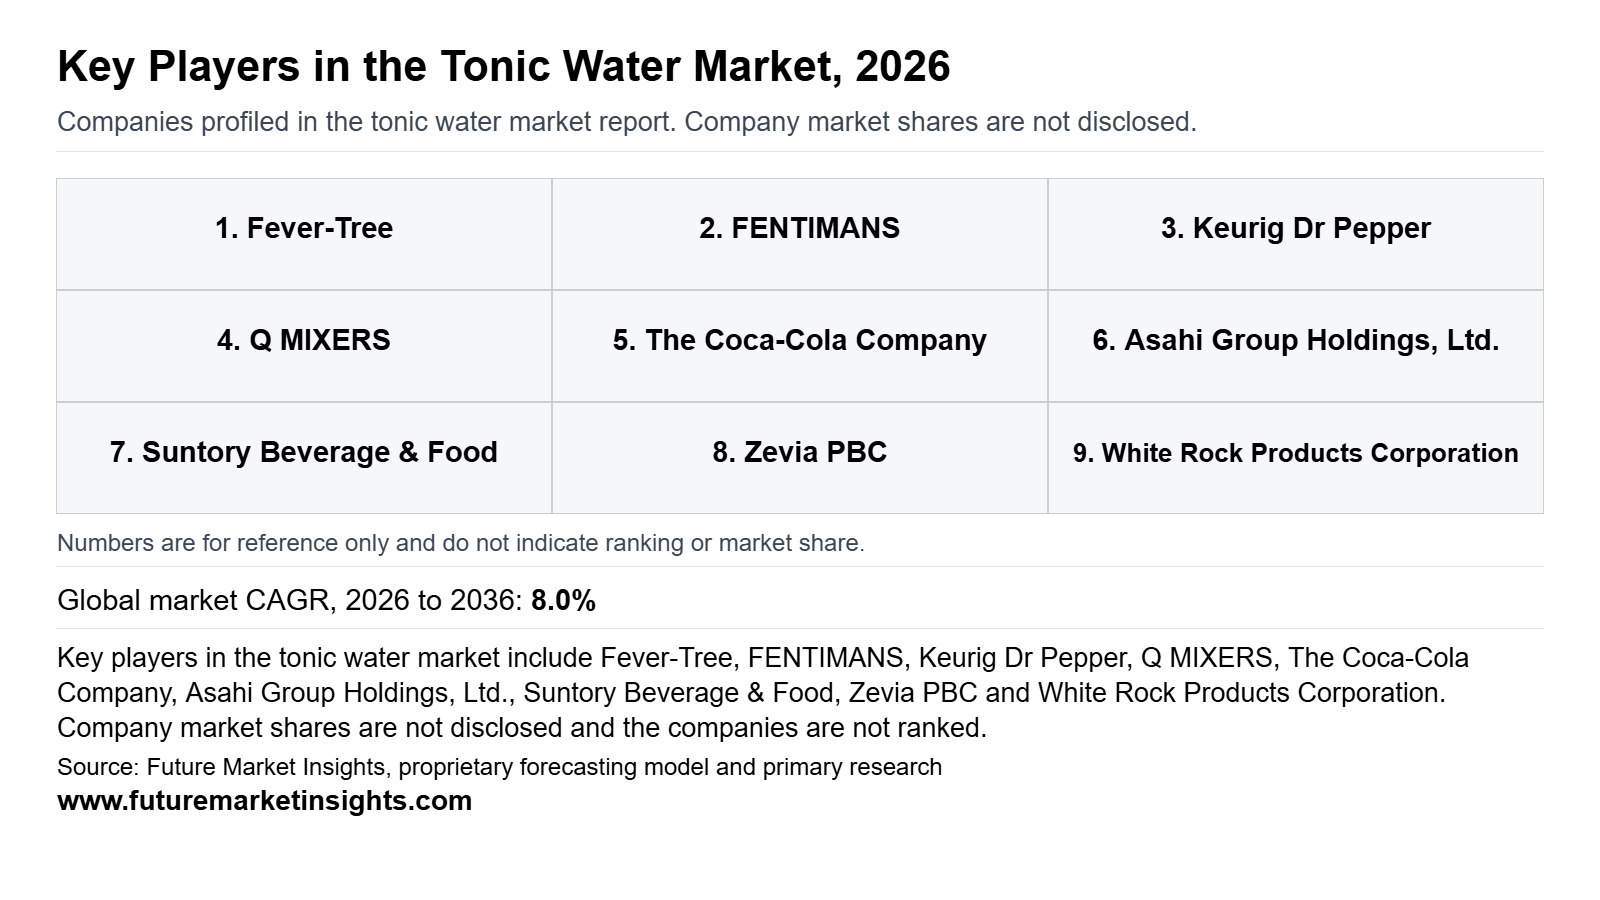
Competition in the global tonic water market operates across dedicated botanical mixer specialists led by Fever-Tree and FENTIMANS, multinational soft-drink and brewer distribution systems including Keurig Dr Pepper and The Coca-Cola Company, and regional or zero-sugar challengers such as Zevia PBC and Bickford's Group. Note that territorial ownership of the Schweppes trademark is divided globally, with Keurig Dr Pepper holding rights in North America, Suntory Beverage & Food in key Western European markets, Asahi Beverages in Australia, and The Coca-Cola Company in selected international territories.
How Are Companies Positioned in the Tonic Water Market?
Fever-Tree and FENTIMANS as well as Q MIXERS position their portfolios around natural cinchona bark quinine and single-serve glass or can formats designed for premium cocktail bars and supermarket spirit aisles. By contrast, Keurig Dr Pepper (Canada Dry and Schweppes in North America), The Coca-Cola Company (Schweppes in designated international territories perThe Coca-Cola Company (June 2025)), Suntory Beverage & Food, and Asahi Group Holdings, Ltd. compete through high-speed bottling lines and multi-channel grocery distribution, while Zevia PBC targets stevia-sweetened zero-calorie mixer buyers.
What Matters When a Buyer Selects a Tonic Water Supplier?
Hospitality procurement teams and grocery category buyers evaluate tonic water suppliers on carbonation retention after opening, quinine label compliance, per-serve unit economics, and on-time summer replenishment. Bar operators require 150 ml to 200 ml single-serve cans or glass bottles that eliminate flat waste from opened 1-litre containers, whereas supermarket chains prioritize high-turn four-packs and six-packs corroborated by promotional funding and recycled packaging credentials such asAsahi Beverages (August 2026) 100% recycled PET bottles.
Which Capabilities Distinguish Product Offers?
Product differentiation centers on sweetener architecture and botanical extract provenance as well as pack versatility. Fever-Tree and FENTIMANS differentiate through fermented botanical extracts and light variants that stay below theHM Revenue & Customs (October 2026) 4.5g per 100 ml sugar levy threshold; White Rock Products Corporation (2025) formulates pure cane-sugar tonic with natural quinine; and Zevia PBC (February 2026) supplies zero-sugar stevia-sweetened tonic cans.
How Does Geographic Reach Affect Competition?
Geographic reach determines whether a brand can service multinational hotel chains and cross-border supermarket groups. Fever-Tree accelerated its North American footprint by transferring United States production and distribution toMolson Coors Beverage Company (January 2025) in February 2025, while Bickford's Group (July 2025) exports Australian-made classic mixers across 47 countries and Suntory Beverage & Food manages Schweppes across major Western European grocery and on-trade channels.
| Verified Company Evidence (2025 to 2026) | Commercial Effect | Buyer Action |
|---|---|---|
| 30 January 2025 & 30 June 2026: Fevertree Drinks plc and Molson Coors Beverage Company executed their exclusive U.S. commercialization partnership and completed network integration (Molson Coors Beverage Company, January 2025; Fevertree Drinks plc, June 2026). | Combines specialist tonic brand equity with national brewer DSD truck delivery and U.S. co-packing scale. | Consolidate U.S. retail and on-trade Fever-Tree procurement through Molson Coors distributor accounts. |
| 19 August 2026: Asahi Beverages transitioned 100% of its Australian plastic soft-drink bottles, including Schweppes mixers, to 100% recycled PET resin (Asahi Beverages, August 2026). | Reduces virgin plastic intensity across off-trade multipacks and multi-serve tonic bottles. | Incorporate verified rPET bottle specifications into supermarket scope-3 packaging scorecards. |
| 18 February 2026: Keurig Dr Pepper unveiled its 2026 North American refreshment portfolio innovation and expanded Canada Dry brand marketing execution (Keurig Dr Pepper, February 2026). | Reinforces mainstream grocery end-cap visibility and multi-pack promotional velocity across North America. | Align seasonal mixer planograms with high-turn Canada Dry and Schweppes promotional windows. |
Source: Verified corporate disclosures and Future Market Insights analysis, 2026.
| Company | Core Positioning | Verified Activity & Source Attribution |
|---|---|---|
| Fever-Tree (Fevertree Drinks plc) | Global premium bottled and canned botanical tonic waters and mixers | Completed U.S. operational transfer to Molson Coors in 2025 and reported H1 2026 progress (Fevertree Drinks plc, June 2026). |
| FENTIMANS | Botanically brewed UK Indian tonic water, light tonic, and citrus/floral variants | Expanded botanical gin-and-tonic pairing guidance and 200 ml hospitality packs in April 2026 (Fentimans, April 2026). |
| Keurig Dr Pepper | North American mass-retail and on-trade tonic water (Canada Dry and Schweppes) | Reported USD 16.60 billion in 2025 adjusted net sales (+8.6%) and expanded 2026 refreshment marketing (Keurig Dr Pepper, February 2026). |
| Q MIXERS | United States craft carbonated tonic water in single-serve cans and glass bottles | Markets sharply carbonated crisp quinine tonic water with organic agave for bars and grocers (Q Mixers, June 2025). |
| The Coca-Cola Company | International Schweppes Indian Tonic and Zero Sugar bottling in designated territories | Disclosed active Schweppes territorial rights in its June 2025 proxy filing (The Coca-Cola Company, June 2025). |
| Asahi Group Holdings, Ltd. (Asahi Beverages) | Australian Schweppes Classic Mixers and Indian Tonic Water | Switched all Australian plastic soft-drink and Schweppes bottles to 100% recycled PET in August 2026 (Asahi Beverages, August 2026). |
| Suntory Beverage & Food Limited | Western European Schweppes tonic water and mixer manufacturing | Implemented European price revisions and Q2 2026 promotional investments across core brands (Suntory Beverage & Food Limited, August 2026). |
| Zevia PBC | Zero-sugar, zero-calorie stevia-sweetened tonic water cans | Grew full-year 2025 net sales to USD 161.3 million with 48.0% gross margin (Zevia PBC, February 2026). |
| White Rock Products Corporation | United States cane-sugar quinine tonic water in retail multipacks | Supplies traditional cane-sugar tonic water formulations across U.S. grocery accounts (White Rock Products Corporation, 2025). |
| Bickford's Group | Australian hand-crafted classic tonic and bitter lemon mixers in 275 ml glass packs | Distributed 2025 International Product Portfolio across 47 export markets (Bickford's Group, July 2025). |
Source: Verified corporate disclosures and Future Market Insights analysis, 2026.
Key takeaways
- Valued at USD 3.20 billion in 2026, on course for USD 6.90 billion by 2036.
- The decade adds USD 3.70 billion in new value at an 8.0% CAGR.
- The product segment is led by Regular at 63.0% of 2026 revenue.
- 42.0% of distribution channel revenue goes to Hypermarkets, Supermarkets & Convenience Stores in 2026.
- Japan grows fastest at 8.0% CAGR, ahead of France at 7.6%.
Tonic Water Market Report Scope and Research Methodology
FMI sizes the global tonic water market using a hybrid bottom-up and top-down modeling framework that reconciles retail off-trade scanner sales and on-trade hospitality depletion volumes against producer segment disclosures and national beverage statistics. Revenue is valued at finished packaged tonic water selling prices across glass bottles and aluminum can or PET multipacks in each country where consumption occurs. Adjacent spirits, ready-to-drink alcoholic cocktails, plain sparkling water, and uncarbonated tonic syrups or concentrates are strictly excluded to prevent double counting, and country and segment figures reconcile 100% to the global market valuation in every year from 2025 to 2036.
| Coverage Field | Report Scope |
|---|---|
| Market definition | Revenue from finished packaged carbonated quinine tonic water sold across retail and hospitality channels. |
| Product segmentation | Regular; Diet (Other Segment Combined). |
| Distribution channels | Hypermarkets, Supermarkets & Convenience Stores; On-Trade; Online; Others (Other Segment Combined). |
| Packaging formats | Single-serve glass bottles (150 ml to 275 ml), aluminum cans, and multi-serve PET or glass bottles. |
| Ingredients included | Carbonated water, quinine (up to 83 ppm in the US), caloric sugars or non-caloric sweeteners (stevia, monk fruit), and natural citrus or botanical extracts. |
| Exclusions | Distilled spirits, premixed alcoholic RTD cocktails, plain carbonated water, and uncarbonated tonic syrups or concentrates. |
| Quantitative units | USD billion for global and national market valuation. |
| Base and historical years | 2025 (Historical) and 2026 (Estimated Base Year). |
| Forecast period | 2026 to 2036 (10-year projection window). |
| Regions covered | North America; Latin America; Western Europe; Eastern Europe; East Asia; South Asia and Pacific; Middle East and Africa. |
| Profiled countries | Japan, France, China, Germany, UK, Brazil, and USA (plus extended regional taxonomy across Canada, Mexico, Argentina, Chile, Italy, Spain, Benelux, Nordics, Poland, Czech Republic, Romania, Hungary, South Korea, India, ASEAN, Australia and New Zealand, GCC Countries, South Africa, Turkiye, and Israel). |
| Companies profiled | Fever-Tree, FENTIMANS, Keurig Dr Pepper, Q MIXERS, The Coca-Cola Company, Asahi Group Holdings, Ltd., Suntory Beverage & Food Limited, Zevia PBC, White Rock Products Corporation, and Bickford's Group. |
| Primary research inputs | Interviews with beverage category buyers, hospitality bar directors, mixer formulators, and DSD beverage distributors. |
| Secondary research sources | Official government trade and statistical portals (USDA FAS, HMRC, Destatis, INSEE, NBS China), stock exchange filings, and corporate disclosures. |
Source: Future Market Insights analysis of the tonic water market, 2026.
Research Sources and Bibliography
- Asahi Beverages. (2026, August 19).Asahi switches to recycled material for all plastic soft drink bottles in major sustainability milestone. https://www.asahibeverages.com/news-and-media/asahi-switches-to-recycled-material-for-all-plastic-soft-drink-bottles-in-major-sustainability-milestone
- Bickford's Group. (2025, July).Bickford's International Product Portfolio 2025: Classic Mixers and Cordials. https://www.bickfordsgroup.com/wp-content/uploads/2025/07/Bickfords-International-Product-Portfolio-2025.pdf
- European Parliament and Council. (2011, October 25).Regulation (EU) No 1169/2011 on the provision of food information to consumers. https://eur-lex.europa.eu/legal-content/EN/TXT/?uri=CELEX%3A32011R1169
- Fentimans. (2026, April 16).The Best Fentimans Botanical Tonic and Mixers to Pair with Gin. https://www.fentimans.com/blogs/news/the-best-fentimans-botanical-tonic-mixers-to-pair-with-gin
- Fevertree Drinks plc. (2025, February 4).Completion of Share Issuance to Molson Coors. https://www.londonstockexchange.com/news-article/FEVR/completion-of-share-issuance-to-molson-coors/16885133
- Fevertree Drinks plc. (2026, March 24).FY25 Preliminary Results to 31 December 2025. https://www.londonstockexchange.com/en/news/article/FEVR/fy25-preliminary-results-to-31-december-2025/17516160
- Fevertree Drinks plc. (2026, June 30).FY26 Interim Results to 30 June 2026. https://www.londonstockexchange.com/en/news/article/FEVR/fy26-interim-results-to-30-june-2026/17779459
- HM Revenue & Customs. (2026, October 28).Soft Drink Industry Levy changes. https://www.gov.uk/government/publications/changes-to-the-soft-drinks-industry-levy/soft-drink-industry-levy-changes
- INSEE. (2025, June 11).La consommation des menages en 2024. https://www.insee.fr/fr/statistiques/8582021
- Japan National Tourism Organization. (2026, January 21).Visitor Arrivals for December 2025 and Full Year 2025. https://www.jnto.go.jp/news/press/20260121_monthly.html
- Keurig Dr Pepper. (2026, February 10).Keeping an Icon Fresh: Q&A with Canada Dry SVP of Brand Marketing Derek Dabrowski. https://www.keurigdrpepper.com/keeping-an-icon-fresh-qa-with-canada-dry-svp-of-brand-marketing-derek-dabrowski/
- Keurig Dr Pepper. (2026, February 18).Keurig Dr Pepper Announces Flavorful New Innovation Across Its Refreshment Portfolio. https://www.keurigdrpepper.com/keurig-dr-pepper-announces-flavorful-new-innovation-across-its-refreshment-portfolio/
- Keurig Dr Pepper. (2026, February 24).Keurig Dr Pepper Reports Q4 and Full Year 2025 Results and Provides 2026 Outlook. https://www.keurigdrpepper.com/keurig-dr-pepper-reports-q4-and-full-year-2025-results-and-provides-2026-outlook/
- Molson Coors Beverage Company. (2025, January 30).Molson Coors Beverage Company Announces Strategic Partnership With Fever-Tree in U.S.. https://ir.molsoncoors.com/news/news-details/2025/Molson-Coors-Beverage-Company-Announces-Strategic-Partnership-With-Fever-Tree-in-U.S/default.aspx
- Molson Coors Beverage Company. (2026, November 5).Molson Coors Beverage Company Reports 2026 Third Quarter Results. https://ir.molsoncoors.com/news/news-details/2026/Molson-Coors-Beverage-Company-Reports-2026-Third-Quarter-Results/default.aspx
- National Bureau of Statistics of China. (2026, January 20).Total Retail Sales of Consumer Goods in December 2025. https://www.stats.gov.cn/english/PressRelease/202601/t20260120_1962354.html
- Q Mixers. (2025, June).Our Mixers: Q Tonic Water and Botanical Lineup. https://qmixers.com/our-mixers/
- Secretaria de Comunicacao Social, Brazil. (2026, January 27).Turismo estrangeiro no Brasil em 2025 garante recorde de entrada de recursos para economia do pais. https://www.gov.br/secom/pt-br/acompanhe-a-secom/noticias/2026/01/turismo-estrangeiro-no-brasil-em-2025-garante-recorde-de-entrada-de-recursos-para-economia-do-pais-us-7-9-bilhoes/
- Statistisches Bundesamt Destatis. (2026, February 19).Hospitality turnover in 2025 down 2.1% in real terms. https://www.destatis.de/DE/Presse/Pressemitteilungen/2026/02/PD26_054_45213.html
- Suntory Beverage & Food Limited. (2025, May 13).Financial Results for Q1 Year Ending December 31, 2025. https://www.suntory.com/softdrink/ir/library_earnings/upload/2025_1q_shoga_script_e.pdf
- Suntory Beverage & Food Limited. (2026, August 6).Financial Results for Q2 Year Ending December 31, 2026. https://www.suntory.com/softdrink/ir/library_earnings/upload/2026_2q_shoga_e.pdf
- The Coca-Cola Company. (2025, June 26).Schedule 14A Proxy Filing: Schweppes Rights in Certain Markets. https://investors.coca-colacompany.com/filings-reports/all-sec-filings/content/0000021344-25-000047/ko-20250626_d2.htm
- U.S. Government Publishing Office. (2021).21 CFR 172.575: Quinine in Carbonated Beverages. https://www.govinfo.gov/app/details/CFR-2021-title21-vol3/CFR-2021-title21-vol3-sec172-575
- USDA Foreign Agricultural Service. (2025, November 21).Brazil: Retail Foods Annual. https://www.fas.usda.gov/data/gain/2025/11/brazil-retail-foods-annual
- USDA Foreign Agricultural Service. (2026, March 30).China: Spirits Market Update 2026. https://www.fas.usda.gov/data/gain/2026/03/china-spirits-market-update-2026
- USDA Foreign Agricultural Service. (2026, March 30).Germany: Food Processing Ingredients Annual. https://www.fas.usda.gov/data/gain/2026/03/germany-food-processing-ingredients-annual
- USDA Foreign Agricultural Service. (2026, April 1).Japan: Food Processing Ingredients Annual. https://www.fas.usda.gov/data/gain/2026/04/japan-food-processing-ingredients-annual
- White Rock Products Corporation. (2025).White Rock Beverages: Pure Cane Sugar Tonic Water Specifications. https://www.whiterockbeverages.com/tonic-water
- Zevia PBC. (2026, February 25).Zevia Announces Fourth Quarter and Full Year 2025 Results. https://investors.zevia.com/news/news-details/2026/Zevia-Announces-Fourth-Quarter-and-Full-Year-2025-Results-Appoints-Lead-Independent-Director-Andrew-Ruben-to-Chair-of-the-Board/default.aspx
Table of Content
- Key Takeaways
- Market Size and CAGR
- Top Growth Driver
- Fastest Growing Segment
- Leading Region
- Key Companies
- Emerging Opportunities
- Executive Summary
- Global Market Outlook
- Demand-side Trends
- Supply-side Trends
- Technology Roadmap Analysis
- Analysis and Recommendations
- Analyst Perspective (What is happening? Why now? What should investors know?)
- Key Questions Answered
- How large is the market?
- What is the CAGR?
- What are key trends?
- Which region dominates?
- Who are the leaders?
Read More...
- Market Overview
- Market Coverage / Taxonomy
- Market Definition / Scope / Limitations
- Research Methodology
- Chapter Orientation
- Analytical Lens and Working Hypotheses
- Market Structure, Signals, and Trend Drivers
- Benchmarking and Cross-market Comparability
- Market Sizing, Forecasting, and Opportunity Mapping
- Research Design and Evidence Framework
- Desk Research Programme (Secondary Evidence)
- Expert Input and Fieldwork (Primary Evidence)
- Tooling, Models, and Reference Databases
- Data Engineering and Model Build
- Quality Assurance and Audit Trail
- Market Background
- Market Dynamics (Drivers, Restraints, Opportunity, Trends)
- Scenario Forecast (Optimistic, Likely, Conservative)
- Impact Analysis
- AI Impact
- Sustainability Impact
- Regulatory Impact
- Technology Impact
- Consumer / Buyer Analysis
- Purchase Drivers
- Adoption Barriers
- Buyer Journey
- Opportunity Map Analysis
- Product Life Cycle Analysis
- Supply Chain Analysis
- Investment Feasibility Matrix
- Value Chain Analysis
- PESTLE and Porter's Analysis
- Regulatory Landscape
- Regional Parent Market Outlook
- Production and Consumption Statistics
- Import and Export Statistics
- Global Market Analysis and Forecast, 2021 to 2036
- Historical Market Size Value (USD Billion) Analysis, 2021 to 2025
- Current and Future Market Size Value (USD Billion) Projections, 2026 to 2036
- Y-o-Y Growth Trend Analysis
- Absolute $ Opportunity Analysis
- Global Market Pricing Analysis, 2021 to 2036
- Global Market Analysis and Forecast, By Product, 2021 to 2036
- Introduction / Key Findings
- Historical Market Size Value (USD Billion) Analysis By Product, 2021 to 2025
- Current and Future Market Size Value (USD Billion) Analysis and Forecast By Product, 2026 to 2036
- Regular
- Diet
- Y-o-Y Growth Trend Analysis By Product, 2021 to 2025
- Absolute $ Opportunity Analysis By Product, 2026 to 2036
- Global Market Analysis and Forecast, By Distribution Channel, 2021 to 2036
- Introduction / Key Findings
- Historical Market Size Value (USD Billion) Analysis By Distribution Channel, 2021 to 2025
- Current and Future Market Size Value (USD Billion) Analysis and Forecast By Distribution Channel, 2026 to 2036
- Hypermarkets
- Supermarkets & Convenience Stores
- On-Trade
- Online
- Others
- Y-o-Y Growth Trend Analysis By Distribution Channel, 2021 to 2025
- Absolute $ Opportunity Analysis By Distribution Channel, 2026 to 2036
- Global Market Analysis and Forecast, By Region, 2021 to 2036
- Introduction
- Historical Market Size Value (USD Billion) Analysis By Region, 2021 to 2025
- Current Market Size Value (USD Billion) Analysis and Forecast By Region, 2026 to 2036
- North America
- Western Europe
- East Asia
- South Asia and Pacific
- Market Attractiveness Analysis By Region
- North America Market Analysis and Forecast, By Country, 2021 to 2036
- Historical Market Size Value (USD Billion) Trend Analysis By Market Taxonomy, 2021 to 2025
- Market Size Value (USD Billion) Forecast By Market Taxonomy, 2026 to 2036
- By Country
- United States
- Canada
- By Product
- By Distribution Channel
- By Country
- Market Attractiveness Analysis
- By Country
- By Product
- By Distribution Channel
- Key Takeaways
- Western Europe Market Analysis and Forecast, By Country
- Historical Market Size Value (USD Billion) Trend Analysis By Market Taxonomy, 2021 to 2025
- Market Size Value (USD Billion) Forecast By Market Taxonomy, 2026 to 2036
- By Country
- United Kingdom
- Germany
- France
- By Product
- By Distribution Channel
- By Country
- Market Attractiveness Analysis
- By Country
- By Product
- By Distribution Channel
- Key Takeaways
- East Asia Market Analysis and Forecast, By Country
- Historical Market Size Value (USD Billion) Trend Analysis By Market Taxonomy, 2021 to 2025
- Market Size Value (USD Billion) Forecast By Market Taxonomy, 2026 to 2036
- By Country
- China
- Japan
- South Korea
- By Product
- By Distribution Channel
- By Country
- Market Attractiveness Analysis
- By Country
- By Product
- By Distribution Channel
- Key Takeaways
- South Asia and Pacific Market Analysis and Forecast, By Country
- Historical Market Size Value (USD Billion) Trend Analysis By Market Taxonomy, 2021 to 2025
- Market Size Value (USD Billion) Forecast By Market Taxonomy, 2026 to 2036
- By Country
- India
- Australia
- Rest of world aggregate
- By Product
- By Distribution Channel
- By Country
- Market Attractiveness Analysis
- By Country
- By Product
- By Distribution Channel
- Key Takeaways
- Key Countries Market Analysis
- United States
- Pricing Analysis
- Market Share Analysis, 2025
- By Product
- By Distribution Channel
- Canada
- Pricing Analysis
- Market Share Analysis, 2025
- By Product
- By Distribution Channel
- Germany
- Pricing Analysis
- Market Share Analysis, 2025
- By Product
- By Distribution Channel
- United Kingdom
- Pricing Analysis
- Market Share Analysis, 2025
- By Product
- By Distribution Channel
- France
- Pricing Analysis
- Market Share Analysis, 2025
- By Product
- By Distribution Channel
- India
- Pricing Analysis
- Market Share Analysis, 2025
- By Product
- By Distribution Channel
- China
- Pricing Analysis
- Market Share Analysis, 2025
- By Product
- By Distribution Channel
- Japan
- Pricing Analysis
- Market Share Analysis, 2025
- By Product
- By Distribution Channel
- South Korea
- Pricing Analysis
- Market Share Analysis, 2025
- By Product
- By Distribution Channel
- Australia
- Pricing Analysis
- Market Share Analysis, 2025
- By Product
- By Distribution Channel
- United States
- Market Structure Analysis
- Competition Dashboard
- Competition Benchmarking
- Market Share Analysis of Top Players
- By Regional
- By Product
- By Distribution Channel
- Emerging Startups
- Innovation Benchmarking
- Competition Analysis
- Competition Deep Dive
- Fever-Tree (Fevertree Drinks plc)
- Overview
- Product Portfolio
- Profitability by Market Segments
- Sales Footprint
- Strategy Overview
- Marketing Strategy
- Product Strategy
- Channel Strategy
- FENTIMANS
- Keurig Dr Pepper
- Q MIXERS
- The Coca-Cola Company
- Asahi Group Holdings, Ltd. (Asahi Beverages)
- Suntory Beverage & Food Limited
- Zevia PBC
- White Rock Products Corporation
- Bickford's Group
- Fever-Tree (Fevertree Drinks plc)
- Case Studies
- Success Stories
- Recent Developments
- Competition Deep Dive
- Assumptions & Acronyms Used
List of Tables
- Table 1: Global Market Value (USD Billion) Forecast by Region, 2021 to 2036
- Table 2: Global Market Value (USD Billion) Forecast by Product, 2021 to 2036
- Table 3: Global Market Value (USD Billion) Forecast by Distribution Channel, 2021 to 2036
- Table 4: North America Market Value (USD Billion) Forecast by Country, 2021 to 2036
- Table 5: North America Market Value (USD Billion) Forecast by Product, 2021 to 2036
- Table 6: North America Market Value (USD Billion) Forecast by Distribution Channel, 2021 to 2036
- Table 7: Western Europe Market Value (USD Billion) Forecast by Country, 2021 to 2036
- Table 8: Western Europe Market Value (USD Billion) Forecast by Product, 2021 to 2036
- Table 9: Western Europe Market Value (USD Billion) Forecast by Distribution Channel, 2021 to 2036
- Table 10: East Asia Market Value (USD Billion) Forecast by Country, 2021 to 2036
- Table 11: East Asia Market Value (USD Billion) Forecast by Product, 2021 to 2036
- Table 12: East Asia Market Value (USD Billion) Forecast by Distribution Channel, 2021 to 2036
- Table 13: South Asia and Pacific Market Value (USD Billion) Forecast by Country, 2021 to 2036
- Table 14: South Asia and Pacific Market Value (USD Billion) Forecast by Product, 2021 to 2036
- Table 15: South Asia and Pacific Market Value (USD Billion) Forecast by Distribution Channel, 2021 to 2036
List of Figures
- Figure 1: Global Market Pricing Analysis
- Figure 2: Global Market Value (USD Billion) Forecast 2021-2036
- Figure 3: Global Market Value Share and BPS Analysis by Product, 2026 and 2036
- Figure 4: Global Market Y-o-Y Growth Comparison by Product, 2026-2036
- Figure 5: Global Market Attractiveness Analysis by Product
- Figure 6: Global Market Value Share and BPS Analysis by Distribution Channel, 2026 and 2036
- Figure 7: Global Market Y-o-Y Growth Comparison by Distribution Channel, 2026-2036
- Figure 8: Global Market Attractiveness Analysis by Distribution Channel
- Figure 9: Global Market Value (USD Billion) Share and BPS Analysis by Region, 2026 and 2036
- Figure 10: Global Market Y-o-Y Growth Comparison by Region, 2026-2036
- Figure 11: Global Market Attractiveness Analysis by Region
- Figure 12: North America Market Incremental Dollar Opportunity, 2026-2036
- Figure 13: Western Europe Market Incremental Dollar Opportunity, 2026-2036
- Figure 14: East Asia Market Incremental Dollar Opportunity, 2026-2036
- Figure 15: South Asia and Pacific Market Incremental Dollar Opportunity, 2026-2036
- Figure 16: North America Market Value Share and BPS Analysis by Country, 2026 and 2036
- Figure 17: North America Market Value Share and BPS Analysis by Product, 2026 and 2036
- Figure 18: North America Market Y-o-Y Growth Comparison by Product, 2026-2036
- Figure 19: North America Market Attractiveness Analysis by Product
- Figure 20: North America Market Value Share and BPS Analysis by Distribution Channel, 2026 and 2036
- Figure 21: North America Market Y-o-Y Growth Comparison by Distribution Channel, 2026-2036
- Figure 22: North America Market Attractiveness Analysis by Distribution Channel
- Figure 23: Western Europe Market Value Share and BPS Analysis by Country, 2026 and 2036
- Figure 24: Western Europe Market Value Share and BPS Analysis by Product, 2026 and 2036
- Figure 25: Western Europe Market Y-o-Y Growth Comparison by Product, 2026-2036
- Figure 26: Western Europe Market Attractiveness Analysis by Product
- Figure 27: Western Europe Market Value Share and BPS Analysis by Distribution Channel, 2026 and 2036
- Figure 28: Western Europe Market Y-o-Y Growth Comparison by Distribution Channel, 2026-2036
- Figure 29: Western Europe Market Attractiveness Analysis by Distribution Channel
- Figure 30: East Asia Market Value Share and BPS Analysis by Country, 2026 and 2036
- Figure 31: East Asia Market Value Share and BPS Analysis by Product, 2026 and 2036
- Figure 32: East Asia Market Y-o-Y Growth Comparison by Product, 2026-2036
- Figure 33: East Asia Market Attractiveness Analysis by Product
- Figure 34: East Asia Market Value Share and BPS Analysis by Distribution Channel, 2026 and 2036
- Figure 35: East Asia Market Y-o-Y Growth Comparison by Distribution Channel, 2026-2036
- Figure 36: East Asia Market Attractiveness Analysis by Distribution Channel
- Figure 37: South Asia and Pacific Market Value Share and BPS Analysis by Country, 2026 and 2036
- Figure 38: South Asia and Pacific Market Value Share and BPS Analysis by Product, 2026 and 2036
- Figure 39: South Asia and Pacific Market Y-o-Y Growth Comparison by Product, 2026-2036
- Figure 40: South Asia and Pacific Market Attractiveness Analysis by Product
- Figure 41: South Asia and Pacific Market Value Share and BPS Analysis by Distribution Channel, 2026 and 2036
- Figure 42: South Asia and Pacific Market Y-o-Y Growth Comparison by Distribution Channel, 2026-2036
- Figure 43: South Asia and Pacific Market Attractiveness Analysis by Distribution Channel
- Figure 44: Global Market - Tier Structure Analysis
- Figure 45: Global Market - Company Share Analysis
Frequently Asked Questions
How big is the tonic water market in 2026?
Future Market Insights estimates the global tonic water market valuation at USD 3.20 billion in 2026, advancing from USD 2.96 billion in 2025.
How fast is the tonic water market projected to grow through 2036?
FMI projects the global tonic water market to expand at an8.0% CAGR from 2026 to 2036, reaching USD 6.90 billion by 2036 and generating USD 3.70 billion in incremental opportunity.
Which product segment leads the tonic water market?
Regular tonic water leads the product segment with 63.0% of global revenue in 2026.
Which distribution channel leads tonic water sales in 2026?
Hypermarkets, Supermarkets & Convenience Stores lead distribution channel revenue with a 42.0% share in 2026.
Which country is the largest tonic water market globally?
Across the United States, is the largest national tonic water market, accounting for 25.9% of global revenue in 2026 at USD 0.83 billion, followed by the United Kingdom at 18.1% (USD 0.58 billion).
Which countries record the fastest tonic water CAGR through 2036?
Japan records the fastest national expansion at an8.0% CAGR from 2026 to 2036, followed by France at 7.6% and China at 7.5%.
What regulatory thresholds affect tonic water formulation?
United States regulations under 21 CFR 172.575 cap quinine hydrochloride or sulfate at 83 parts per million in carbonated beverages, while the UK Soft Drinks Industry Levy threshold drops to 4.5 grams of sugar per 100 milliliters in January 2028.
Who are the leading companies in the tonic water market?
Leading companies in the tonic water market include Fever-Tree, FENTIMANS, Keurig Dr Pepper, Q MIXERS, The Coca-Cola Company, Asahi Group Holdings, Ltd., Suntory Beverage & Food Limited, Zevia PBC, White Rock Products Corporation, and Bickford's Group.
Preview the report firsthand - request a free sample
Get SampleGet the brochure for pricing and purchase details.
Get PDF
