Truck Market Size, Share, and Forecast Outlook 2025 to 2035

In 2025, the global truck market was valued at USD 7.92 trillion and is likely to reach USD 24.78 trillion by 2035, registering a CAGR of 11.8%. The peak-to-trough assessment indicates a steady upward cycle supported by freight expansion, infrastructure development, and advanced fleet technologies. Between 2025 and 2028, peak intervals are influenced by fleet modernization in OECD economies and increased cargo movement across industrial corridors. Trough phases in this period remain limited as consistent freight requirements sustain baseline activity.

From 2028 to 2031, peaks strengthen with higher cross-border trade in ASEAN countries and wider use of telematics for fleet efficiency. Trough intervals shorten as the transition to low-emission vehicles becomes commercially viable, supported by charging and refueling networks. Between 2031 and 2035, peak cycles are reinforced by integration of electric and hydrogen-powered trucks into long-haul logistics and automation in freight handling.

Trough points are further reduced as trade volumes and infrastructure projects broaden global trucking demand. This peak-to-trough pattern shows reduced volatility over the decade, offering stable ground for long-term operational planning. The data suggests that structural demand drivers and technological integration will define the market’s expansion cycle through 2035.
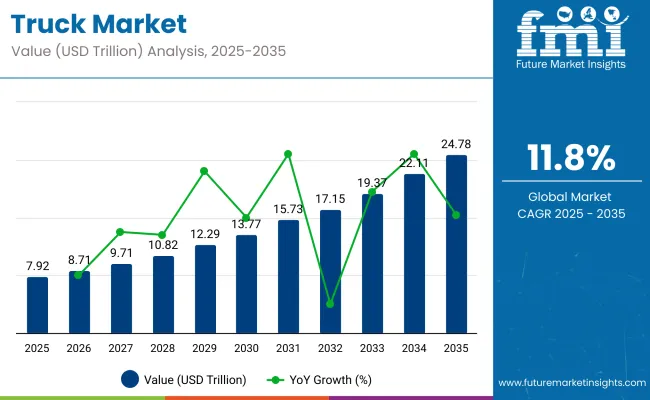
Quick stats of Truck Market

  • Global Truck Market Size (2025): USD 7.92 trillion
  • Projected Global Truck Market Size (2035): USD 24.78 trillion
  • Forecast CAGR of Global Truck Market (2025 to 2035): 11.8%
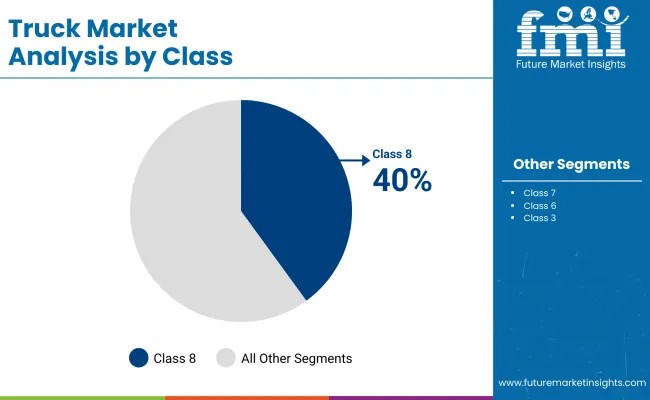
  • Leading Segment of Global Truck Market (2025): Class 8 Trucks (40%)
  • Key Growth Regions of Global Truck Market: China, India, Germany, United States, United Kingdom
  • Top Key Players of Global Truck Market: Daimler Trucks, Volvo Group, Paccar, Dongfeng Motor, Ford, Isuzu, Tata Motors, Ashok Leyland, Scania, Toyota

Truck Market

Metric Value
Industry Size (2025E) USD 7.92 trillion
Industry Value (2035F) USD 24.78 trillion
CAGR (2025 to 2035) 11.8%

Trucks have formed 35% of global automotive output, serving as the backbone for goods movement and industrial activity. Around 60% of medium and heavy-duty vehicle registrations have been attributed to trucks supporting logistics, mining, and infrastructure development.

Nearly 50% of commercial vehicle investment in OECD and ASEAN countries has been allocated to truck fleets for regional and cross-border transport. Within total automotive fuel demand, trucks have accounted for about 45% due to extended travel distances and payload capacity. Telematics and fleet tracking systems have been integrated into 55% of trucks, enabling route optimization and operational efficiency.

Electric trucks have reached nearly 12% of current manufacturing volumes, primarily focused on short-haul and urban delivery networks. Hybrid truck platforms have been introduced in around 18% of new models, aimed at lowering operational fuel costs.

Autonomous driving trials have covered 8% of active fleets, targeting improved road safety and driver assistance. Manufacturers have adopted modular chassis formats in about 25% of truck lines to cater to diverse application requirements. Predictive maintenance and real-time monitoring have been implemented in 30% of operational fleets, reducing downtime and supporting extended service intervals.

Top Dynamics Driving the Global Truck Market

High demand for freight capacity has been recorded in China, India, and the United States, supported by e-commerce growth, mining activity, and infrastructure projects. Light and medium-duty trucks have been deployed in last-mile logistics, while heavy-duty vehicles have dominated long-haul freight routes. Fuel diversification into LNG, electric, and hybrid formats has been incorporated into new platforms to meet evolving regulations. Production capacity has been expanded in manufacturing clusters across Mexico, Thailand, and Poland to serve regional and export needs.

Vehicle Demand Has Been Influenced by Freight Activity and Infrastructure Investment

Freight volumes in Asia Pacific rose by more than 6% in 2024, driving procurement of medium and heavy trucks for industrial and agricultural transport. North America maintained strong demand for Class 8 trucks, supported by highway freight movement exceeding 13 billion tons annually. Government investment in road networks and port upgrades has influenced vehicle orders in ASEAN and African markets. In Europe, light commercial trucks have been favored in urban logistics where emission restrictions apply.

Fleet operators have replaced older diesel units with lower-emission models to comply with regulatory timelines. Seasonal demand peaks have been recorded in construction, retail distribution, and agricultural export cycles. Digital freight platforms have been used to match capacity with shippers, improving asset productivity. Regional component sourcing has been increased to reduce delivery lead times and currency exposure.

Market Constraints Have Been Linked to Cost Pressure and Operational Shortages

Fluctuating steel and aluminum prices have raised chassis and body manufacturing costs by over 12% in the past year. Diesel price volatility has affected operating margins for long-haul fleets, especially in markets without fuel subsidies. Semiconductor shortages have slowed production of telematics-equipped trucks, creating order backlogs in North America and Europe. A shortage of trained drivers has been reported in multiple OECD markets, reducing available freight capacity.

Emission compliance upgrades have added costs to vehicle acquisition, particularly in Euro VI and equivalent standard markets. Shipping container rate volatility has disrupted delivery schedules for CKD and SKD truck kits. Smaller fleet operators have deferred vehicle replacement cycles due to high borrowing costs. Inventory levels at dealerships have remained below pre-2020 norms, affecting spot purchase availability in both domestic and export channels.

Market Opportunities Have Been Created by Electrification and Replacement Demand

Electric truck sales in China surpassed 100,000 units in 2024, supported by urban freight mandates and battery-swapping infrastructure. India has initiated state-backed procurement of electric medium-duty trucks for municipal logistics, targeting over 1,000 units by 2026. Fleet replacement opportunities have emerged as the average age of commercial trucks in several markets now exceeds nine years. OEMs have expanded production of LNG and hybrid trucks to serve intercity and regional freight segments.

Telematics integration has been positioned as a value driver for predictive maintenance and fuel optimization. Entry of new manufacturing facilities in Indonesia and Brazil has been used to serve domestic markets and reduce reliance on imports. Modular truck platforms have been adopted to enable flexible body configurations, catering to diverse freight categories including temperature-controlled, bulk, and containerized cargo.

Market Trends Have Been Shapedby Automation and Digital Freight Solutions

Autonomous truck pilots have been conducted on high-volume freight corridors in the United States and China, operating under controlled regulatory frameworks. Fleet operators have adopted truck-as-a-service models to access vehicles without long-term capital commitment. Digital freight brokerage platforms have increased their market share by matching real-time supply with demand, reducing empty backhauls. Predictive analytics has been applied to optimize routing and improve load planning.

In Europe, zero-emission zones have accelerated adoption of electric light trucks in last-mile delivery. Platooning trials have been conducted to lower fuel consumption and improve safety on expressways. Over-the-air software updates have been deployed to manage performance and compliance remotely. Partnerships between OEMs and battery manufacturers have been expanded to secure cell supply and support long-term electrification strategies for both regional and long-haul segments.

Analyzing Truck Market by Top Investment Segments

The global truck market in 2025 is driven by high-performing segments including Class 8 trucks, diesel propulsion, and heavy-duty configurations. Logistics and transportation remains the primary application, supported by cross-border trade and expanding distribution networks. The dominance of these segments is reinforced by infrastructure development, fleet replacement cycles, and the operational need for high payload capacity.

While electric and alternative propulsion types are gaining gradual traction, traditional diesel-powered models still dominate due to fueling convenience, established servicing networks, and competitive total cost of ownership in both developed and emerging markets.
Class 8 Trucks Lead Global Demand in 2025

Truck Market By Class

Class 8 trucks will hold a commanding 40% share of the truck market by class in 2025, primarily due to their payload capacity and suitability for long-haul freight. Manufacturers such as Daimler Truck, Volvo Trucks, and PACCAR’s Kenworth are strengthening Class 8 portfolios with advanced safety systems, fuel-efficient engines, and connected telematics.

These trucks are essential for heavy cargo transport across North America, Europe, and Asia, particularly in industries such as logistics, mining, and construction. The expansion of e-commerce distribution centers and international freight routes further boosts demand, as fleet operators prioritize capacity and operational efficiency in procurement decisions.
  • Volvo Trucks’ Class 8 sales rose 9% in North America between 2023 and 2025
  • Daimler Truck introduced next-gen Detroit engines improving fuel efficiency by 5% in Class 8 models
  • Class 8 trucks account for over 75% of total USA freight tonnage transported annually

Diesel Trucks Dominate Propulsion Segment with 68% Share

Truck Market By Propulsion

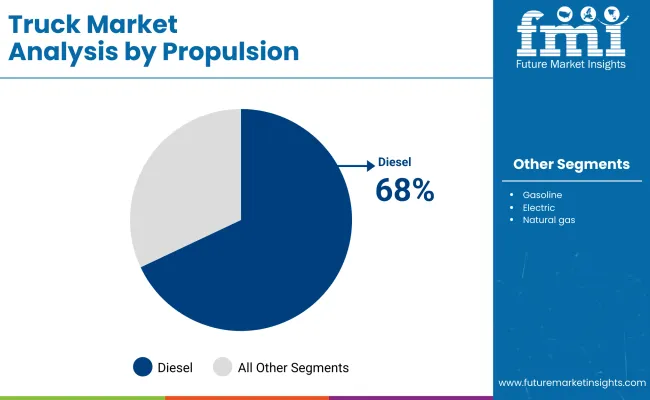
Diesel propulsion will maintain a strong 68% share in 2025, driven by its superior torque, long-range capability, and fueling network accessibility. OEMs including Scania, MAN, and Tata Motors continue to improve diesel truck efficiency through turbocharging, advanced fuel injection, and emission control technologies. In heavy-duty and long-haul operations, diesel remains the preferred choice due to payload requirements and refueling speed compared to electric alternatives.

Many emerging economies lack EV charging infrastructure for heavy vehicles, which reinforces diesel’s position. Even in regions pursuing stricter emission targets, retrofitted diesel trucks remain in active service due to cost considerations and operator familiarity.

  • Tata Motors expanded its BS-VI compliant diesel truck range for South Asian markets
  • MAN Trucks recorded 12% growth in diesel truck deliveries in Europe in 2024
  • Diesel-powered trucks maintain average operational ranges above 1,000 km per refuel

Heavy-Duty Trucks Retain Leadership by Type at 44% Share

Heavy-duty trucks are forecasted to command a 44% share of the truck market in 2025, driven by their role in construction, mining, and bulk logistics. Key manufacturers such as Hino Motors, Mack Trucks, and Isuzu are focusing on durability, axle load capacity, and telematics integration to meet fleet efficiency goals.

These trucks are preferred in regions with long freight corridors, high cargo weight limits, and demanding terrain. The growing scale of infrastructure projects in Asia-Pacific, Middle East, and Africa has also stimulated procurement. Heavy-duty models typically offer better lifecycle value for fleet operators, balancing fuel cost with revenue per ton transported.

  • Hino Motors expanded its heavy-duty truck range with 15L engines for Asia-Pacific markets
  • Mack Trucks’ Granite series achieved 8% YoY sales growth in North America
  • Heavy-duty trucks handle over 70% of construction material transport in GCC nations

Logistics and Transportation Hold 42% Application Share

Logistics and transportation will remain the leading truck market application in 2025 with a 42% share, supported by growth in e-commerce, FMCG distribution, and cross-border freight movement. OEMs including Freightliner, Ashok Leyland, and UD Trucks are offering application-specific models with enhanced cargo handling features and connected fleet management solutions.

The segment benefits from trade route expansions, port capacity upgrades, and supply chain digitalization. Regional and long-haul logistics operators are increasingly using real-time tracking and route optimization software to reduce operating costs. Demand is especially strong in North America, China, and Southeast Asia where freight volumes are rising consistently.

  • Ashok Leyland’s logistics-focused truck range recorded 15% sales growth in 2024
  • Freightliner’s Cascadia models dominate USA logistics fleets with strong telematics adoption
  • Containerized truck freight demand in Southeast Asia grew by 11% YoY from 2023 to 2025

Electric Trucks Gain 7% Share Through Targeted Fleets

Electric trucks will account for 7% of the truck market by propulsion in 2025, driven by zero-emission mandates, urban delivery requirements, and OEM investment. Companies like BYD, Volvo, and Tesla are focusing on medium-duty electric trucks for city logistics where charging access is easier. While adoption remains modest compared to diesel, operational cost savings from lower fuel and maintenance expenses are influencing fleet trials.

Municipal procurement of electric refuse and service trucks has also contributed to growth. Long-range electric models are still in limited rollout due to battery cost and weight constraints, but technology improvements are steadily narrowing the gap.
  • BYD delivered over 5,000 electric trucks globally in 2024 for logistics fleets
  • Volvo’s VNR Electric model range expanded into Canadian and European markets in 2025
  • Tesla Semi production increased output capacity to 50,000 units annually by mid-2025

Top Countries Operating, Renting, and Expanding Truck Market

Truck Market By Country

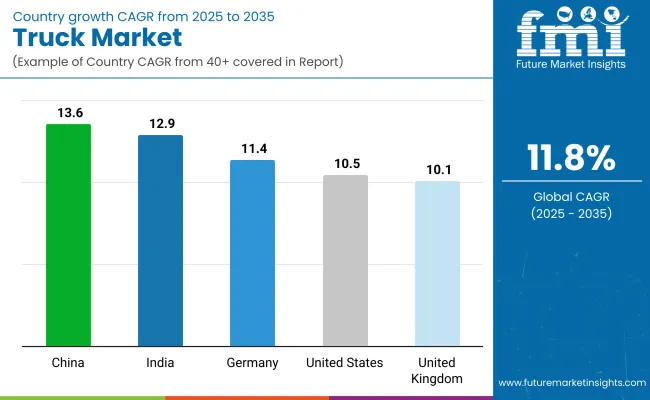
The global truck market is projected to grow at a CAGR of 11.8% between 2025 and 2035. China is estimated to lead growth with a CAGR of 13.6%, followed by India at 12.9% and Germany at 11.4%. The United States is projected at 10.5%, while the United Kingdom will see an estimated 10.1%. China’s growth outpaces the global average by +15%, with India maintaining a +9% premium.

Germany aligns closely with the baseline, while the United States and United Kingdom record -11% and -14% differences. Growth patterns are being shaped by infrastructure expansion in emerging markets, technological integration in freight operations, and strategic fleet modernization in established economies, creating differentiated opportunities across OECD and ASEAN trade corridors.

Demand Forecast for Truck Market in China

China is forecast at a 13.6% CAGR, underpinned by the rapid integration of autonomous freight trials in industrial corridors and increased investment in cross province logistics hubs. OEMs including FAW, Dongfeng, and Sinotruk are expanding assembly lines for high capacity heavy duty units tailored for mineral transport and industrial goods. Battery swapping infrastructure is being piloted in logistics clusters to reduce charging downtime for electric trucks. Long haul hydrogen powered vehicles are entering limited commercial use, supported by national energy policies.

Digital freight matching platforms are consolidating fragmented carrier networks. Export oriented manufacturers are targeting Belt and Road partner nations with competitively priced models. Strategic partnerships between component suppliers and truck assemblers are strengthening domestic supply chains to reduce dependency on imports.

  • CAGR of 13.6% is tied to large scale deployment of autonomous freight corridors in key provinces.
  • Battery swapping facilities are being tested to support high utilisation electric fleets.
  • Hydrogen long haul trucks are entering commercial use, aided by state backed fuel infrastructure.

Analysis of Truck Market in India

The truck market in India is projected at a 12.9% CAGR, shaped by rural freight penetration and state-led agricultural produce transport programs. OEMs like Tata Motors, Ashok Leyland, and Eicher are optimising load body designs to improve payload efficiency on varied road conditions. The push for LNG powered long distance trucks is being backed by corridor specific refuelling infrastructure. Seasonal demand fluctuations from agriculture are prompting fleet operators to invest in flexible fleet composition.

Government-backed vehicle scrappage policies are accelerating fleet modernisation, benefiting mid-tier carriers. Cooperative logistics models are being piloted to pool capacity for small and medium transporters. Enhanced driver training programs are being implemented to address safety compliance and fuel efficiency in multi-shift operations. Financing models tailored for owner-operators are expanding in rural markets.

  • LNG corridor infrastructure is being established for long haul applications.
  • Seasonal agriculture freight patterns are influencing flexible fleet procurement.
  • Cooperative logistics models are pooling capacity among small operators.

Growth Analysis of Truck Market in Germany

The truck market in Germany, with an 11.4% CAGR forecast, is being shaped by cross-border freight harmonization and just-in-time manufacturing supply needs. OEMs including Daimler Truck, MAN, and Scania are advancing modular chassis adaptable to both right and left-hand configurations for export markets. High-speed rail freight integration is influencing demand for medium range delivery trucks as feeder vehicles.

Urban low-noise delivery regulations are accelerating uptake of electric light and medium trucks in city cores. Fleet management systems are leveraging AI-based route prediction to coordinate deliveries across national borders. Hydrogen refueling corridors spanning industrial clusters are being deployed to support heavy duty applications. Logistics companies are investing in driverless yard tractors to improve terminal efficiency and turnaround times in freight depots.

  • AI-powered routing is optimizing cross-border delivery schedules.
  • Low-noise regulations are boosting demand for electric urban trucks.
  • Hydrogen refueling corridors are targeting heavy industrial freight routes.

Growth Analysis of Truck Market in the United States

The United States truck market, projected at a 10.5% CAGR, is being driven by intermodal freight growth and high-volume regional distribution contracts. OEMs such as Freightliner, PACCAR, and Volvo are investing in natural gas and hybrid heavy trucks for interstate operations. The expansion of dedicated freight corridors between major port cities and inland hubs is influencing fleet specification demand.

Large retail chains are adopting hub-and-spoke delivery models, creating demand for short-haul Class 6 and 7 trucks. Fleet telematics integration is enabling dynamic load allocation based on real-time capacity data. Tax incentives for alternative fuel adoption are accelerating purchases among regional carriers. Autonomous safety technologies including collision mitigation and adaptive cruise control are becoming standard in premium fleet orders.

  • Dedicated freight corridors are shaping vehicle specifications for high utilization.
  • Hub-and-spoke retail delivery models are expanding demand for Class 6-7 trucks.
  • Tax incentives are driving uptake of alternative fuel truck purchases.

Future Outlook for Truck Market in the United Kingdom

The truck market in UK is forecast at a 10.1% CAGR, supported by regional distribution restructuring due to evolving import-export trade flows. OEMs such as Leyland Trucks, Volvo, and DAF are adjusting product lines to meet weight restrictions in bridge-limited rural networks. Fleet electrification pilots are being concentrated in postal and municipal services. Cold-chain transport demand is rising due to growth in temperature-controlled pharmaceuticals and fresh produce imports.

Road toll policy adjustments are impacting route planning for long-haul carriers. Retrofitting of existing diesel trucks with hybrid drivetrains is being trialled by private logistics firms to extend asset life. Micro-hub distribution centres are being established to serve low-emission city zones, requiring customized vehicle dimensions and turning radii for narrow streets.
  • Cold-chain capacity growth is influencing demand for temperature-controlled trucks.
  • Micro-hub operations are driving interest in compact delivery vehicle formats.
  • Hybrid retrofit programs are being tested to extend diesel fleet lifecycles.

Leading Truck Manufacturers, Suppliers, and Distributors

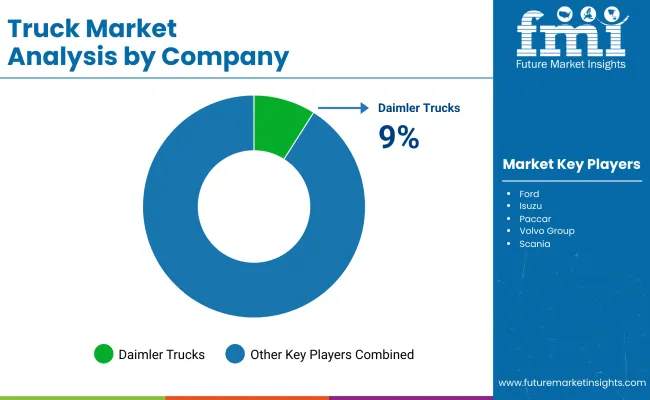
Truck Market By Company

The market is led by manufacturers such as Daimler Trucks, Volvo Group, and Paccar, each maintaining strong regional dominance through targeted product launches and platform optimization. Daimler Trucks has upgraded its Freightliner and Mercedes-Benz heavy-duty series for North American and European freight operations. Volvo Group has expanded modular platforms to serve multiple weight categories, improving manufacturing efficiency. Paccar has reinforced its Kenworth and DAF brands in Latin America through localized assembly.

Dongfeng Motor has expanded its medium-duty range in ASEAN to address rising logistics needs. Ford has refreshed its commercial truck lineup in North America with fleet-oriented upgrades. Isuzu continues to lead in light and medium-duty trucks in Japan and Australia through reliable chassis designs. Tata Motors has developed high-load capacity trucks for construction and mining in India and Africa, while Ashok Leyland has expanded exports with market-specific configurations in Africa and the Middle East.

Premium segment players like Scania remain competitive by offering service-based fleet contracts, securing long-term customer retention. Toyota’s role in the truck market is regional, with commercial vehicle partnerships in select Asian markets. Across the industry, R&D is concentrated on drivetrain efficiency, chassis adaptability, and platform scalability, enabling manufacturers to respond effectively to varying freight and construction sector demands.

Recent Industry Quote In June 2025, Girish Wagh, the executive director at Tata Motors, announced that the all-new Tata Ace Pro was developed to build on the legacy of the Tata Ace with a renewed focus on meeting the aspirations of the next generation of entrepreneurs. The model has been engineered to enhance stability, safety, and profitability, aiming to increase earning potential for users and support the ambitions of individuals seeking to establish and expand their businesses.

Leading Players

  • Ashok Leyland
  • Daimler Trucks
  • Dongfeng Motor
  • Ford
  • Isuzu
  • Paccar
  • Volvo Group
  • Scania
  • Tata Motors
  • Toyota

Report Scope

Report Attributes Details
Market Size (2025) USD 7.92 trillion
Projected Market Size (2035) USD 24.78 trillion
CAGR (2025 to 2035) 11.8%
Base Year for Estimation 2024
Historical Period 2020 to 2024
Projections Period 2025 to 2035
Quantitative Units USD trillion for value and volume units as applicable
Class Segments (Segment 1) Class 3, Class 4, Class 5, Class 6, Class 7, Class 8
Propulsion Types (Segment 2) Gasoline, Diesel, Electric, Natural Gas, FCEV
Truck Categories (Segment 3) Light Duty, Medium Duty, Heavy Duty
Application Segments (Segment 4) Logistics & Transportation, Construction & Infrastructure, Mining, Retail & E-Commerce, Others
Regions Covered North America; Latin America; Western Europe; Eastern Europe; Asia Pacific; Middle East and Africa
Countries Covered United States, Canada, Brazil, Mexico, Germany, United Kingdom, France, Italy, China, Japan, India, UAE, South Africa
Key Players Influencing the Market Ashok Leyland, Daimler Trucks, Dongfeng Motor, Ford, Isuzu, Paccar, Volvo Group, Scania, Tata Motors, Toyota
Additional Attributes Heavy-duty trucks dominate revenue share globally, with strong demand in freight-intensive economies; electric and FCEV adoption is increasing due to fuel cost and emissions policies

Truck Market Analyzed by Key Investment Segments 

By Class:

  • Class 3
  • Class 4
  • Class 5
  • Class 6
  • Class 7
  • Class 8

By Propulsion:

  • Gasoline
  • Diesel
  • Electric
  • Natural gas
  • FCEV

By Truck:

  • Light duty
  • Medium duty
  • Heavy duty

By Application:

  • Logistics & transportation
  • Construction & infrastructure
  • Mining
  • Retail & e-commerce
  • Others

By Region:

  • North America
  • Latin America
  • Western Europe
  • Eastern Europe
  • Asia Pacific
  • The Middle East and Africa

Table of Content

  1. Executive Summary
    • Global Market Outlook
    • Demand-side Trends
    • Supply-side Trends
    • Technology Roadmap Analysis
    • Analysis and Recommendations
  2. Market Overview
    • Market Coverage / Taxonomy
    • Market Definition / Scope / Limitations
  3. Market Background
    • Market Dynamics
      • Drivers
      • Restraints
      • Opportunity
      • Trends
    • Scenario Forecast
      • Demand in Optimistic Scenario
      • Demand in Likely Scenario
      • Demand in Conservative Scenario
    • Opportunity Map Analysis
    • Product Life Cycle Analysis
    • Supply Chain Analysis
      • Supply Side Participants and their Roles
        • Producers
        • Mid-Level Participants (Traders/ Agents/ Brokers)
        • Wholesalers and Distributors
      • Value Added and Value Created at Node in the Supply Chain
      • List of Raw Material Suppliers
      • List of Existing and Potential Buyer’s
    • Investment Feasibility Matrix
    • Value Chain Analysis
      • Profit Margin Analysis
      • Wholesalers and Distributors
      • Retailers
    • PESTLE and Porter’s Analysis
    • Regulatory Landscape
      • By Key Regions
      • By Key Countries
    • Regional Parent Market Outlook
    • Production and Consumption Statistics
    • Import and Export Statistics
  4. Global Market Analysis 2020 to 2024 and Forecast, 2025 to 2035
    • Historical Market Size Value (USD Trillion) & Volume (Units) Analysis, 2020 to 2024
    • Current and Future Market Size Value (USD Trillion) & Volume (Units) Projections, 2025 to 2035
      • Y-o-Y Growth Trend Analysis
      • Absolute $ Opportunity Analysis
  5. Global Market Pricing Analysis 2020 to 2024 and Forecast 2025 to 2035
  6. Global Market Analysis 2020 to 2024 and Forecast 2025 to 2035, By Class
    • Introduction / Key Findings
    • Historical Market Size Value (USD Trillion) & Volume (Units) Analysis By Class, 2020 to 2024
    • Current and Future Market Size Value (USD Trillion) & Volume (Units) Analysis and Forecast By Class, 2025 to 2035
      • Class 8
      • Class 7
      • Class 6
      • Class 5
      • Class 4
    • Y-o-Y Growth Trend Analysis By Class, 2020 to 2024
    • Absolute $ Opportunity Analysis By Class, 2025 to 2035
  7. Global Market Analysis 2020 to 2024 and Forecast 2025 to 2035, By Propulsion
    • Introduction / Key Findings
    • Historical Market Size Value (USD Trillion) & Volume (Units) Analysis By Propulsion, 2020 to 2024
    • Current and Future Market Size Value (USD Trillion) & Volume (Units) Analysis and Forecast By Propulsion, 2025 to 2035
      • Diesel
      • Gasoline
      • Electric
      • Natural gas
      • FCEV
    • Y-o-Y Growth Trend Analysis By Propulsion, 2020 to 2024
    • Absolute $ Opportunity Analysis By Propulsion, 2025 to 2035
  8. Global Market Analysis 2020 to 2024 and Forecast 2025 to 2035, By
    • Introduction / Key Findings
    • Historical Market Size Value (USD Trillion) & Volume (Units) Analysis By, 2020 to 2024
    • Current and Future Market Size Value (USD Trillion) & Volume (Units) Analysis and Forecast By, 2025 to 2035
      • Heavy Duty
      • Light Duty
      • Medium Duty
    • Y-o-Y Growth Trend Analysis By, 2020 to 2024
    • Absolute $ Opportunity Analysis By, 2025 to 2035
  9. Global Market Analysis 2020 to 2024 and Forecast 2025 to 2035, By Application
    • Introduction / Key Findings
    • Historical Market Size Value (USD Trillion) & Volume (Units) Analysis By Application, 2020 to 2024
    • Current and Future Market Size Value (USD Trillion) & Volume (Units) Analysis and Forecast By Application, 2025 to 2035
      • Logistics & Transportation
      • Construction & Infrastructure
      • Retail & E-Commerce
      • Mining
      • Others
    • Y-o-Y Growth Trend Analysis By Application, 2020 to 2024
    • Absolute $ Opportunity Analysis By Application, 2025 to 2035
  10. Global Market Analysis 2020 to 2024 and Forecast 2025 to 2035, By Region
    • Introduction
    • Historical Market Size Value (USD Trillion) & Volume (Units) Analysis By Region, 2020 to 2024
    • Current Market Size Value (USD Trillion) & Volume (Units) Analysis and Forecast By Region, 2025 to 2035
      • North America
      • Latin America
      • Western Europe
      • Eastern Europe
      • East Asia
      • South Asia & Pacific
      • Middle East and Africa
    • Market Attractiveness Analysis By Region
  11. North America Market Analysis 2020 to 2024 and Forecast 2025 to 2035, By Country
    • Historical Market Size Value (USD Trillion) & Volume (Units) Trend Analysis By Market Taxonomy, 2020 to 2024
    • Market Size Value (USD Trillion) & Volume (Units) Forecast By Market Taxonomy, 2025 to 2035
      • By Country
        • USA
        • Canada
        • Mexico
      • By Class
      • By Propulsion
      • By
      • By Application
    • Market Attractiveness Analysis
      • By Country
      • By Class
      • By Propulsion
      • By
      • By Application
    • Key Takeaways
  12. Latin America Market Analysis 2020 to 2024 and Forecast 2025 to 2035, By Country
    • Historical Market Size Value (USD Trillion) & Volume (Units) Trend Analysis By Market Taxonomy, 2020 to 2024
    • Market Size Value (USD Trillion) & Volume (Units) Forecast By Market Taxonomy, 2025 to 2035
      • By Country
        • Brazil
        • Argentina
        • Rest of LATAM
      • By Class
      • By Propulsion
      • By
      • By Application
    • Market Attractiveness Analysis
      • By Country
      • By Class
      • By Propulsion
      • By
      • By Application
    • Key Takeaways
  13. Western Europe Market Analysis 2020 to 2024 and Forecast 2025 to 2035, By Country
    • Historical Market Size Value (USD Trillion) & Volume (Units) Trend Analysis By Market Taxonomy, 2020 to 2024
    • Market Size Value (USD Trillion) & Volume (Units) Forecast By Market Taxonomy, 2025 to 2035
      • By Country
        • Germany
        • Italy
        • France
        • UK
        • Spain
        • BENELUX
        • Nordic
        • Rest of W.Europe
      • By Class
      • By Propulsion
      • By
      • By Application
    • Market Attractiveness Analysis
      • By Country
      • By Class
      • By Propulsion
      • By
      • By Application
    • Key Takeaways
  14. Eastern Europe Market Analysis 2020 to 2024 and Forecast 2025 to 2035, By Country
    • Historical Market Size Value (USD Trillion) & Volume (Units) Trend Analysis By Market Taxonomy, 2020 to 2024
    • Market Size Value (USD Trillion) & Volume (Units) Forecast By Market Taxonomy, 2025 to 2035
      • By Country
        • Russia
        • Hungary
        • Poland
        • Balkan & Baltics
        • Rest of E. Europe
      • By Class
      • By Propulsion
      • By
      • By Application
    • Market Attractiveness Analysis
      • By Country
      • By Class
      • By Propulsion
      • By
      • By Application
    • Key Takeaways
  15. East Asia Market Analysis 2020 to 2024 and Forecast 2025 to 2035, By Country
    • Historical Market Size Value (USD Trillion) & Volume (Units) Trend Analysis By Market Taxonomy, 2020 to 2024
    • Market Size Value (USD Trillion) & Volume (Units) Forecast By Market Taxonomy, 2025 to 2035
      • By Country
        • China
        • Japan
        • South Korea
      • By Class
      • By Propulsion
      • By
      • By Application
    • Market Attractiveness Analysis
      • By Country
      • By Class
      • By Propulsion
      • By
      • By Application
    • Key Takeaways
  16. South Asia & Pacific Market Analysis 2020 to 2024 and Forecast 2025 to 2035, By Country
    • Historical Market Size Value (USD Trillion) & Volume (Units) Trend Analysis By Market Taxonomy, 2020 to 2024
    • Market Size Value (USD Trillion) & Volume (Units) Forecast By Market Taxonomy, 2025 to 2035
      • By Country
        • India
        • Australia & New Zealand
        • ASEAN
        • Rest of SAP
      • By Class
      • By Propulsion
      • By
      • By Application
    • Market Attractiveness Analysis
      • By Country
      • By Class
      • By Propulsion
      • By
      • By Application
    • Key Takeaways
  17. Middle East and Africa Market Analysis 2020 to 2024 and Forecast 2025 to 2035, By Country
    • Historical Market Size Value (USD Trillion) & Volume (Units) Trend Analysis By Market Taxonomy, 2020 to 2024
    • Market Size Value (USD Trillion) & Volume (Units) Forecast By Market Taxonomy, 2025 to 2035
      • By Country
        • GCC Countries
        • Northern Africa
        • South Africa
        • Turkiye
        • Rest of MEA
      • By Class
      • By Propulsion
      • By
      • By Application
    • Market Attractiveness Analysis
      • By Country
      • By Class
      • By Propulsion
      • By
      • By Application
    • Key Takeaways
  18. Key Countries Market Analysis
    • USA
      • Pricing Analysis
      • Market Share Analysis, 2024
        • By Class
        • By Propulsion
        • By
        • By Application
    • Canada
      • Pricing Analysis
      • Market Share Analysis, 2024
        • By Class
        • By Propulsion
        • By
        • By Application
    • Brazil
      • Pricing Analysis
      • Market Share Analysis, 2024
        • By Class
        • By Propulsion
        • By
        • By Application
    • Mexico
      • Pricing Analysis
      • Market Share Analysis, 2024
        • By Class
        • By Propulsion
        • By
        • By Application
    • Argentina
      • Pricing Analysis
      • Market Share Analysis, 2024
        • By Class
        • By Propulsion
        • By
        • By Application
  19. Market Structure Analysis
    • Competition Dashboard
    • Competition Benchmarking
    • Market Share Analysis of Top Players
      • By Regional
      • By Class
      • By Propulsion
      • By
      • By Application
  20. Competition Analysis
    • Competition Deep Dive
      • Daimlers
        • Overview
        • Product Portfolio
        • Profitability by Market Segments (Product/Age /Sales Channel/Region)
        • Sales Footprint
        • Strategy Overview
          • Marketing Strategy
          • Product Strategy
          • Channel Strategy
      • Dongfeng Motor
        • Overview
        • Product Portfolio
        • Profitability by Market Segments (Product/Age /Sales Channel/Region)
        • Sales Footprint
        • Strategy Overview
          • Marketing Strategy
          • Product Strategy
          • Channel Strategy
      • Ford
        • Overview
        • Product Portfolio
        • Profitability by Market Segments (Product/Age /Sales Channel/Region)
        • Sales Footprint
        • Strategy Overview
          • Marketing Strategy
          • Product Strategy
          • Channel Strategy
      • Isuzu
        • Overview
        • Product Portfolio
        • Profitability by Market Segments (Product/Age /Sales Channel/Region)
        • Sales Footprint
        • Strategy Overview
          • Marketing Strategy
          • Product Strategy
          • Channel Strategy
      • Paccar
        • Overview
        • Product Portfolio
        • Profitability by Market Segments (Product/Age /Sales Channel/Region)
        • Sales Footprint
        • Strategy Overview
          • Marketing Strategy
          • Product Strategy
          • Channel Strategy
      • Volvo Group
        • Overview
        • Product Portfolio
        • Profitability by Market Segments (Product/Age /Sales Channel/Region)
        • Sales Footprint
        • Strategy Overview
          • Marketing Strategy
          • Product Strategy
          • Channel Strategy
      • Scania
        • Overview
        • Product Portfolio
        • Profitability by Market Segments (Product/Age /Sales Channel/Region)
        • Sales Footprint
        • Strategy Overview
          • Marketing Strategy
          • Product Strategy
          • Channel Strategy
      • Tata Motors
        • Overview
        • Product Portfolio
        • Profitability by Market Segments (Product/Age /Sales Channel/Region)
        • Sales Footprint
        • Strategy Overview
          • Marketing Strategy
          • Product Strategy
          • Channel Strategy
      • Toyota
        • Overview
        • Product Portfolio
        • Profitability by Market Segments (Product/Age /Sales Channel/Region)
        • Sales Footprint
        • Strategy Overview
          • Marketing Strategy
          • Product Strategy
          • Channel Strategy
      • Ashok Leyland
        • Overview
        • Product Portfolio
        • Profitability by Market Segments (Product/Age /Sales Channel/Region)
        • Sales Footprint
        • Strategy Overview
          • Marketing Strategy
          • Product Strategy
          • Channel Strategy
  21. Assumptions & Acronyms Used
  22. Research Methodology

List of Tables

  • Table 1: Global Market Value (USD Trillion) Forecast by Region, 2020-2035
  • Table 2: Global Market Volume (Units) Forecast by Region, 2020-2035
  • Table 3: Global Market Value (USD Trillion) Forecast by Class, 2020-2035
  • Table 4: Global Market Volume (Units) Forecast by Class, 2020-2035
  • Table 5: Global Market Value (USD Trillion) Forecast by Propulsion, 2020-2035
  • Table 6: Global Market Volume (Units) Forecast by Propulsion, 2020-2035
  • Table 7: Global Market Value (USD Trillion) Forecast by, 2020-2035
  • Table 8: Global Market Volume (Units) Forecast by, 2020-2035
  • Table 9: Global Market Value (USD Trillion) Forecast by Application, 2020-2035
  • Table 10: Global Market Volume (Units) Forecast by Application, 2020-2035
  • Table 11: North America Market Value (USD Trillion) Forecast by Country, 2020-2035
  • Table 12: North America Market Volume (Units) Forecast by Country, 2020-2035
  • Table 13: North America Market Value (USD Trillion) Forecast by Class, 2020-2035
  • Table 14: North America Market Volume (Units) Forecast by Class, 2020-2035
  • Table 15: North America Market Value (USD Trillion) Forecast by Propulsion, 2020-2035
  • Table 16: North America Market Volume (Units) Forecast by Propulsion, 2020-2035
  • Table 17: North America Market Value (USD Trillion) Forecast by, 2020-2035
  • Table 18: North America Market Volume (Units) Forecast by, 2020-2035
  • Table 19: North America Market Value (USD Trillion) Forecast by Application, 2020-2035
  • Table 20: North America Market Volume (Units) Forecast by Application, 2020-2035
  • Table 21: Latin America Market Value (USD Trillion) Forecast by Country, 2020-2035
  • Table 22: Latin America Market Volume (Units) Forecast by Country, 2020-2035
  • Table 23: Latin America Market Value (USD Trillion) Forecast by Class, 2020-2035
  • Table 24: Latin America Market Volume (Units) Forecast by Class, 2020-2035
  • Table 25: Latin America Market Value (USD Trillion) Forecast by Propulsion, 2020-2035
  • Table 26: Latin America Market Volume (Units) Forecast by Propulsion, 2020-2035
  • Table 27: Latin America Market Value (USD Trillion) Forecast by, 2020-2035
  • Table 28: Latin America Market Volume (Units) Forecast by, 2020-2035
  • Table 29: Latin America Market Value (USD Trillion) Forecast by Application, 2020-2035
  • Table 30: Latin America Market Volume (Units) Forecast by Application, 2020-2035
  • Table 31: Western Europe Market Value (USD Trillion) Forecast by Country, 2020-2035
  • Table 32: Western Europe Market Volume (Units) Forecast by Country, 2020-2035
  • Table 33: Western Europe Market Value (USD Trillion) Forecast by Class, 2020-2035
  • Table 34: Western Europe Market Volume (Units) Forecast by Class, 2020-2035
  • Table 35: Western Europe Market Value (USD Trillion) Forecast by Propulsion, 2020-2035
  • Table 36: Western Europe Market Volume (Units) Forecast by Propulsion, 2020-2035
  • Table 37: Western Europe Market Value (USD Trillion) Forecast by, 2020-2035
  • Table 38: Western Europe Market Volume (Units) Forecast by, 2020-2035
  • Table 39: Western Europe Market Value (USD Trillion) Forecast by Application, 2020-2035
  • Table 40: Western Europe Market Volume (Units) Forecast by Application, 2020-2035
  • Table 41: Eastern Europe Market Value (USD Trillion) Forecast by Country, 2020-2035
  • Table 42: Eastern Europe Market Volume (Units) Forecast by Country, 2020-2035
  • Table 43: Eastern Europe Market Value (USD Trillion) Forecast by Class, 2020-2035
  • Table 44: Eastern Europe Market Volume (Units) Forecast by Class, 2020-2035
  • Table 45: Eastern Europe Market Value (USD Trillion) Forecast by Propulsion, 2020-2035
  • Table 46: Eastern Europe Market Volume (Units) Forecast by Propulsion, 2020-2035
  • Table 47: Eastern Europe Market Value (USD Trillion) Forecast by, 2020-2035
  • Table 48: Eastern Europe Market Volume (Units) Forecast by, 2020-2035
  • Table 49: Eastern Europe Market Value (USD Trillion) Forecast by Application, 2020-2035
  • Table 50: Eastern Europe Market Volume (Units) Forecast by Application, 2020-2035
  • Table 51: East Asia Market Value (USD Trillion) Forecast by Country, 2020-2035
  • Table 52: East Asia Market Volume (Units) Forecast by Country, 2020-2035
  • Table 53: East Asia Market Value (USD Trillion) Forecast by Class, 2020-2035
  • Table 54: East Asia Market Volume (Units) Forecast by Class, 2020-2035
  • Table 55: East Asia Market Value (USD Trillion) Forecast by Propulsion, 2020-2035
  • Table 56: East Asia Market Volume (Units) Forecast by Propulsion, 2020-2035
  • Table 57: East Asia Market Value (USD Trillion) Forecast by, 2020-2035
  • Table 58: East Asia Market Volume (Units) Forecast by, 2020-2035
  • Table 59: East Asia Market Value (USD Trillion) Forecast by Application, 2020-2035
  • Table 60: East Asia Market Volume (Units) Forecast by Application, 2020-2035
  • Table 61: South Asia & Pacific Market Value (USD Trillion) Forecast by Country, 2020-2035
  • Table 62: South Asia & Pacific Market Volume (Units) Forecast by Country, 2020-2035
  • Table 63: South Asia & Pacific Market Value (USD Trillion) Forecast by Class, 2020-2035
  • Table 64: South Asia & Pacific Market Volume (Units) Forecast by Class, 2020-2035
  • Table 65: South Asia & Pacific Market Value (USD Trillion) Forecast by Propulsion, 2020-2035
  • Table 66: South Asia & Pacific Market Volume (Units) Forecast by Propulsion, 2020-2035
  • Table 67: South Asia & Pacific Market Value (USD Trillion) Forecast by, 2020-2035
  • Table 68: South Asia & Pacific Market Volume (Units) Forecast by, 2020-2035
  • Table 69: South Asia & Pacific Market Value (USD Trillion) Forecast by Application, 2020-2035
  • Table 70: South Asia & Pacific Market Volume (Units) Forecast by Application, 2020-2035
  • Table 71: Middle East and Africa Market Value (USD Trillion) Forecast by Country, 2020-2035
  • Table 72: Middle East and Africa Market Volume (Units) Forecast by Country, 2020-2035
  • Table 73: Middle East and Africa Market Value (USD Trillion) Forecast by Class, 2020-2035
  • Table 74: Middle East and Africa Market Volume (Units) Forecast by Class, 2020-2035
  • Table 75: Middle East and Africa Market Value (USD Trillion) Forecast by Propulsion, 2020-2035
  • Table 76: Middle East and Africa Market Volume (Units) Forecast by Propulsion, 2020-2035
  • Table 77: Middle East and Africa Market Value (USD Trillion) Forecast by, 2020-2035
  • Table 78: Middle East and Africa Market Volume (Units) Forecast by, 2020-2035
  • Table 79: Middle East and Africa Market Value (USD Trillion) Forecast by Application, 2020-2035
  • Table 80: Middle East and Africa Market Volume (Units) Forecast by Application, 2020-2035

List of Figures

  • Figure 1: Global Market Volume (Units) Forecast 2020-2035
  • Figure 2: Global Market Pricing Analysis
  • Figure 3: Global Market Value (USD Trillion) Forecast 2020-2035
  • Figure 4: Global Market Value Share and BPS Analysis by Class, 2025 and 2035
  • Figure 5: Global Market Y-o-Y Growth Comparison by Class, 2025-2035
  • Figure 6: Global Market Attractiveness Analysis by Class
  • Figure 7: Global Market Value Share and BPS Analysis by Propulsion, 2025 and 2035
  • Figure 8: Global Market Y-o-Y Growth Comparison by Propulsion, 2025-2035
  • Figure 9: Global Market Attractiveness Analysis by Propulsion
  • Figure 10: Global Market Value Share and BPS Analysis by, 2025 and 2035
  • Figure 11: Global Market Y-o-Y Growth Comparison by, 2025-2035
  • Figure 12: Global Market Attractiveness Analysis by
  • Figure 13: Global Market Value Share and BPS Analysis by Application, 2025 and 2035
  • Figure 14: Global Market Y-o-Y Growth Comparison by Application, 2025-2035
  • Figure 15: Global Market Attractiveness Analysis by Application
  • Figure 16: Global Market Value (USD Trillion) Share and BPS Analysis by Region, 2025 and 2035
  • Figure 17: Global Market Y-o-Y Growth Comparison by Region, 2025-2035
  • Figure 18: Global Market Attractiveness Analysis by Region
  • Figure 19: North America Market Incremental $ Opportunity, 2025-2035
  • Figure 20: Latin America Market Incremental $ Opportunity, 2025-2035
  • Figure 21: Western Europe Market Incremental $ Opportunity, 2025-2035
  • Figure 22: Eastern Europe Market Incremental $ Opportunity, 2025-2035
  • Figure 23: East Asia Market Incremental $ Opportunity, 2025-2035
  • Figure 24: South Asia & Pacific Market Incremental $ Opportunity, 2025-2035
  • Figure 25: Middle East and Africa Market Incremental $ Opportunity, 2025-2035
  • Figure 26: North America Market Value Share and BPS Analysis by Country, 2025 and 2035
  • Figure 27: North America Market Value Share and BPS Analysis by Class, 2025 and 2035
  • Figure 28: North America Market Y-o-Y Growth Comparison by Class, 2025-2035
  • Figure 29: North America Market Attractiveness Analysis by Class
  • Figure 30: North America Market Value Share and BPS Analysis by Propulsion, 2025 and 2035
  • Figure 31: North America Market Y-o-Y Growth Comparison by Propulsion, 2025-2035
  • Figure 32: North America Market Attractiveness Analysis by Propulsion
  • Figure 33: North America Market Value Share and BPS Analysis by, 2025 and 2035
  • Figure 34: North America Market Y-o-Y Growth Comparison by, 2025-2035
  • Figure 35: North America Market Attractiveness Analysis by
  • Figure 36: North America Market Value Share and BPS Analysis by Application, 2025 and 2035
  • Figure 37: North America Market Y-o-Y Growth Comparison by Application, 2025-2035
  • Figure 38: North America Market Attractiveness Analysis by Application
  • Figure 39: Latin America Market Value Share and BPS Analysis by Country, 2025 and 2035
  • Figure 40: Latin America Market Value Share and BPS Analysis by Class, 2025 and 2035
  • Figure 41: Latin America Market Y-o-Y Growth Comparison by Class, 2025-2035
  • Figure 42: Latin America Market Attractiveness Analysis by Class
  • Figure 43: Latin America Market Value Share and BPS Analysis by Propulsion, 2025 and 2035
  • Figure 44: Latin America Market Y-o-Y Growth Comparison by Propulsion, 2025-2035
  • Figure 45: Latin America Market Attractiveness Analysis by Propulsion
  • Figure 46: Latin America Market Value Share and BPS Analysis by, 2025 and 2035
  • Figure 47: Latin America Market Y-o-Y Growth Comparison by, 2025-2035
  • Figure 48: Latin America Market Attractiveness Analysis by
  • Figure 49: Latin America Market Value Share and BPS Analysis by Application, 2025 and 2035
  • Figure 50: Latin America Market Y-o-Y Growth Comparison by Application, 2025-2035
  • Figure 51: Latin America Market Attractiveness Analysis by Application
  • Figure 52: Western Europe Market Value Share and BPS Analysis by Country, 2025 and 2035
  • Figure 53: Western Europe Market Value Share and BPS Analysis by Class, 2025 and 2035
  • Figure 54: Western Europe Market Y-o-Y Growth Comparison by Class, 2025-2035
  • Figure 55: Western Europe Market Attractiveness Analysis by Class
  • Figure 56: Western Europe Market Value Share and BPS Analysis by Propulsion, 2025 and 2035
  • Figure 57: Western Europe Market Y-o-Y Growth Comparison by Propulsion, 2025-2035
  • Figure 58: Western Europe Market Attractiveness Analysis by Propulsion
  • Figure 59: Western Europe Market Value Share and BPS Analysis by, 2025 and 2035
  • Figure 60: Western Europe Market Y-o-Y Growth Comparison by, 2025-2035
  • Figure 61: Western Europe Market Attractiveness Analysis by
  • Figure 62: Western Europe Market Value Share and BPS Analysis by Application, 2025 and 2035
  • Figure 63: Western Europe Market Y-o-Y Growth Comparison by Application, 2025-2035
  • Figure 64: Western Europe Market Attractiveness Analysis by Application
  • Figure 65: Eastern Europe Market Value Share and BPS Analysis by Country, 2025 and 2035
  • Figure 66: Eastern Europe Market Value Share and BPS Analysis by Class, 2025 and 2035
  • Figure 67: Eastern Europe Market Y-o-Y Growth Comparison by Class, 2025-2035
  • Figure 68: Eastern Europe Market Attractiveness Analysis by Class
  • Figure 69: Eastern Europe Market Value Share and BPS Analysis by Propulsion, 2025 and 2035
  • Figure 70: Eastern Europe Market Y-o-Y Growth Comparison by Propulsion, 2025-2035
  • Figure 71: Eastern Europe Market Attractiveness Analysis by Propulsion
  • Figure 72: Eastern Europe Market Value Share and BPS Analysis by, 2025 and 2035
  • Figure 73: Eastern Europe Market Y-o-Y Growth Comparison by, 2025-2035
  • Figure 74: Eastern Europe Market Attractiveness Analysis by
  • Figure 75: Eastern Europe Market Value Share and BPS Analysis by Application, 2025 and 2035
  • Figure 76: Eastern Europe Market Y-o-Y Growth Comparison by Application, 2025-2035
  • Figure 77: Eastern Europe Market Attractiveness Analysis by Application
  • Figure 78: East Asia Market Value Share and BPS Analysis by Country, 2025 and 2035
  • Figure 79: East Asia Market Value Share and BPS Analysis by Class, 2025 and 2035
  • Figure 80: East Asia Market Y-o-Y Growth Comparison by Class, 2025-2035
  • Figure 81: East Asia Market Attractiveness Analysis by Class
  • Figure 82: East Asia Market Value Share and BPS Analysis by Propulsion, 2025 and 2035
  • Figure 83: East Asia Market Y-o-Y Growth Comparison by Propulsion, 2025-2035
  • Figure 84: East Asia Market Attractiveness Analysis by Propulsion
  • Figure 85: East Asia Market Value Share and BPS Analysis by, 2025 and 2035
  • Figure 86: East Asia Market Y-o-Y Growth Comparison by, 2025-2035
  • Figure 87: East Asia Market Attractiveness Analysis by
  • Figure 88: East Asia Market Value Share and BPS Analysis by Application, 2025 and 2035
  • Figure 89: East Asia Market Y-o-Y Growth Comparison by Application, 2025-2035
  • Figure 90: East Asia Market Attractiveness Analysis by Application
  • Figure 91: South Asia & Pacific Market Value Share and BPS Analysis by Country, 2025 and 2035
  • Figure 92: South Asia & Pacific Market Value Share and BPS Analysis by Class, 2025 and 2035
  • Figure 93: South Asia & Pacific Market Y-o-Y Growth Comparison by Class, 2025-2035
  • Figure 94: South Asia & Pacific Market Attractiveness Analysis by Class
  • Figure 95: South Asia & Pacific Market Value Share and BPS Analysis by Propulsion, 2025 and 2035
  • Figure 96: South Asia & Pacific Market Y-o-Y Growth Comparison by Propulsion, 2025-2035
  • Figure 97: South Asia & Pacific Market Attractiveness Analysis by Propulsion
  • Figure 98: South Asia & Pacific Market Value Share and BPS Analysis by, 2025 and 2035
  • Figure 99: South Asia & Pacific Market Y-o-Y Growth Comparison by, 2025-2035
  • Figure 100: South Asia & Pacific Market Attractiveness Analysis by
  • Figure 101: South Asia & Pacific Market Value Share and BPS Analysis by Application, 2025 and 2035
  • Figure 102: South Asia & Pacific Market Y-o-Y Growth Comparison by Application, 2025-2035
  • Figure 103: South Asia & Pacific Market Attractiveness Analysis by Application
  • Figure 104: Middle East and Africa Market Value Share and BPS Analysis by Country, 2025 and 2035
  • Figure 105: Middle East and Africa Market Value Share and BPS Analysis by Class, 2025 and 2035
  • Figure 106: Middle East and Africa Market Y-o-Y Growth Comparison by Class, 2025-2035
  • Figure 107: Middle East and Africa Market Attractiveness Analysis by Class
  • Figure 108: Middle East and Africa Market Value Share and BPS Analysis by Propulsion, 2025 and 2035
  • Figure 109: Middle East and Africa Market Y-o-Y Growth Comparison by Propulsion, 2025-2035
  • Figure 110: Middle East and Africa Market Attractiveness Analysis by Propulsion
  • Figure 111: Middle East and Africa Market Value Share and BPS Analysis by, 2025 and 2035
  • Figure 112: Middle East and Africa Market Y-o-Y Growth Comparison by, 2025-2035
  • Figure 113: Middle East and Africa Market Attractiveness Analysis by
  • Figure 114: Middle East and Africa Market Value Share and BPS Analysis by Application, 2025 and 2035
  • Figure 115: Middle East and Africa Market Y-o-Y Growth Comparison by Application, 2025-2035
  • Figure 116: Middle East and Africa Market Attractiveness Analysis by Application
  • Figure 117: Global Market - Tier Structure Analysis
  • Figure 118: Global Market - Company Share Analysis

Frequently Asked Questions

What is the projected size of the global truck market by 2035?

The market is expected to reach USD 24.78 trillion by 2035.

What CAGR will the global truck market record from 2025 to 2035?

It is forecast to grow at a CAGR of 11.8% during the period.

Which truck class holds the largest market share in 2025?

Class 8 trucks hold a 40% share in 2025.

What share does diesel propulsion account for in the truck market?

Diesel propulsion accounts for 68% of the market in 2025.

Which company is the leading player in the global truck market?

Daimler Trucks leads with a 9% market share in 2025.

Explore Similar Insights

Future Market Insights

Truck Market