Tunable Diode Laser Analyzer (TDLA) Market Outlook from 2025 to 2035

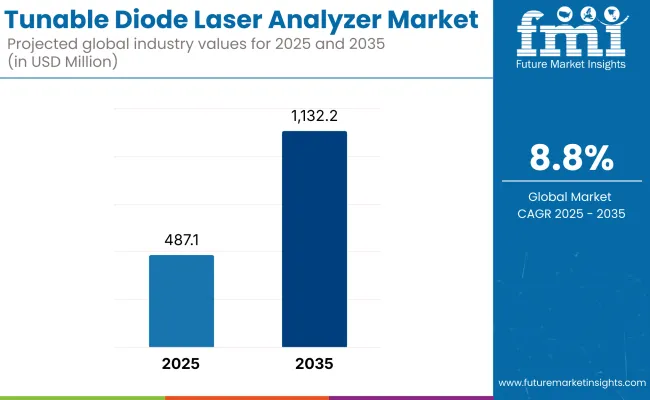
The Global tunable diode laser analyzer market value in the base year (2025) was estimated to be USD 487.1 million, and it is poised to reach USD 1,132.2 million by 2035, expanding at a CAGR of 8.8% through the forecast period. Rising environmental regulations, cross-process optimization, and further developments of laser-based spectroscopic techniques are some of the pivotal factors fostering the market growth.
Tunable Diode Laser Analyzer

Metric Value
Market Size (2025E) USD 487.1 Million
Market Value (2035F) USD 1,132.2 Million
CAGR (2025 to 2035) 8.8%

Also, this system has an exceptional efficacy in contrast to other gas measurement systems; therefore, the tunable diode laser analyzer market is anticipated to grow steadily from 2025 to 2035, owing to the increasing need for effective, accurate, real-time, pocket-friendly gas measurement technologies across multiple application zones. TDLAs have unique advantages like contactless measurement, insignificant maintenance, and excellent selectivity. They are well suited for applications within power generation, oil & gas, chemicals, as well as environmental substrata.

Tunable Diode Laser Analyzer (TDLA) Market - Segmentation Outlook

In-Situ Measurement and Oxygen Analyzer Segments Lead Market Growth with Advancements in Real-Time Gas Monitoring and Emission Control

The demand for the tunable diode laser analyser (TDLA) is on the rise with increasing inspections and monitoring government regulations, continuous real-time process optimization initiatives, and growing adoption in various industries, including oil & gas, chemical, power generation, among others, and environmental monitoring. TDLA-based lock-in technology, based on non-contact, high-precision gas measurement, good selectivity, and low maintenance time, gains your customer's favour.

By Measurement Type (2025)

In-Situ Measurement Dominates with Real-Time Monitoring Capabilities
Tunable Diode Laser Analyzer Mesurement Type

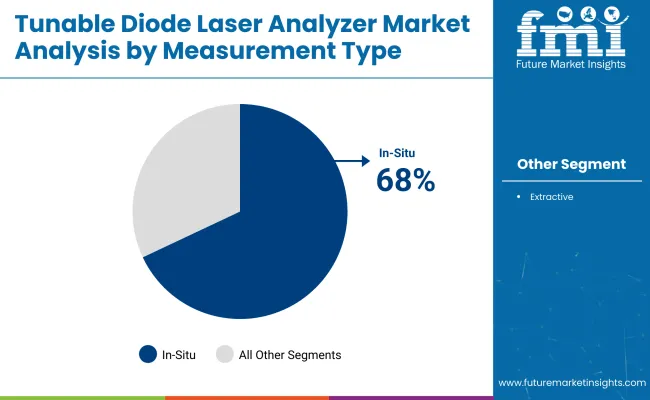
Measurement Type Market Share (2025)
In-Situ 68.0%

In-Situ TDLA segment leads the market with direct gas measurement in the process stream without extracting the sample. This provides fast response times, high accuracy, and minimal interference, which is perfect for tough industrial environments.

Smart factories and Industry 4.0 initiatives drive the use of in-situ analyzers, especially in combustion control, emissions monitoring, and safety compliance.

By Gas Analyzer Type (2025)

Oxygen Analyzer Segment Leads Due to Its Critical Role in Combustion Efficiency and Safety
Tunable Diode Laser Analyzer Lifting Capacity

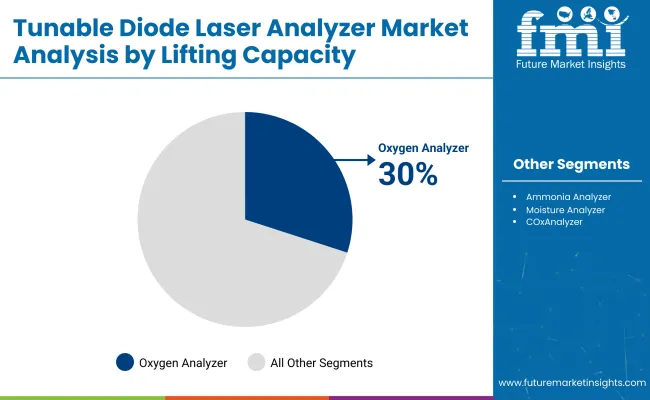
Gas Analyzer Type Market Share (2025)
Oxygen Analyzer 30.0%

Oxygen Analyzers Predominate Oxygen Analyzers hold the highest market share due to their extensive application in monitoring combustion efficiency, flue gas emissions, and process control (the 8% shares account for). In the coal, oil and incinerator industry, accurate oxygen levels allow for optimized and economical fuel use with reduced emissions.

The surge in need for energy efficiency and regulatory compliance has led to the installation of oxygen analyzers paired with TDLA systems. In addition, multi-gas monitoring systems combined with oxygen, moisture, and COx analyzers are gaining momentum for broader application scope.

Challenges and Opportunities

Challenge

High Cost of Deployment and Integration Complexity

High initial deployment costs and the complexity involved in integrating the technology with existing industrial infrastructure are some of the key challenges faced by the TDLA market. For small and medium-sized enterprises (SMEs), the cost of sophisticated FTIR gas analyzers and associated calibration systems can be unrecoverable. There is also a need for qualified personnel to work with the systems, performing diagnostics and interpreting the data.

Opportunity

Growth in Clean Energy and Emission Control Applications

Tunable diode laser analysis technology has excellent growth potential in the face of the worldwide promotion of clean energy production and stringent requirements for air pollution control. Applications like carbon capture and storage (CCS) systems, waste-to-energy plants, and the production of green hydrogen are largely continuous and in need of high-precision gas monitoring, fitting well with TDLA capabilities.

Additionally, integrating artificial intelligence (AI) and IoT technologies with TDLAs can enable new capabilities such as remote monitoring, predictive maintenance, and real-time analytics, providing enhanced value to end users across industries.
Country-wise Insights

Tunable Diode Laser Analyzer Country Wise

United States

The tunable diode laser analyzer market in the USA is growing. This growth is due to the need for quick and safe gas checks in industries. These include oil, gas, power plants, and chemical plants. Groups like the EPA and OSHA push for better gas detection to meet strict rules on emissions and safety.

Key trends show more companies want TDLA systems to find tiny amounts of harmful gases. These systems help in keeping an eye on burning processes. There is also more use of these tools in smart systems that watch industry operations.

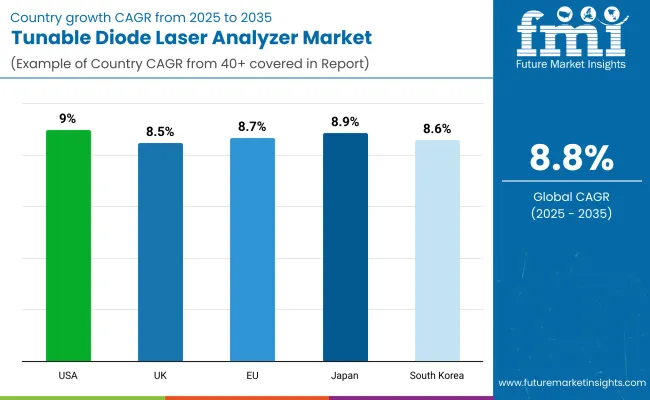
Country CAGR (2025 to 2035)
USA 9.0%

United Kingdom

In the UK, there's a growing need for exact gas measures in factories and green projects. The UK Environment Agency's rules and EU rules on emissions drive this need.

Tunable Diode Laser Analyser tools are now used in carbon capture systems. More focus is on finding methane leaks in gas setups. Smart analyzers are now key in green energy plans.

Country CAGR (2025 to 2035)
UK 8.5%

European Union

The European Union market for TDLA is growing fast because of tight environmental rules like the ones in the Industrial Emissions Directive (IED) and the EU ETS. People need good gas checkers to help make processes better, cut down emissions, and save energy.

Countries like Germany, France, and Italy are the main users. Key trends include using them more in cleaning smoke from gases, keeping watch over processes in oil refineries, and new small laser tools that work well in tough spots.

Region CAGR (2025 to 2035)
European Union 8.7%

Japan

Japan’s TDLA market grows thanks to its strong industry and focus on keeping the environment clean. Rules from the Ministry of the Environment and the Ministry of Economy, Trade and Industry (METI) back clean air laws. These rules push for gas check systems in power plants and factories.

Key trends show more use in burning waste, clean rooms, and making computer chips. There’s also more money put into new laser tech and making TDLA systems at home.

Country CAGR (2025 to 2035)
Japan 8.9%

South Korea

The TDLA market in South Korea is growing fast because the petrochemical, chip, and energy fields are expanding. Rules from the Ministry of Environment and the Ministry of Trade, Industry, and Energy aim to cut down emissions and boost how well processes work.

New trends show more TDLA systems in power plants and oil refineries, link-ups with smart factory setups, and progress in measuring many gases at once.

Country CAGR (2025 to 2035)
South Korea 8.6%

Competitive Outlook

The tunable diode laser analyzer market is seeing strong growth. Strict rules for the environment, the need for gas tests now, and more use of automation in fields like oil, gas, chemicals, and power are pushing this growth. TDLAs give accurate results fast and need little upkeep. They are good for checking emissions all the time and helping control processes.

They find low gas levels well and help run things better while meeting the rules. As firms aim for cleaner actions and saving energy, the need for good, low-cost gas testers like TDLAs grows. This boosts new ideas and market growth around the world.
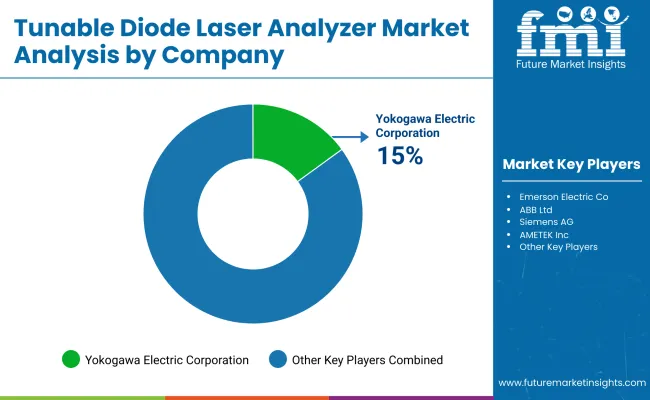
Key Company Insights

Tunable Diode Laser Analyzer By Company

Yokogawa Electric Corporation (15-18%)

Yokogawa focuses on enhancing its TDLA offerings with advanced features and integration capabilities, strengthening its position in the Asia-Pacific region.

Emerson Electric Co. (12-15%)

Emerson emphasizes innovation by combining multiple laser technologies to provide comprehensive gas analysis solutions, catering to a broad range of industries.

ABB Ltd. (10-13%)

ABB leverages its digital solutions to offer precise and reliable gas analyzers, integrating them into its ABB Ability™ platform for enhanced data analytics.

Siemens AG (8-11%)

Siemens focuses on compact and robust designs suitable for challenging industrial applications, ensuring reliability and ease of integration.

AMETEK Inc. (6-9%)

AMETEK expands its market presence through strategic acquisitions, enhancing its portfolio in process analytical instruments and extending its global reach.

Other Key Players (35-49% Combined)

Several other companies contribute significantly to the TDLA market:

  • SICK AG- Offers a range of gas analyzers with a focus on environmental monitoring and process control.
  • Servomex Limited - Experts in gas checking tools used for safety and making processes better.
  • METTLER TOLEDO - Sells precise gear and help services, also gas checkers for many industrial uses.
  • Neo Monitors AS - Works with laser gas check tools for oil, gas, and chemical fields.
  • Endress+Hauser Group - Gives a wide range of measurement tools, like TDLAs, for process work.

Key Segments

By Measurement Type:

  • In-Situ
  • Extractive

By Gas Analyzer Type:

  • Oxygen Analyzer
  • Ammonia Analyzer
  • Moisture Analyzer
  • COxAnalyzer
  • HxAnalyzer
  • CxHxAnalyzer
  • Others

By Application:

  • Velocity Measurement
  • Incineration
  • Emission Monitoring
  • Mass Flow Monitoring
  • Natural Gas
  • Refinery Fuel Gas
  • Electric Arc Furnace
  • Others

By End User Industry:

  • Chemical
  • Oil & Gas
  • Mining
  • Energy & Power
  • Water and Wastewater Treatment
  • Food & Beverage
  • Others

By Region:

  • North America
  • Latin America
  • Western Europe
  • Eastern Europe
  • East Asia
  • South Asia Pacific
  • Middle East and Africa

Table of Content

  1. Executive Summary
  2. Industry Introduction, including Taxonomy and Market Definition
  3. Market Trends and Success Factors, including Macro-economic Factors, Market Dynamics, and Recent Industry Developments
  4. Global Market Demand Analysis 2020 to 2024 and Forecast 2025 to 2035, including Historical Analysis and Future Projections
  5. Pricing Analysis
  6. Global Market Analysis 2020 to 2024 and Forecast 2025 to 2035
    • Measurement Type
    • Gas Analyzer Type
    • Application
    • End User Industry
  7. Global Market Analysis 2020 to 2024 and Forecast 2025 to 2035, By Measurement Type
    • In-Situ
    • Extractive
  8. Global Market Analysis 2020 to 2024 and Forecast 2025 to 2035, By Gas Analyzer Type
    • Oxygen Analyzer
    • Ammonia Analyzer
    • Moisture Analyzer
    • COx Analyzer
    • Hx Analyzer
    • CxHx Analyzer
    • Others
  9. Global Market Analysis 2020 to 2024 and Forecast 2025 to 2035, By Application
    • Velocity Measurement
    • Incineration
    • Emission Monitoring
    • Mass Flow Monitoring
    • Natural Gas
    • Refinery Fuel Gas
    • Electric Arc Furnace
    • Others
  10. Global Market Analysis 2020 to 2024 and Forecast 2025 to 2035, By End User Industry
    • Chemical
    • Oil & Gas
    • Mining
    • Energy & Power
    • Water and Wastewater Treatment
    • Food & Beverage
    • Others
  11. Global Market Analysis 2020 to 2024 and Forecast 2025 to 2035, By Region
    • North America
    • Latin America
    • Western Europe
    • Eastern Europe
    • East Asia
    • South Asia Pacific
    • Middle East and Africa
  12. North America Sales Analysis 2020 to 2024 and Forecast 2025 to 2035, by Key Segments and Countries
  13. Latin America Sales Analysis 2020 to 2024 and Forecast 2025 to 2035, by Key Segments and Countries
  14. Western Europe Sales Analysis 2020 to 2024 and Forecast 2025 to 2035, by Key Segments and Countries
  15. Eastern Europe Sales Analysis 2020 to 2024 and Forecast 2025 to 2035, by Key Segments and Countries
  16. East Asia Sales Analysis 2020 to 2024 and Forecast 2025 to 2035, by Key Segments and Countries
  17. South Asia Pacific Sales Analysis 2020 to 2024 and Forecast 2025 to 2035, by Key Segments and Countries
  18. Middle East and Africa Sales Analysis 2020 to 2024 and Forecast 2025 to 2035, by Key Segments and Countries
  19. Sales Forecast 2025 to 2035 by Measurement Type, Gas Analyzer Type, Application, and End User Industry for 30 Countries
  20. Competition Outlook, including Market Structure Analysis, Company Share Analysis by Key Players, and Competition Dashboard
  21. Company Profile
    • ABB
    • AMETEK Inc.
    • Analytical Technology and Control Limited
    • Campbell Scientific, Inc.
    • Emerson Electric Co.
    • Mettler Toledo
    • NEO Monitors AS
    • Servomex
    • SICK AG
    • Siemens AG

List of Tables

  • Table 1: Global Market Value (USD Million) Forecast by Region, 2020 to 2035
  • Table 2: Global Market Volume (000 Units) Forecast by Region, 2020 to 2035
  • Table 3: Global Market Value (USD Million) Forecast by Application, 2020 to 2035
  • Table 4: Global Market Volume (000 Units) Forecast by Application, 2020 to 2035
  • Table 5: Global Market Value (USD Million) Forecast by End Use, 2020 to 2035
  • Table 6: Global Market Volume (000 Units) Forecast by End Use, 2020 to 2035
  • Table 7: Global Market Value (USD Million) Forecast by Product Type, 2020 to 2035
  • Table 8: Global Market Volume (000 Units) Forecast by Product Type, 2020 to 2035
  • Table 9: North America Market Value (USD Million) Forecast by Country, 2020 to 2035
  • Table 10: North America Market Volume (000 Units) Forecast by Country, 2020 to 2035
  • Table 11: North America Market Value (USD Million) Forecast by Application, 2020 to 2035
  • Table 12: North America Market Volume (000 Units) Forecast by Application, 2020 to 2035
  • Table 13: North America Market Value (USD Million) Forecast by End Use, 2020 to 2035
  • Table 14: North America Market Volume (000 Units) Forecast by End Use, 2020 to 2035
  • Table 15: North America Market Value (USD Million) Forecast by Product Type, 2020 to 2035
  • Table 16: North America Market Volume (000 Units) Forecast by Product Type, 2020 to 2035
  • Table 17: Latin America Market Value (USD Million) Forecast by Country, 2020 to 2035
  • Table 18: Latin America Market Volume (000 Units) Forecast by Country, 2020 to 2035
  • Table 19: Latin America Market Value (USD Million) Forecast by Application, 2020 to 2035
  • Table 20: Latin America Market Volume (000 Units) Forecast by Application, 2020 to 2035
  • Table 21: Latin America Market Value (USD Million) Forecast by End Use, 2020 to 2035
  • Table 22: Latin America Market Volume (000 Units) Forecast by End Use, 2020 to 2035
  • Table 23: Latin America Market Value (USD Million) Forecast by Product Type, 2020 to 2035
  • Table 24: Latin America Market Volume (000 Units) Forecast by Product Type, 2020 to 2035
  • Table 25: Europe Market Value (USD Million) Forecast by Country, 2020 to 2035
  • Table 26: Europe Market Volume (000 Units) Forecast by Country, 2020 to 2035
  • Table 27: Europe Market Value (USD Million) Forecast by Application, 2020 to 2035
  • Table 28: Europe Market Volume (000 Units) Forecast by Application, 2020 to 2035
  • Table 29: Europe Market Value (USD Million) Forecast by End Use, 2020 to 2035
  • Table 30: Europe Market Volume (000 Units) Forecast by End Use, 2020 to 2035
  • Table 31: Europe Market Value (USD Million) Forecast by Product Type, 2020 to 2035
  • Table 32: Europe Market Volume (000 Units) Forecast by Product Type, 2020 to 2035
  • Table 33: East Asia Market Value (USD Million) Forecast by Country, 2020 to 2035
  • Table 34: East Asia Market Volume (000 Units) Forecast by Country, 2020 to 2035
  • Table 35: East Asia Market Value (USD Million) Forecast by Application, 2020 to 2035
  • Table 36: East Asia Market Volume (000 Units) Forecast by Application, 2020 to 2035
  • Table 37: East Asia Market Value (USD Million) Forecast by End Use, 2020 to 2035
  • Table 38: East Asia Market Volume (000 Units) Forecast by End Use, 2020 to 2035
  • Table 39: East Asia Market Value (USD Million) Forecast by Product Type, 2020 to 2035
  • Table 40: East Asia Market Volume (000 Units) Forecast by Product Type, 2020 to 2035
  • Table 41: South Asia & Pacific Market Value (USD Million) Forecast by Country, 2020 to 2035
  • Table 42: South Asia & Pacific Market Volume (000 Units) Forecast by Country, 2020 to 2035
  • Table 43: South Asia & Pacific Market Value (USD Million) Forecast by Application, 2020 to 2035
  • Table 44: South Asia & Pacific Market Volume (000 Units) Forecast by Application, 2020 to 2035
  • Table 45: South Asia & Pacific Market Value (USD Million) Forecast by End Use, 2020 to 2035
  • Table 46: South Asia & Pacific Market Volume (000 Units) Forecast by End Use, 2020 to 2035
  • Table 47: South Asia & Pacific Market Value (USD Million) Forecast by Product Type, 2020 to 2035
  • Table 48: South Asia & Pacific Market Volume (000 Units) Forecast by Product Type, 2020 to 2035
  • Table 49: MEA Market Value (USD Million) Forecast by Country, 2020 to 2035
  • Table 50: MEA Market Volume (000 Units) Forecast by Country, 2020 to 2035
  • Table 51: MEA Market Value (USD Million) Forecast by Application, 2020 to 2035
  • Table 52: MEA Market Volume (000 Units) Forecast by Application, 2020 to 2035
  • Table 53: MEA Market Value (USD Million) Forecast by End Use, 2020 to 2035
  • Table 54: MEA Market Volume (000 Units) Forecast by End Use, 2020 to 2035
  • Table 55: MEA Market Value (USD Million) Forecast by Product Type, 2020 to 2035
  • Table 56: MEA Market Volume (000 Units) Forecast by Product Type, 2020 to 2035

List of Figures

  • Figure 1: Global Market Value (USD Million) by Application, 2025 to 2035
  • Figure 2: Global Market Value (USD Million) by End Use, 2025 to 2035
  • Figure 3: Global Market Value (USD Million) by Product Type, 2025 to 2035
  • Figure 4: Global Market Value (USD Million) by Region, 2025 to 2035
  • Figure 5: Global Market Value (USD Million) Analysis by Region, 2020 to 2035
  • Figure 6: Global Market Volume (000 Units) Analysis by Region, 2020 to 2035
  • Figure 7: Global Market Value Share (%) and BPS Analysis by Region, 2025 to 2035
  • Figure 8: Global Market Y-o-Y Growth (%) Projections by Region, 2025 to 2035
  • Figure 9: Global Market Value (USD Million) Analysis by Application, 2020 to 2035
  • Figure 10: Global Market Volume (000 Units) Analysis by Application, 2020 to 2035
  • Figure 11: Global Market Value Share (%) and BPS Analysis by Application, 2025 to 2035
  • Figure 12: Global Market Y-o-Y Growth (%) Projections by Application, 2025 to 2035
  • Figure 13: Global Market Value (USD Million) Analysis by End Use, 2020 to 2035
  • Figure 14: Global Market Volume (000 Units) Analysis by End Use, 2020 to 2035
  • Figure 15: Global Market Value Share (%) and BPS Analysis by End Use, 2025 to 2035
  • Figure 16: Global Market Y-o-Y Growth (%) Projections by End Use, 2025 to 2035
  • Figure 17: Global Market Value (USD Million) Analysis by Product Type, 2020 to 2035
  • Figure 18: Global Market Volume (000 Units) Analysis by Product Type, 2020 to 2035
  • Figure 19: Global Market Value Share (%) and BPS Analysis by Product Type, 2025 to 2035
  • Figure 20: Global Market Y-o-Y Growth (%) Projections by Product Type, 2025 to 2035
  • Figure 21: Global Market Attractiveness by Application, 2025 to 2035
  • Figure 22: Global Market Attractiveness by End Use, 2025 to 2035
  • Figure 23: Global Market Attractiveness by Product Type, 2025 to 2035
  • Figure 24: Global Market Attractiveness by Region, 2025 to 2035
  • Figure 25: North America Market Value (USD Million) by Application, 2025 to 2035
  • Figure 26: North America Market Value (USD Million) by End Use, 2025 to 2035
  • Figure 27: North America Market Value (USD Million) by Product Type, 2025 to 2035
  • Figure 28: North America Market Value (USD Million) by Country, 2025 to 2035
  • Figure 29: North America Market Value (USD Million) Analysis by Country, 2020 to 2035
  • Figure 30: North America Market Volume (000 Units) Analysis by Country, 2020 to 2035
  • Figure 31: North America Market Value Share (%) and BPS Analysis by Country, 2025 to 2035
  • Figure 32: North America Market Y-o-Y Growth (%) Projections by Country, 2025 to 2035
  • Figure 33: North America Market Value (USD Million) Analysis by Application, 2020 to 2035
  • Figure 34: North America Market Volume (000 Units) Analysis by Application, 2020 to 2035
  • Figure 35: North America Market Value Share (%) and BPS Analysis by Application, 2025 to 2035
  • Figure 36: North America Market Y-o-Y Growth (%) Projections by Application, 2025 to 2035
  • Figure 37: North America Market Value (USD Million) Analysis by End Use, 2020 to 2035
  • Figure 38: North America Market Volume (000 Units) Analysis by End Use, 2020 to 2035
  • Figure 39: North America Market Value Share (%) and BPS Analysis by End Use, 2025 to 2035
  • Figure 40: North America Market Y-o-Y Growth (%) Projections by End Use, 2025 to 2035
  • Figure 41: North America Market Value (USD Million) Analysis by Product Type, 2020 to 2035
  • Figure 42: North America Market Volume (000 Units) Analysis by Product Type, 2020 to 2035
  • Figure 43: North America Market Value Share (%) and BPS Analysis by Product Type, 2025 to 2035
  • Figure 44: North America Market Y-o-Y Growth (%) Projections by Product Type, 2025 to 2035
  • Figure 45: North America Market Attractiveness by Application, 2025 to 2035
  • Figure 46: North America Market Attractiveness by End Use, 2025 to 2035
  • Figure 47: North America Market Attractiveness by Product Type, 2025 to 2035
  • Figure 48: North America Market Attractiveness by Country, 2025 to 2035
  • Figure 49: Latin America Market Value (USD Million) by Application, 2025 to 2035
  • Figure 50: Latin America Market Value (USD Million) by End Use, 2025 to 2035
  • Figure 51: Latin America Market Value (USD Million) by Product Type, 2025 to 2035
  • Figure 52: Latin America Market Value (USD Million) by Country, 2025 to 2035
  • Figure 53: Latin America Market Value (USD Million) Analysis by Country, 2020 to 2035
  • Figure 54: Latin America Market Volume (000 Units) Analysis by Country, 2020 to 2035
  • Figure 55: Latin America Market Value Share (%) and BPS Analysis by Country, 2025 to 2035
  • Figure 56: Latin America Market Y-o-Y Growth (%) Projections by Country, 2025 to 2035
  • Figure 57: Latin America Market Value (USD Million) Analysis by Application, 2020 to 2035
  • Figure 58: Latin America Market Volume (000 Units) Analysis by Application, 2020 to 2035
  • Figure 59: Latin America Market Value Share (%) and BPS Analysis by Application, 2025 to 2035
  • Figure 60: Latin America Market Y-o-Y Growth (%) Projections by Application, 2025 to 2035
  • Figure 61: Latin America Market Value (USD Million) Analysis by End Use, 2020 to 2035
  • Figure 62: Latin America Market Volume (000 Units) Analysis by End Use, 2020 to 2035
  • Figure 63: Latin America Market Value Share (%) and BPS Analysis by End Use, 2025 to 2035
  • Figure 64: Latin America Market Y-o-Y Growth (%) Projections by End Use, 2025 to 2035
  • Figure 65: Latin America Market Value (USD Million) Analysis by Product Type, 2020 to 2035
  • Figure 66: Latin America Market Volume (000 Units) Analysis by Product Type, 2020 to 2035
  • Figure 67: Latin America Market Value Share (%) and BPS Analysis by Product Type, 2025 to 2035
  • Figure 68: Latin America Market Y-o-Y Growth (%) Projections by Product Type, 2025 to 2035
  • Figure 69: Latin America Market Attractiveness by Application, 2025 to 2035
  • Figure 70: Latin America Market Attractiveness by End Use, 2025 to 2035
  • Figure 71: Latin America Market Attractiveness by Product Type, 2025 to 2035
  • Figure 72: Latin America Market Attractiveness by Country, 2025 to 2035
  • Figure 73: Europe Market Value (USD Million) by Application, 2025 to 2035
  • Figure 74: Europe Market Value (USD Million) by End Use, 2025 to 2035
  • Figure 75: Europe Market Value (USD Million) by Product Type, 2025 to 2035
  • Figure 76: Europe Market Value (USD Million) by Country, 2025 to 2035
  • Figure 77: Europe Market Value (USD Million) Analysis by Country, 2020 to 2035
  • Figure 78: Europe Market Volume (000 Units) Analysis by Country, 2020 to 2035
  • Figure 79: Europe Market Value Share (%) and BPS Analysis by Country, 2025 to 2035
  • Figure 80: Europe Market Y-o-Y Growth (%) Projections by Country, 2025 to 2035
  • Figure 81: Europe Market Value (USD Million) Analysis by Application, 2020 to 2035
  • Figure 82: Europe Market Volume (000 Units) Analysis by Application, 2020 to 2035
  • Figure 83: Europe Market Value Share (%) and BPS Analysis by Application, 2025 to 2035
  • Figure 84: Europe Market Y-o-Y Growth (%) Projections by Application, 2025 to 2035
  • Figure 85: Europe Market Value (USD Million) Analysis by End Use, 2020 to 2035
  • Figure 86: Europe Market Volume (000 Units) Analysis by End Use, 2020 to 2035
  • Figure 87: Europe Market Value Share (%) and BPS Analysis by End Use, 2025 to 2035
  • Figure 88: Europe Market Y-o-Y Growth (%) Projections by End Use, 2025 to 2035
  • Figure 89: Europe Market Value (USD Million) Analysis by Product Type, 2020 to 2035
  • Figure 90: Europe Market Volume (000 Units) Analysis by Product Type, 2020 to 2035
  • Figure 91: Europe Market Value Share (%) and BPS Analysis by Product Type, 2025 to 2035
  • Figure 92: Europe Market Y-o-Y Growth (%) Projections by Product Type, 2025 to 2035
  • Figure 93: Europe Market Attractiveness by Application, 2025 to 2035
  • Figure 94: Europe Market Attractiveness by End Use, 2025 to 2035
  • Figure 95: Europe Market Attractiveness by Product Type, 2025 to 2035
  • Figure 96: Europe Market Attractiveness by Country, 2025 to 2035
  • Figure 97: East Asia Market Value (USD Million) by Application, 2025 to 2035
  • Figure 98: East Asia Market Value (USD Million) by End Use, 2025 to 2035
  • Figure 99: East Asia Market Value (USD Million) by Product Type, 2025 to 2035
  • Figure 100: East Asia Market Value (USD Million) by Country, 2025 to 2035
  • Figure 101: East Asia Market Value (USD Million) Analysis by Country, 2020 to 2035
  • Figure 102: East Asia Market Volume (000 Units) Analysis by Country, 2020 to 2035
  • Figure 103: East Asia Market Value Share (%) and BPS Analysis by Country, 2025 to 2035
  • Figure 104: East Asia Market Y-o-Y Growth (%) Projections by Country, 2025 to 2035
  • Figure 105: East Asia Market Value (USD Million) Analysis by Application, 2020 to 2035
  • Figure 106: East Asia Market Volume (000 Units) Analysis by Application, 2020 to 2035
  • Figure 107: East Asia Market Value Share (%) and BPS Analysis by Application, 2025 to 2035
  • Figure 108: East Asia Market Y-o-Y Growth (%) Projections by Application, 2025 to 2035
  • Figure 109: East Asia Market Value (USD Million) Analysis by End Use, 2020 to 2035
  • Figure 110: East Asia Market Volume (000 Units) Analysis by End Use, 2020 to 2035
  • Figure 111: East Asia Market Value Share (%) and BPS Analysis by End Use, 2025 to 2035
  • Figure 112: East Asia Market Y-o-Y Growth (%) Projections by End Use, 2025 to 2035
  • Figure 113: East Asia Market Value (USD Million) Analysis by Product Type, 2020 to 2035
  • Figure 114: East Asia Market Volume (000 Units) Analysis by Product Type, 2020 to 2035
  • Figure 115: East Asia Market Value Share (%) and BPS Analysis by Product Type, 2025 to 2035
  • Figure 116: East Asia Market Y-o-Y Growth (%) Projections by Product Type, 2025 to 2035
  • Figure 117: East Asia Market Attractiveness by Application, 2025 to 2035
  • Figure 118: East Asia Market Attractiveness by End Use, 2025 to 2035
  • Figure 119: East Asia Market Attractiveness by Product Type, 2025 to 2035
  • Figure 120: East Asia Market Attractiveness by Country, 2025 to 2035
  • Figure 121: South Asia & Pacific Market Value (USD Million) by Application, 2025 to 2035
  • Figure 122: South Asia & Pacific Market Value (USD Million) by End Use, 2025 to 2035
  • Figure 123: South Asia & Pacific Market Value (USD Million) by Product Type, 2025 to 2035
  • Figure 124: South Asia & Pacific Market Value (USD Million) by Country, 2025 to 2035
  • Figure 125: South Asia & Pacific Market Value (USD Million) Analysis by Country, 2020 to 2035
  • Figure 126: South Asia & Pacific Market Volume (000 Units) Analysis by Country, 2020 to 2035
  • Figure 127: South Asia & Pacific Market Value Share (%) and BPS Analysis by Country, 2025 to 2035
  • Figure 128: South Asia & Pacific Market Y-o-Y Growth (%) Projections by Country, 2025 to 2035
  • Figure 129: South Asia & Pacific Market Value (USD Million) Analysis by Application, 2020 to 2035
  • Figure 130: South Asia & Pacific Market Volume (000 Units) Analysis by Application, 2020 to 2035
  • Figure 131: South Asia & Pacific Market Value Share (%) and BPS Analysis by Application, 2025 to 2035
  • Figure 132: South Asia & Pacific Market Y-o-Y Growth (%) Projections by Application, 2025 to 2035
  • Figure 133: South Asia & Pacific Market Value (USD Million) Analysis by End Use, 2020 to 2035
  • Figure 134: South Asia & Pacific Market Volume (000 Units) Analysis by End Use, 2020 to 2035
  • Figure 135: South Asia & Pacific Market Value Share (%) and BPS Analysis by End Use, 2025 to 2035
  • Figure 136: South Asia & Pacific Market Y-o-Y Growth (%) Projections by End Use, 2025 to 2035
  • Figure 137: South Asia & Pacific Market Value (USD Million) Analysis by Product Type, 2020 to 2035
  • Figure 138: South Asia & Pacific Market Volume (000 Units) Analysis by Product Type, 2020 to 2035
  • Figure 139: South Asia & Pacific Market Value Share (%) and BPS Analysis by Product Type, 2025 to 2035
  • Figure 140: South Asia & Pacific Market Y-o-Y Growth (%) Projections by Product Type, 2025 to 2035
  • Figure 141: South Asia & Pacific Market Attractiveness by Application, 2025 to 2035
  • Figure 142: South Asia & Pacific Market Attractiveness by End Use, 2025 to 2035
  • Figure 143: South Asia & Pacific Market Attractiveness by Product Type, 2025 to 2035
  • Figure 144: South Asia & Pacific Market Attractiveness by Country, 2025 to 2035
  • Figure 145: MEA Market Value (USD Million) by Application, 2025 to 2035
  • Figure 146: MEA Market Value (USD Million) by End Use, 2025 to 2035
  • Figure 147: MEA Market Value (USD Million) by Product Type, 2025 to 2035
  • Figure 148: MEA Market Value (USD Million) by Country, 2025 to 2035
  • Figure 149: MEA Market Value (USD Million) Analysis by Country, 2020 to 2035
  • Figure 150: MEA Market Volume (000 Units) Analysis by Country, 2020 to 2035
  • Figure 151: MEA Market Value Share (%) and BPS Analysis by Country, 2025 to 2035
  • Figure 152: MEA Market Y-o-Y Growth (%) Projections by Country, 2025 to 2035
  • Figure 153: MEA Market Value (USD Million) Analysis by Application, 2020 to 2035
  • Figure 154: MEA Market Volume (000 Units) Analysis by Application, 2020 to 2035
  • Figure 155: MEA Market Value Share (%) and BPS Analysis by Application, 2025 to 2035
  • Figure 156: MEA Market Y-o-Y Growth (%) Projections by Application, 2025 to 2035
  • Figure 157: MEA Market Value (USD Million) Analysis by End Use, 2020 to 2035
  • Figure 158: MEA Market Volume (000 Units) Analysis by End Use, 2020 to 2035
  • Figure 159: MEA Market Value Share (%) and BPS Analysis by End Use, 2025 to 2035
  • Figure 160: MEA Market Y-o-Y Growth (%) Projections by End Use, 2025 to 2035
  • Figure 161: MEA Market Value (USD Million) Analysis by Product Type, 2020 to 2035
  • Figure 162: MEA Market Volume (000 Units) Analysis by Product Type, 2020 to 2035
  • Figure 163: MEA Market Value Share (%) and BPS Analysis by Product Type, 2025 to 2035
  • Figure 164: MEA Market Y-o-Y Growth (%) Projections by Product Type, 2025 to 2035
  • Figure 165: MEA Market Attractiveness by Application, 2025 to 2035
  • Figure 166: MEA Market Attractiveness by End Use, 2025 to 2035
  • Figure 167: MEA Market Attractiveness by Product Type, 2025 to 2035
  • Figure 168: MEA Market Attractiveness by Country, 2025 to 2035

Frequently Asked Questions

What was the overall size of the tunable diode laser analyzer market in 2025?

The overall market size for the tunable diode laser analyzer market was approximately USD 487.1 Million in 2025.

How big is the tunable diode laser analyzer market expected to be in 2035?

The tunable diode laser analyzer market is projected to reach approximately USD 1,132.2 Million by 2035.

What will drive the demand for the tunable diode laser analyzer market during the forecast period?

The demand is expected to be driven by strict environmental regulations, heightened focus on workplace safety, rapid industrialization in emerging economies, and increased process automation across various industries.

List the top 5 countries contributing to the tunable diode laser analyzer market.

The United States, China, Germany, Japan, and India are key contributors to the market.

Which segment in measurement type is expected to lead in the tunable diode laser analyzer market?

The in-situ measurement segment is expected to lead due to its advantages in providing real-time analysis and minimal sample preparation.

Explore Similar Insights

Future Market Insights

Tunable Diode Laser Analyzer (TDLA) Market