Demand for Rice Bran Fatty Alcohols in UK (2025-2035)

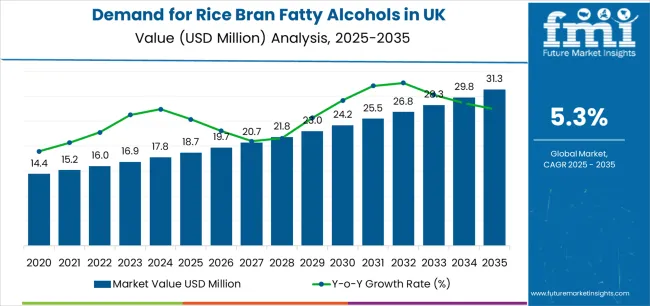
The demand for rice bran fatty alcohols in the UK is set to rise from USD 18.7 million in 2025 to USD 31.2 million by 2035, adding USD 12.5 million in new value and advancing at a CAGR of 5.3%. Growth is shaped by expanding pharmaceutical formulation requirements, wider adoption of bio-derived ingredient systems, and stronger preference for natural chemical inputs across healthcare, cosmetics, and beverage processing. The initial period from 2025 to 2030 contributes 40.8% of the decade growth as manufacturing clusters prioritise upgrades in purity-controlled ingredient sourcing and integrate higher-performing bio-based alcohol systems into formulation lines. Subsequent expansion through 2035 reflects deeper adoption of advanced bio-processing frameworks, rising regulatory scrutiny of formulation purity, and growing operational emphasis on natural input consistency across England and Scotland.

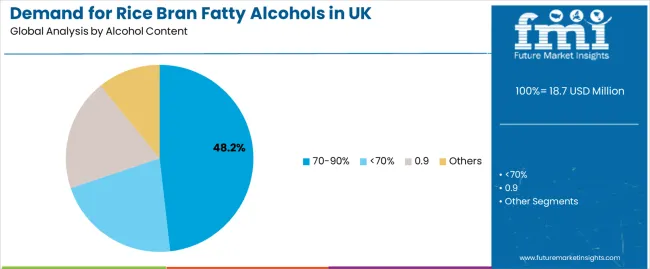
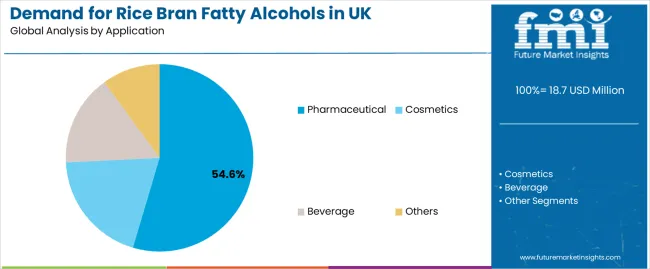
Segment dynamics are defined by the dominance of the 70-90% alcohol content category, which holds a 48.2% share, due to its compatibility with pharmaceutical purity standards and broad acceptance across healthcare formulations. Its balance of stability, biocompatibility, and ease of integration reinforces its role as the preferred grade for drug manufacturing and therapeutic systems. The pharmaceutical segment, accounting for a 54.6% share, leads national demand as drug manufacturers scale formulation pipelines and adopt cleaner, bio-based intermediates that reduce process risk and improve regulatory conformity. England anchors demand due to its dense pharmaceutical corridors and strong R&D presence. 
Quick Stats for UK Rice Bran Fatty Alcohols

  • UK Rice Bran Fatty Alcohols Sales Value (2025): USD 18.7 million
  • UK Rice Bran Fatty Alcohols Forecast Value (2035): USD 31.2 million
  • UK Rice Bran Fatty Alcohols Forecast CAGR: 5.3%
  • Leading Alcohol Content Category in UK Rice Bran Fatty Alcohols Demand: 70-90% (48.2%)
  • Key Growth Regions in UK Rice Bran Fatty Alcohols Demand: England, Scotland, Wales, and Northern Ireland
  • Regional Leadership: England holds the leading position in demand
  • Key Players in UK Rice Bran Fatty Alcohols Demand: NOF CORPORATION, Oryza Oil & Fat Chemical, SVR Gaia, Eastman Chemical Company, Croda International

Demand For Rice Bran Fatty Alcohols In Uk Market Value Analysis

Increasing integration of rice bran fatty alcohols in pharmaceutical formulations and growing adoption of natural ingredient technologies continue to drive demand. Pharmaceutical companies are expanding their production capabilities to address the growing complexity of modern healthcare requirements and formulation specifications, with UK operations leading investments in advanced alcohol systems.

From 2030 to 2035, demand is forecast to grow from USD 23.8 million to USD 31.2 million, adding another USD 7.4 million, which constitutes 59.2% of the overall ten-year expansion. This period is expected to be characterized by expansion of next-generation pharmaceutical technologies, integration of advanced bio-based systems and quality protocols, and development of specialized healthcare pathways across different pharmaceutical applications. The growing adoption of natural ingredient principles and enhanced pharmaceutical system requirements, particularly in England and Scotland regions, will drive demand for more sophisticated alcohol systems and specialized bio-derived solutions.

Between 2020 and 2025, rice bran fatty alcohol demand in the UK experienced steady expansion, driven by increasing pharmaceutical requirements in healthcare sectors and growing awareness of alcohol benefits for operational enhancement and system reliability improvement. The sector developed as pharmaceutical manufacturers and healthcare providers, especially in major technology corridors, recognized the need for proven bio-based solutions and reliable ingredient management to achieve operational targets while meeting pharmaceutical excellence expectations and healthcare compliance requirements. Suppliers and pharmaceutical companies began emphasizing proper system optimization and technology integration to maintain operational efficiency and commercial viability.

UK Rice Bran Fatty Alcohols Key Takeaways

Metric Value
UK Rice Bran Fatty Alcohols Sales Value (2025) USD 18.7 million
UK Rice Bran Fatty Alcohols Forecast Value (2035) USD 31.2 million
UK Rice Bran Fatty Alcohols Forecast CAGR (2025-2035) 5.3%

Why is the UK Rice Bran Fatty Alcohols Demand Growing?

Demand expansion is being supported by the accelerating emphasis on pharmaceutical excellence and healthcare system optimization nationwide, with the UK maintaining its position as a pharmaceutical technology and healthcare innovation leadership region, and the corresponding need for effective bio-based alcohol systems for pharmaceutical formulations, healthcare processing, and pharmaceutical reliability integration. Modern pharmaceutical companies rely on alcohol technologies to ensure operational competitiveness, regulatory compliance, and optimal performance achievement toward healthcare-focused pharmaceutical operations. Advanced formulation requirements necessitate comprehensive bio-derived solutions including specialized alcohol processing, purity capabilities, and chemical resistance infrastructure to address diverse application needs and pharmaceutical specifications.

The growing emphasis on healthcare system expansion and increasing pharmaceutical regulations, particularly formulation quality commitments across the UK, are driving demand for alcohol systems from proven technology suppliers with appropriate system expertise and integration management capabilities. Pharmaceutical companies and healthcare enterprises are increasingly investing in alcohol sourcing and integrated bio-based solutions to enhance operational profiles, access formulation optimization trends, and demonstrate technology leadership in competitive pharmaceutical environments. Healthcare policies and pharmaceutical compliance requirements are establishing standardized formulation pathways that require alcohol systems and performance assurance, with UK pharmaceutical operations often pioneering large-scale implementation of advanced bio-derived alcohol technologies.

How is The UK Rice Bran Fatty Alcohols Market Segmented by Alcohol Content, Application, And Region?

Demand is segmented by alcohol content, application, and region. By alcohol content, sales are divided into <70%, 70-90%, >90%, and others. In terms of application, sales are segmented into pharmaceutical, cosmetics, beverage, and others. Regionally, demand is divided into England, Scotland, Wales, and Northern Ireland, with England representing a key growth and innovation hub for rice bran fatty alcohol technologies.
By Alcohol Content, 70-90% Segment Accounts for 48.2% Share

Demand For Rice Bran Fatty Alcohols In Uk Analysis By Alcohol Content

The 70-90% segment is projected to account for 48.2% of UK rice bran fatty alcohol demand in 2025, making it the leading alcohol content category across the sector. This dominance reflects the operational reliability and pharmaceutical compatibility of 70-90% alcohol systems for existing healthcare facilities and pharmaceutical applications where purity control is optimized through proven alcohol processes. In the UK, where substantial pharmaceutical infrastructure requires alcohol integration without complete system replacement, 70-90% alcohol systems provide practical pathways for formulation enhancement while maintaining operational continuity.

Continuous innovations are improving purity effectiveness, bio-compatibility characteristics, and pharmaceutical integration parameters, enabling manufacturers to achieve high performance standards while maintaining operational flexibility. The segment's strong position is reinforced by the extensive existing pharmaceutical infrastructure requiring alcohol adoption and growing availability of 70-90% alcohol suppliers with proven commercial experience.
  • Purity compatibility and existing equipment integration make 70-90% alcohol systems the preferred technology for enhancing operating pharmaceutical facilities and formulation installations.
  • Operational reliability and commercial demonstration track records are enhancing manufacturer confidence and project viability across large-scale deployment initiatives.

By Application, Pharmaceutical Segment Accounts for 54.6% Share

Demand For Rice Bran Fatty Alcohols In Uk Analysis By Application

Pharmaceutical applications are expected to represent 54.6% of UK rice bran fatty alcohol demand in 2025, highlighting the critical importance of pharmaceutical formulations requiring specialized bio-based solutions. Pharmaceutical facilities including drug manufacturing, healthcare formulations, medical compounds, and therapeutic systems generate consistent demand for alcohol systems that are technically and economically favorable for pharmaceutical applications. The segment benefits from purity characteristics that often provide superior performance compared to conventional alcohol alternatives, reducing formulation risks and costs.

Pharmaceutical systems also access enhanced operational performance through alcohol processing that improve system reliability and product appeal. In the UK, where pharmaceutical advancement represents substantial portions of healthcare technology development, alcohol deployment requires integration across diverse pharmaceutical operations. In England and Scotland regions, where pharmaceutical concentrations are significant, alcohol demand is elevated by emphasis on maintaining operational excellence while achieving formulation optimization integration targets.

  • Pharmaceutical concentration and favorable application economics make this the largest application segment for alcohol technologies.
  • Healthcare preferences and operational requirements drive consistent demand across drug manufacturing, healthcare formulations, medical compounds, and therapeutic applications.

What are the Drivers, Restraints, and Key Trends in the UK Rice Bran Fatty Alcohols Demand?

UK rice bran fatty alcohol demand is advancing steadily due to increasing pharmaceutical requirements and growing recognition of alcohol necessity for healthcare development, with England region serving as a key driver of innovation and application development. The sector faces challenges including competition from alternative bio-based technologies, need for specialized pharmaceutical infrastructure development, and ongoing concerns regarding system integration complexity and cost considerations. Healthcare guidelines and pharmaceutical initiatives, particularly formulation programs in England and Scotland regions, continue to influence alcohol selection and deployment timelines.

Expansion of Pharmaceutical Requirements and Performance Standards

The enhancement of pharmaceutical regulations, gaining particular significance through healthcare excellence guidelines and quality campaigns, is enabling alcohol suppliers to achieve differentiation without prohibitive development costs, providing predictable demand patterns through pharmaceutical requirements and formulation preferences. Enhanced formulation standards offering substantial opportunities for bio-based systems and alcohol applications provide foundational dynamics while allowing suppliers to secure pharmaceutical agreements and application partnerships. These trends are particularly valuable for first-mover suppliers and premium alcohol development that require substantial technology investments without immediate cost advantages.

Integration of Advanced Bio-Based Technologies and Performance Monitoring Systems

Modern alcohol suppliers and pharmaceutical companies are establishing advanced formulation networks and centralized bio-based management facilities that improve operational efficiency through system standardization and economies of scale. Integration of automated processing systems, real-time performance monitoring, and coordinated bio-based management enables more efficient alcohol operation across multiple pharmaceutical sources. Advanced formulation concepts also support next-generation pharmaceutical applications including specialized bio-based integration, technology cluster optimization, and regional alcohol supply networks that optimize system-level economics while enabling comprehensive purity control across pharmaceutical regions, with UK developments increasingly adopting collaborative formulation models to reduce individual manufacturer costs and accelerate deployment.
How Does UK Rice Bran Fatty Alcohols Demand Vary Across Key Regions?

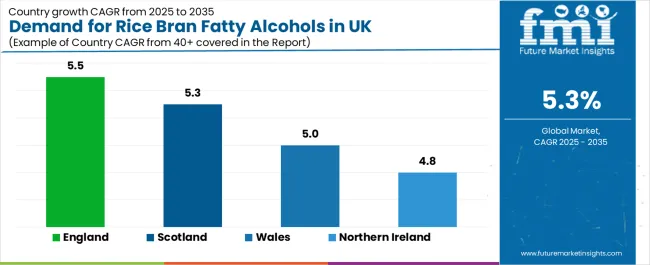
Demand For Rice Bran Fatty Alcohols In Uk Cagr Analysis By Country

Region CAGR (2025-2035)
England 5.5%
Scotland 5.3%
Wales 5.0%
Northern Ireland 4.8%

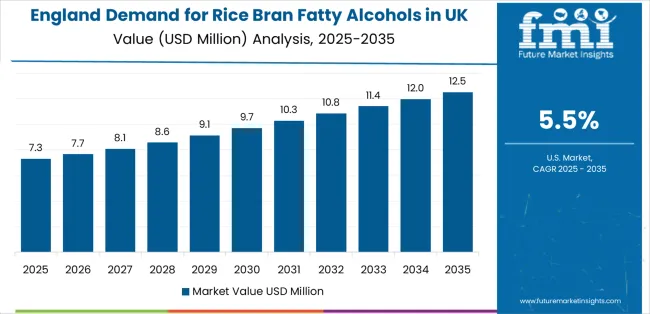
The UK rice bran fatty alcohol demand is witnessing consistent growth, supported by rising pharmaceutical excellence, expanding bio-based requirements, and the deployment of advanced alcohol technologies across regions. England leads the nation with a 5.5% CAGR, reflecting progressive pharmaceutical trends, substantial formulation technology innovation, and early adoption of premium alcohol systems. Scotland follows with a 5.3% CAGR, driven by extensive pharmaceutical infrastructure, favorable technology demographics, and concentration of healthcare operations that enhance application development. Wales grows at 5.0%, as pharmaceutical modernization and technology efficiency opportunities increasingly drive alcohol deployment. Northern Ireland demonstrates growth at 4.8%, supported by expanding pharmaceutical facilities and regional formulation initiatives.
Why Does England Lead The UK Rice Bran Fatty Alcohols Market with a 5.5% CAGR?

Demand For Rice Bran Fatty Alcohols In Uk Country Value Analysis

Demand for rice bran fatty alcohols in England is projected to exhibit exceptional growth with a CAGR of 5.5% through 2035, driven by progressive pharmaceutical preferences, substantial technology development creating premium bio-based opportunities, and concentration of innovation across London and surrounding regions. As the dominant region with extensive pharmaceutical infrastructure and formulation-focused operational policies, England's emphasis on comprehensive pharmaceutical excellence and technology leadership is creating significant demand for advanced alcohol systems with proven performance and reliable application potential. Major pharmaceutical companies and bio-based suppliers are establishing comprehensive formulation development programs to support technology innovation and premium alcohol deployment across diverse applications.

  • Pharmaceutical trends and operational formulation preferences are requiring comprehensive bio-based strategies and alcohol solutions, driving demand for systems with demonstrated integration capabilities and permanent performance assurance throughout diverse pharmaceutical operations.
  • Innovation ecosystem strength and technology capital availability are supporting deployment of next-generation alcohol technologies and novel application pathways that enhance commercial viability, reduce operational costs, and create new pharmaceutical opportunities across formulation and technology applications, positioning England as a national bio-based leadership region.

How Is Scotland Demonstrating Strong Potential Through Pharmaceutical Infrastructure Expansion?

Demand for rice bran fatty alcohols in Scotland is expanding at a CAGR of 5.3%, supported by extensive pharmaceutical facilities including healthcare formulations, pharmaceutical operations, and technology establishments generating concentrated demand favorable for alcohol systems. The region's operational characteristics, featuring substantial pharmaceutical operations and formulation requirements ideal for bio-based integration, provide natural advantages. Pharmaceutical expertise concentrated in Glasgow, Edinburgh, and regional technology corridors facilitates application development and operational management. Alcohol suppliers and manufacturers are implementing comprehensive formulation strategies to serve expanding pharmaceutical-focused requirements throughout Scotland.

  • Pharmaceutical concentration and favorable application economics are creating opportunities for specialized alcohol suppliers that can integrate bio-based systems with existing pharmaceutical operations.
  • Operational formulation positioning and pharmaceutical awareness are building regional competitive advantages in alcohol applications, enabling comprehensive technology development and pharmaceutical cluster enhancement that meets operational targets while accessing formulation pricing opportunities.

Why Does Wales Maintain Strong Growth with Pharmaceutical Modernization Initiatives?

Demand for rice bran fatty alcohols in Wales is growing at a CAGR of 5.0%, driven by substantial pharmaceutical facilities from healthcare operations, formulation engineering, and regional technology requiring bio-based pathways. The region's pharmaceutical base, supporting critical technology operations, is increasingly adopting alcohol technologies to maintain competitiveness while meeting formulation expectations. Manufacturers and bio-based suppliers are investing in system integration systems and regional supply infrastructure to address growing alcohol management requirements.

  • Pharmaceutical modernization imperatives and operational competitiveness concerns are facilitating adoption of alcohol technologies that enable continued operations while achieving formulation enhancement across pharmaceutical, healthcare, and technology facilities.
  • Technology efficiency opportunities including regional pharmaceutical development and alcohol utilization for enhanced commercial operations are creating unique regional advantages and diversified application types throughout Wales pharmaceutical operations.

How Is Northern Ireland Showing Progressive Adoption of Bio-Based Alcohol Technologies?

Demand for rice bran fatty alcohols in Northern Ireland is advancing at a CAGR of 4.8%, supported by expanding pharmaceutical facilities, regional technology development including specialized applications, and growing emphasis on bio-based solutions across the region. Pharmaceutical modernization and technology facility expansion are driving consideration of alcohol systems as operational enhancement pathways. Technology companies and bio-based suppliers are developing regional capabilities to support emerging alcohol deployment requirements.
  • Pharmaceutical expansion and operational diversification are creating economic drivers for bio-based technologies and alcohol deployment across pharmaceutical and healthcare facilities seeking competitive differentiation pathways.
  • Regional technology cooperation and coordinated pharmaceutical development are establishing consistent bio-based environments and shared operational infrastructure that support multi-regional pharmaceutical projects throughout Northern Ireland technology operations.

How Competitive Is The UK Rice Bran Fatty Alcohols Market?

Demand For Rice Bran Fatty Alcohols In Uk Analysis By Company

UK rice bran fatty alcohol demand is defined by competition among specialized pharmaceutical manufacturers, healthcare suppliers, and technology providers, with major chemical corporations maintaining significant influence through supply chain resources and technology development capabilities. Companies are investing in alcohol technology advancement, supply chain optimization, distribution network structures, and comprehensive application services to deliver effective, reliable, and scalable bio-based solutions across UK pharmaceutical and healthcare applications. Strategic partnerships, technology infrastructure development, and first-mover application execution are central to strengthening competitive positioning and presence across pharmaceutical formulations, cosmetic manufacturing, and beverage processing applications.

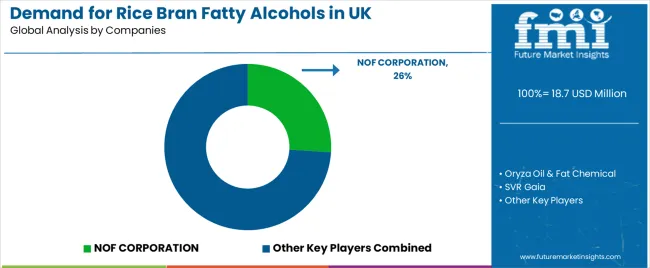
NOF CORPORATION, internationally recognized chemical leader, leads with 26% share, offering comprehensive alcohol supply including manufacturing, technology, and distribution services with focus on pharmaceutical applications, purity reliability, and cost optimization across UK operations. Oryza Oil & Fat Chemical, operating with extensive UK distribution, provides integrated bio-based solutions leveraging system expertise, quality assurance development, and pharmaceutical manufacturing capabilities.

SVR Gaia delivers full-service alcohol processing including bio-based technology, performance testing, and supply management serving UK and international pharmaceutical projects. Eastman Chemical Company emphasizes comprehensive chemical solutions with integrated bio-based systems, quality control, and distribution capabilities leveraging pharmaceutical sector expertise. Croda International offers alcohol application development and quality assurance operations for pharmaceutical and healthcare applications across UK operations.

UK Rice Bran Fatty Alcohols Demand - Stakeholder Contribution Framework

The rice bran fatty alcohol demand in the UK is positioned for consistent expansion, growing from USD 18.7 million in 2025 to USD 31.2 million by 2035, reflecting a 5.3% CAGR. Rising adoption of pharmaceutical systems in healthcare, pharmaceutical, and cosmetic applications is driving growth as companies seek high-performance bio-based technologies that maximize operational efficiency and comply with stringent pharmaceutical standards. Additionally, demand from beverage processing and personal care applications strengthens opportunities for both standard and specialized alcohol solutions.

How governments could accelerate development and quality standards?

  • Enhanced pharmaceutical regulation and standardization: Extend and clarify healthcare regulations defining purity standards, quality controls, and certification requirements to improve transparency and operational certainty for alcohol deployment.
  • Research and development funding: Provide targeted grants for advanced bio-based technologies, energy-efficient processing, and quality development that reduce implementation cost and performance risks.
  • Technology infrastructure investment: Support shared testing and validation facilities, quality laboratories, and regional technology hubs that improve reliability of domestic alcohol availability.
  • Standards and specification clarity: Establish a clear classification system for pharmaceutical alcohols to guide their integration in healthcare and pharmaceutical formulations while ensuring compliance with quality and safety norms.
  • Import quality alignment: Define measurable performance parameters, purity thresholds, and certification requirements for imported alcohols to ensure compatibility with domestic pharmaceutical applications.
  • Support for domestic technology programs: Encourage research and innovation partnerships under UK technology funds to expand local manufacturing capacity for specialty bio-based technologies such as rice bran fatty alcohols.

How industry bodies could strengthen sector development?

  • Technology best-practice guidelines: Publish standardized bio-based protocols, testing procedures, and reference methodologies to maintain consistency across alcohol producers and users.
  • Performance reliability assessment tools: Develop frameworks for evaluating system dependability, quality control, and operational resilience that inform buyer decision-making.
  • Technical training and certification: Create education programs for pharmaceutical engineers, formulation specialists, and technology specialists focused on alcohol handling and implementation.
  • Application performance frameworks: Establish data models measuring alcohol functionality, compatibility, and operational impact in pharmaceutical and healthcare systems.
  • User awareness programs: Facilitate transparent communication among formulation integrators, suppliers, and application developers on alcohol performance, quality, and operational profile.
  • Collaborative technology coordination: Convene producers, distributors, and application developers to improve efficiency, reduce redundancy, and enhance traceability across supply flows.

How alcohol suppliers could capture value and drive innovation?

  • Advanced bio-based technology: Invest in alcohol development, quality enhancement systems, and integration methods that deliver consistent performance and lower implementation cost.
  • Specification standardization: Define harmonized technical sheets for alcohol variants to reduce qualification time and simplify technical validation by end users.
  • Integration support and technical advisory: Offer assistance to pharmaceutical and healthcare companies in optimizing alcohol system use and managing operational stability.
  • Integrated supply coordination: Build end-to-end systems linking component sourcing, manufacturing, and logistics that ensure continuous supply and cost efficiency.
  • Application diversification: Expand alcohol use into cosmetic formulations, beverage systems, and pharmaceutical applications to establish new high-value channels.
  • Full-service partnerships: Provide bundled offerings combining technology delivery, testing, certification, and technical consultation for streamlined adoption.

How downstream users could optimize operational strategies?

  • Technology evaluation and feasibility testing: Conduct controlled validation of alcohol suitability within existing pharmaceutical systems and operational structures.
  • Integration planning: Introduce phased adoption beginning with pilot installations followed by controlled scaling to manage operational risks.
  • Supplier partnerships: Form multi-year sourcing agreements ensuring continuity and predictability of quality and delivery.
  • Operational roadmap development: Implement staged execution plans linking research, validation, and commercial deployment for alcohol-based systems.
  • Value positioning: Highlight the use of advanced bio-based technologies and UK-based sourcing within operational communications to reinforce reliability and technology credentials.
  • Internal communication and training: Build organizational understanding of alcohol handling, performance optimization, and compliance requirements across operational teams.

How researchers and academic institutions could enable innovation?

  • Bio-based innovation exploration: Pursue research on advanced alcohol methods improving performance and reducing quality vulnerabilities.
  • Quality innovation: Develop new protection methods for contamination detection, system enhancement, and operational resilience of alcohols.
  • Pilot demonstration: Collaborate with pharmaceutical partners to validate emerging technologies through pilot-scale implementation studies.
  • Knowledge dissemination: Publish open technical data supporting alcohol improvement, enabling evidence-based industry adoption.
  • Training integration: Introduce specialized curricula for pharmaceutical technologies and bio-based system design to strengthen workforce capacity.
  • Public-private partnerships: Combine academic research and pharmaceutical execution to fast-track proof-of-concept development and scale-up solutions.

How investors and financial enablers could unlock growth?

  • Technology financing: Provide capital for building or upgrading domestic alcohol development and manufacturing facilities.
  • Infrastructure co-funding: Finance shared laboratories, testing facilities, and logistics networks serving multiple technology producers.
  • Growth equity for innovators: Invest in start-ups focusing on advanced bio-based systems, automated manufacturing, or specialized alcohol technologies.
  • Portfolio support for application developers: Acquire stakes in firms developing pharmaceutical or healthcare systems reliant on alcohols, capturing returns through technology participation.
  • Strategic consolidation funding: Support mergers of specialized alcohol producers and service firms to form integrated national-scale technology platforms.
  • Outcome-linked financing: Align capital deployment with measurable performance indicators such as quality improvement, system reliability, and verified operational performance.

Key Players in UK Rice Bran Fatty Alcohols Demand

  • NOF CORPORATION
  • Oryza Oil & Fat Chemical
  • SVR Gaia
  • Eastman Chemical Company
  • Croda International
  • Shanghai Lithy One Health Group Technology
  • Wuyi Zhenwei Biological Science and Technology
  • Xian Tianbao Bio-Tech
  • Huzhou Shengtao Biotech
  • Shaanxi Yuan Bang BIO-TECH

Scope of the Report

Item Value
Quantitative Units USD 31.2 million
Alcohol Content <70%, 70-90%, >90%, Others
Application Pharmaceutical, Cosmetics, Beverage, Others
Regions Covered England, Scotland, Wales, Northern Ireland
Key Companies NOF CORPORATION; Oryza Oil & Fat Chemical; SVR Gaia; Eastman Chemical Company; Croda International; Shanghai Lithy One Health Group Technology; Wuyi Zhenwei Biological Science and Technology; Xian Tianbao Bio-Tech; Huzhou Shengtao Biotech; Shaanxi Yuan Bang BIO-TECH
Additional Attributes Sales by alcohol content and application segment; regional demand trends across England, Scotland, Wales, and Northern Ireland; competitive landscape with established chemical suppliers and specialized bio-based manufacturers; pharmaceutical operator preferences for 70-90% alcohol systems versus other content categories; integration with pharmaceutical programs and healthcare policies (notably advanced in England region)

UK Rice Bran Fatty Alcohols Demand by Segments

Alcohol Content:

  • <70%
  • 70-90%
  • 90%
  • Others

Application:

  • Pharmaceutical
  • Cosmetics
  • Beverage
  • Others

Region:

  • England
  • Scotland
  • Wales
  • Northern Ireland

Frequently Asked Questions

How big is the demand for rice bran fatty alcohols in UK in 2025?

The global demand for rice bran fatty alcohols in UK is estimated to be valued at USD 18.7 million in 2025.

What will be the size of demand for rice bran fatty alcohols in UK in 2035?

The market size for the demand for rice bran fatty alcohols in UK is projected to reach USD 31.3 million by 2035.

How much will be the demand for rice bran fatty alcohols in UK growth between 2025 and 2035?

The demand for rice bran fatty alcohols in UK is expected to grow at a 5.3% CAGR between 2025 and 2035.

What are the key product types in the demand for rice bran fatty alcohols in uk?

The key product types in demand for rice bran fatty alcohols in UK are 70-90%, <70%, 0.9 and others.

Which application segment to contribute significant share in the demand for rice bran fatty alcohols in UK in 2025?

In terms of application, pharmaceutical segment to command 54.6% share in the demand for rice bran fatty alcohols in UK in 2025.

Table of Content

  1. Executive Summary
    • Global Market Outlook
    • Demand to side Trends
    • Supply to side Trends
    • Technology Roadmap Analysis
    • Analysis and Recommendations
  2. Market Overview
    • Market Coverage / Taxonomy
    • Market Definition / Scope / Limitations
  3. Market Background
    • Market Dynamics
      • Drivers
      • Restraints
      • Opportunity
      • Trends
    • Scenario Forecast
      • Demand in Optimistic Scenario
      • Demand in Likely Scenario
      • Demand in Conservative Scenario
    • Opportunity Map Analysis
    • Product Life Cycle Analysis
    • Supply Chain Analysis
    • Investment Feasibility Matrix
    • Value Chain Analysis
    • PESTLE and Porter’s Analysis
    • Regulatory Landscape
    • Regional Parent Market Outlook
    • Production and Consumption Statistics
    • Import and Export Statistics
  4. Global Market Analysis 2020 to 2024 and Forecast, 2025 to 2035
    • Historical Market Size Value (USD Million) Analysis, 2020 to 2024
    • Current and Future Market Size Value (USD Million) Projections, 2025 to 2035
      • Y to o to Y Growth Trend Analysis
      • Absolute $ Opportunity Analysis
  5. Global Market Pricing Analysis 2020 to 2024 and Forecast 2025 to 2035
  6. Global Market Analysis 2020 to 2024 and Forecast 2025 to 2035, By Alcohol Content
    • Introduction / Key Findings
    • Historical Market Size Value (USD Million) Analysis By Alcohol Content , 2020 to 2024
    • Current and Future Market Size Value (USD Million) Analysis and Forecast By Alcohol Content , 2025 to 2035
      • 70-90%
      • <70%
      • 0.9
      • Others
    • Y to o to Y Growth Trend Analysis By Alcohol Content , 2020 to 2024
    • Absolute $ Opportunity Analysis By Alcohol Content , 2025 to 2035
  7. Global Market Analysis 2020 to 2024 and Forecast 2025 to 2035, By Application
    • Introduction / Key Findings
    • Historical Market Size Value (USD Million) Analysis By Application, 2020 to 2024
    • Current and Future Market Size Value (USD Million) Analysis and Forecast By Application, 2025 to 2035
      • Pharmaceutical
      • Cosmetics
      • Beverage
      • Others
    • Y to o to Y Growth Trend Analysis By Application, 2020 to 2024
    • Absolute $ Opportunity Analysis By Application, 2025 to 2035
  8. Global Market Analysis 2020 to 2024 and Forecast 2025 to 2035, By Region
    • Introduction
    • Historical Market Size Value (USD Million) Analysis By Region, 2020 to 2024
    • Current Market Size Value (USD Million) Analysis and Forecast By Region, 2025 to 2035
      • North America
      • Latin America
      • Western Europe
      • Eastern Europe
      • East Asia
      • South Asia and Pacific
      • Middle East & Africa
    • Market Attractiveness Analysis By Region
  9. North America Market Analysis 2020 to 2024 and Forecast 2025 to 2035, By Country
    • Historical Market Size Value (USD Million) Trend Analysis By Market Taxonomy, 2020 to 2024
    • Market Size Value (USD Million) Forecast By Market Taxonomy, 2025 to 2035
      • By Country
        • USA
        • Canada
        • Mexico
      • By Alcohol Content
      • By Application
    • Market Attractiveness Analysis
      • By Country
      • By Alcohol Content
      • By Application
    • Key Takeaways
  10. Latin America Market Analysis 2020 to 2024 and Forecast 2025 to 2035, By Country
    • Historical Market Size Value (USD Million) Trend Analysis By Market Taxonomy, 2020 to 2024
    • Market Size Value (USD Million) Forecast By Market Taxonomy, 2025 to 2035
      • By Country
        • Brazil
        • Chile
        • Rest of Latin America
      • By Alcohol Content
      • By Application
    • Market Attractiveness Analysis
      • By Country
      • By Alcohol Content
      • By Application
    • Key Takeaways
  11. Western Europe Market Analysis 2020 to 2024 and Forecast 2025 to 2035, By Country
    • Historical Market Size Value (USD Million) Trend Analysis By Market Taxonomy, 2020 to 2024
    • Market Size Value (USD Million) Forecast By Market Taxonomy, 2025 to 2035
      • By Country
        • Germany
        • UK
        • Italy
        • Spain
        • France
        • Nordic
        • BENELUX
        • Rest of Western Europe
      • By Alcohol Content
      • By Application
    • Market Attractiveness Analysis
      • By Country
      • By Alcohol Content
      • By Application
    • Key Takeaways
  12. Eastern Europe Market Analysis 2020 to 2024 and Forecast 2025 to 2035, By Country
    • Historical Market Size Value (USD Million) Trend Analysis By Market Taxonomy, 2020 to 2024
    • Market Size Value (USD Million) Forecast By Market Taxonomy, 2025 to 2035
      • By Country
        • Russia
        • Poland
        • Hungary
        • Balkan & Baltic
        • Rest of Eastern Europe
      • By Alcohol Content
      • By Application
    • Market Attractiveness Analysis
      • By Country
      • By Alcohol Content
      • By Application
    • Key Takeaways
  13. East Asia Market Analysis 2020 to 2024 and Forecast 2025 to 2035, By Country
    • Historical Market Size Value (USD Million) Trend Analysis By Market Taxonomy, 2020 to 2024
    • Market Size Value (USD Million) Forecast By Market Taxonomy, 2025 to 2035
      • By Country
        • China
        • Japan
        • South Korea
      • By Alcohol Content
      • By Application
    • Market Attractiveness Analysis
      • By Country
      • By Alcohol Content
      • By Application
    • Key Takeaways
  14. South Asia and Pacific Market Analysis 2020 to 2024 and Forecast 2025 to 2035, By Country
    • Historical Market Size Value (USD Million) Trend Analysis By Market Taxonomy, 2020 to 2024
    • Market Size Value (USD Million) Forecast By Market Taxonomy, 2025 to 2035
      • By Country
        • India
        • ASEAN
        • Australia & New Zealand
        • Rest of South Asia and Pacific
      • By Alcohol Content
      • By Application
    • Market Attractiveness Analysis
      • By Country
      • By Alcohol Content
      • By Application
    • Key Takeaways
  15. Middle East & Africa Market Analysis 2020 to 2024 and Forecast 2025 to 2035, By Country
    • Historical Market Size Value (USD Million) Trend Analysis By Market Taxonomy, 2020 to 2024
    • Market Size Value (USD Million) Forecast By Market Taxonomy, 2025 to 2035
      • By Country
        • Kingdom of Saudi Arabia
        • Other GCC Countries
        • Turkiye
        • South Africa
        • Other African Union
        • Rest of Middle East & Africa
      • By Alcohol Content
      • By Application
    • Market Attractiveness Analysis
      • By Country
      • By Alcohol Content
      • By Application
    • Key Takeaways
  16. Key Countries Market Analysis
    • USA
      • Pricing Analysis
      • Market Share Analysis, 2024
        • By Alcohol Content
        • By Application
    • Canada
      • Pricing Analysis
      • Market Share Analysis, 2024
        • By Alcohol Content
        • By Application
    • Mexico
      • Pricing Analysis
      • Market Share Analysis, 2024
        • By Alcohol Content
        • By Application
    • Brazil
      • Pricing Analysis
      • Market Share Analysis, 2024
        • By Alcohol Content
        • By Application
    • Chile
      • Pricing Analysis
      • Market Share Analysis, 2024
        • By Alcohol Content
        • By Application
    • Germany
      • Pricing Analysis
      • Market Share Analysis, 2024
        • By Alcohol Content
        • By Application
    • UK
      • Pricing Analysis
      • Market Share Analysis, 2024
        • By Alcohol Content
        • By Application
    • Italy
      • Pricing Analysis
      • Market Share Analysis, 2024
        • By Alcohol Content
        • By Application
    • Spain
      • Pricing Analysis
      • Market Share Analysis, 2024
        • By Alcohol Content
        • By Application
    • France
      • Pricing Analysis
      • Market Share Analysis, 2024
        • By Alcohol Content
        • By Application
    • India
      • Pricing Analysis
      • Market Share Analysis, 2024
        • By Alcohol Content
        • By Application
    • ASEAN
      • Pricing Analysis
      • Market Share Analysis, 2024
        • By Alcohol Content
        • By Application
    • Australia & New Zealand
      • Pricing Analysis
      • Market Share Analysis, 2024
        • By Alcohol Content
        • By Application
    • China
      • Pricing Analysis
      • Market Share Analysis, 2024
        • By Alcohol Content
        • By Application
    • Japan
      • Pricing Analysis
      • Market Share Analysis, 2024
        • By Alcohol Content
        • By Application
    • South Korea
      • Pricing Analysis
      • Market Share Analysis, 2024
        • By Alcohol Content
        • By Application
    • Russia
      • Pricing Analysis
      • Market Share Analysis, 2024
        • By Alcohol Content
        • By Application
    • Poland
      • Pricing Analysis
      • Market Share Analysis, 2024
        • By Alcohol Content
        • By Application
    • Hungary
      • Pricing Analysis
      • Market Share Analysis, 2024
        • By Alcohol Content
        • By Application
    • Kingdom of Saudi Arabia
      • Pricing Analysis
      • Market Share Analysis, 2024
        • By Alcohol Content
        • By Application
    • Turkiye
      • Pricing Analysis
      • Market Share Analysis, 2024
        • By Alcohol Content
        • By Application
    • South Africa
      • Pricing Analysis
      • Market Share Analysis, 2024
        • By Alcohol Content
        • By Application
  17. Market Structure Analysis
    • Competition Dashboard
    • Competition Benchmarking
    • Market Share Analysis of Top Players
      • By Regional
      • By Alcohol Content
      • By Application
  18. Competition Analysis
    • Competition Deep Dive
      • NOF CORPORATION
        • Overview
        • Product Portfolio
        • Profitability by Market Segments (Product/Age /Sales Channel/Region)
        • Sales Footprint
        • Strategy Overview
          • Marketing Strategy
          • Product Strategy
          • Channel Strategy
      • Oryza Oil & Fat Chemical
      • SVR Gaia
      • Eastman Chemical Company
      • Croda International
      • Shanghai Lithy One Health Group Technology
      • Wuyi Zhenwei Biological Science and Technology
      • Xian Tianbao Bio-Tech
      • Huzhou Shengtao Biotech
      • Shaanxi Yuan Bang BIO-TECH
  19. Assumptions & Acronyms Used
  20. Research Methodology

List of Tables

  • Table 1: Global Market Value (USD Million) Forecast by Region, 2020 to 2035
  • Table 2: Global Market Value (USD Million) Forecast by Alcohol Content , 2020 to 2035
  • Table 3: Global Market Value (USD Million) Forecast by Application, 2020 to 2035
  • Table 4: North America Market Value (USD Million) Forecast by Country, 2020 to 2035
  • Table 5: North America Market Value (USD Million) Forecast by Alcohol Content , 2020 to 2035
  • Table 6: North America Market Value (USD Million) Forecast by Application, 2020 to 2035
  • Table 7: Latin America Market Value (USD Million) Forecast by Country, 2020 to 2035
  • Table 8: Latin America Market Value (USD Million) Forecast by Alcohol Content , 2020 to 2035
  • Table 9: Latin America Market Value (USD Million) Forecast by Application, 2020 to 2035
  • Table 10: Western Europe Market Value (USD Million) Forecast by Country, 2020 to 2035
  • Table 11: Western Europe Market Value (USD Million) Forecast by Alcohol Content , 2020 to 2035
  • Table 12: Western Europe Market Value (USD Million) Forecast by Application, 2020 to 2035
  • Table 13: Eastern Europe Market Value (USD Million) Forecast by Country, 2020 to 2035
  • Table 14: Eastern Europe Market Value (USD Million) Forecast by Alcohol Content , 2020 to 2035
  • Table 15: Eastern Europe Market Value (USD Million) Forecast by Application, 2020 to 2035
  • Table 16: East Asia Market Value (USD Million) Forecast by Country, 2020 to 2035
  • Table 17: East Asia Market Value (USD Million) Forecast by Alcohol Content , 2020 to 2035
  • Table 18: East Asia Market Value (USD Million) Forecast by Application, 2020 to 2035
  • Table 19: South Asia and Pacific Market Value (USD Million) Forecast by Country, 2020 to 2035
  • Table 20: South Asia and Pacific Market Value (USD Million) Forecast by Alcohol Content , 2020 to 2035
  • Table 21: South Asia and Pacific Market Value (USD Million) Forecast by Application, 2020 to 2035
  • Table 22: Middle East & Africa Market Value (USD Million) Forecast by Country, 2020 to 2035
  • Table 23: Middle East & Africa Market Value (USD Million) Forecast by Alcohol Content , 2020 to 2035
  • Table 24: Middle East & Africa Market Value (USD Million) Forecast by Application, 2020 to 2035

List of Figures

  • Figure 1: Global Market Pricing Analysis
  • Figure 2: Global Market Value (USD Million) Forecast 2020-2035
  • Figure 3: Global Market Value Share and BPS Analysis by Alcohol Content , 2025 and 2035
  • Figure 4: Global Market Y-o-Y Growth Comparison by Alcohol Content , 2025-2035
  • Figure 5: Global Market Attractiveness Analysis by Alcohol Content
  • Figure 6: Global Market Value Share and BPS Analysis by Application, 2025 and 2035
  • Figure 7: Global Market Y-o-Y Growth Comparison by Application, 2025-2035
  • Figure 8: Global Market Attractiveness Analysis by Application
  • Figure 9: Global Market Value (USD Million) Share and BPS Analysis by Region, 2025 and 2035
  • Figure 10: Global Market Y-o-Y Growth Comparison by Region, 2025-2035
  • Figure 11: Global Market Attractiveness Analysis by Region
  • Figure 12: North America Market Incremental Dollar Opportunity, 2025-2035
  • Figure 13: Latin America Market Incremental Dollar Opportunity, 2025-2035
  • Figure 14: Western Europe Market Incremental Dollar Opportunity, 2025-2035
  • Figure 15: Eastern Europe Market Incremental Dollar Opportunity, 2025-2035
  • Figure 16: East Asia Market Incremental Dollar Opportunity, 2025-2035
  • Figure 17: South Asia and Pacific Market Incremental Dollar Opportunity, 2025-2035
  • Figure 18: Middle East & Africa Market Incremental Dollar Opportunity, 2025-2035
  • Figure 19: North America Market Value Share and BPS Analysis by Country, 2025 and 2035
  • Figure 20: North America Market Value Share and BPS Analysis by Alcohol Content , 2025 and 2035
  • Figure 21: North America Market Y-o-Y Growth Comparison by Alcohol Content , 2025-2035
  • Figure 22: North America Market Attractiveness Analysis by Alcohol Content
  • Figure 23: North America Market Value Share and BPS Analysis by Application, 2025 and 2035
  • Figure 24: North America Market Y-o-Y Growth Comparison by Application, 2025-2035
  • Figure 25: North America Market Attractiveness Analysis by Application
  • Figure 26: Latin America Market Value Share and BPS Analysis by Country, 2025 and 2035
  • Figure 27: Latin America Market Value Share and BPS Analysis by Alcohol Content , 2025 and 2035
  • Figure 28: Latin America Market Y-o-Y Growth Comparison by Alcohol Content , 2025-2035
  • Figure 29: Latin America Market Attractiveness Analysis by Alcohol Content
  • Figure 30: Latin America Market Value Share and BPS Analysis by Application, 2025 and 2035
  • Figure 31: Latin America Market Y-o-Y Growth Comparison by Application, 2025-2035
  • Figure 32: Latin America Market Attractiveness Analysis by Application
  • Figure 33: Western Europe Market Value Share and BPS Analysis by Country, 2025 and 2035
  • Figure 34: Western Europe Market Value Share and BPS Analysis by Alcohol Content , 2025 and 2035
  • Figure 35: Western Europe Market Y-o-Y Growth Comparison by Alcohol Content , 2025-2035
  • Figure 36: Western Europe Market Attractiveness Analysis by Alcohol Content
  • Figure 37: Western Europe Market Value Share and BPS Analysis by Application, 2025 and 2035
  • Figure 38: Western Europe Market Y-o-Y Growth Comparison by Application, 2025-2035
  • Figure 39: Western Europe Market Attractiveness Analysis by Application
  • Figure 40: Eastern Europe Market Value Share and BPS Analysis by Country, 2025 and 2035
  • Figure 41: Eastern Europe Market Value Share and BPS Analysis by Alcohol Content , 2025 and 2035
  • Figure 42: Eastern Europe Market Y-o-Y Growth Comparison by Alcohol Content , 2025-2035
  • Figure 43: Eastern Europe Market Attractiveness Analysis by Alcohol Content
  • Figure 44: Eastern Europe Market Value Share and BPS Analysis by Application, 2025 and 2035
  • Figure 45: Eastern Europe Market Y-o-Y Growth Comparison by Application, 2025-2035
  • Figure 46: Eastern Europe Market Attractiveness Analysis by Application
  • Figure 47: East Asia Market Value Share and BPS Analysis by Country, 2025 and 2035
  • Figure 48: East Asia Market Value Share and BPS Analysis by Alcohol Content , 2025 and 2035
  • Figure 49: East Asia Market Y-o-Y Growth Comparison by Alcohol Content , 2025-2035
  • Figure 50: East Asia Market Attractiveness Analysis by Alcohol Content
  • Figure 51: East Asia Market Value Share and BPS Analysis by Application, 2025 and 2035
  • Figure 52: East Asia Market Y-o-Y Growth Comparison by Application, 2025-2035
  • Figure 53: East Asia Market Attractiveness Analysis by Application
  • Figure 54: South Asia and Pacific Market Value Share and BPS Analysis by Country, 2025 and 2035
  • Figure 55: South Asia and Pacific Market Value Share and BPS Analysis by Alcohol Content , 2025 and 2035
  • Figure 56: South Asia and Pacific Market Y-o-Y Growth Comparison by Alcohol Content , 2025-2035
  • Figure 57: South Asia and Pacific Market Attractiveness Analysis by Alcohol Content
  • Figure 58: South Asia and Pacific Market Value Share and BPS Analysis by Application, 2025 and 2035
  • Figure 59: South Asia and Pacific Market Y-o-Y Growth Comparison by Application, 2025-2035
  • Figure 60: South Asia and Pacific Market Attractiveness Analysis by Application
  • Figure 61: Middle East & Africa Market Value Share and BPS Analysis by Country, 2025 and 2035
  • Figure 62: Middle East & Africa Market Value Share and BPS Analysis by Alcohol Content , 2025 and 2035
  • Figure 63: Middle East & Africa Market Y-o-Y Growth Comparison by Alcohol Content , 2025-2035
  • Figure 64: Middle East & Africa Market Attractiveness Analysis by Alcohol Content
  • Figure 65: Middle East & Africa Market Value Share and BPS Analysis by Application, 2025 and 2035
  • Figure 66: Middle East & Africa Market Y-o-Y Growth Comparison by Application, 2025-2035
  • Figure 67: Middle East & Africa Market Attractiveness Analysis by Application
  • Figure 68: Global Market - Tier Structure Analysis
  • Figure 69: Global Market - Company Share Analysis
Dashboard
Dashboard
Dashboard
Dashboard
Dashboard
Dashboard

Our Research Products

Full Research Suite

The "Full Research Suite" delivers actionable market intel, deep dives on markets or technologies, so clients act faster, cut risk, and unlock growth.

Competitor Leaderboard Report

The Leaderboard benchmarks and ranks top vendors, classifying them as Established Leaders, Leading Challengers, or Disruptors & Challengers.

Future Leaders Index

Locates where complements amplify value and substitutes erode it, forecasting net impact by horizon

Market Data & Forecasts

We deliver granular, decision-grade intel: market sizing, 5-year forecasts, pricing, adoption, usage, revenue, and operational KPIs—plus competitor tracking, regulation, and value chains—across 60 countries broadly.

Market Focus Report

Spot the shifts before they hit your P&L. We track inflection points, adoption curves, pricing moves, and ecosystem plays to show where demand is heading, why it is changing, and what to do next across high-growth markets and disruptive tech

Survey Report

Real-time reads of user behavior. We track shifting priorities, perceptions of today’s and next-gen services, and provider experience, then pace how fast tech moves from trial to adoption, blending buyer, consumer, and channel inputs with social signals (#WhySwitch, #UX).

Bespoke Reports

Partner with our analyst team to build a custom report designed around your business priorities. From analysing market trends to assessing competitors or crafting bespoke datasets, we tailor insights to your needs.

Supplier Intelligence

Discovery & Profiling

Capacity & Footprint

Performance & Risk

Compliance & Governance

Commercial Readiness

Who Supplies Whom

Scorecards & Shortlists

Playbooks & Docs

Category Intelligence

Definition & Scope

Demand & Use Cases

Cost Drivers

Market Structure

Supply Chain Map

Trade & Policy

Operating Norms

Deliverables

Buyer Intelligence

Account Basics

Spend & Scope

Procurement Model

Vendor Requirements

Terms & Policies

Entry Strategy

Pain Points & Triggers

Outputs

Pricing Analysis

Benchmarks

Trends

Should-Cost

Indexation

Landed Cost

Commercial Terms

Deliverables

Brand Analysis

Positioning & Value Prop

Share & Presence

Customer Evidence

Go-to-Market

Digital & Reputation

Compliance & Trust

KPIs & Gaps

Outputs

Full Research Suite comprises of:

Market outlook & trends analysis

Market outlook & trends analysis

Interviews & case studies

Interviews & case studies

Strategic recommendations

Strategic recommendations

Vendor profiles & capabilities analysis

Vendor profiles & capabilities analysis

5-year forecasts

5-year forecasts

8 regions and 60+ country-level data splits

8 regions and 60+ country-level data splits

Market segment data splits

Market segment data splits

12 months of continuous data updates

12 months of continuous data updates

DELIVERED AS:

PDF EXCEL ONLINE

Full Research Suite


$3500

$5000

$6500

Buy Report Now
Similar Industry Reports

Similar Industry Reports

Demand Signal Repository Solutions Market

Demand Signal Repository Solutions Market Size and Share Forecast Outlook 2025 to 2035

Demand Side Management Market

Demand Side Management Market Size and Share Forecast Outlook 2025 to 2035

Demand Response Market

Demand Response Market Analysis - Size, Share, and Forecast Outlook 2025 to 2035

Demand Analysis of Shipping Supplies in North America

North America Shipping Supplies Market Trends – Innovations & Growth 2024-2034

Demand of Kozani Saffron in Greece

Demand of Kozani Saffron in Greece Analysis - Size, Share & Forecast 2025 to 2035

Demand of No-acid Whey Strained Dairy Processing Concepts

Demand of No-acid Whey Strained Dairy Processing Concepts in European Union Size and Share Forecast Outlook 2025 to 2035

Demand of Bronte Pistachio in Italy

Demand for Bronte Pistachio in Italy Analysis - Size, Share & Forecast 2025 to 2035

Demand and Trend Analysis of Gaming Monitor in Western Europe

Demand and Trend Analysis of Gaming Monitor in Western Europe Size and Share Forecast Outlook 2025 to 2035

Demand and Trend Analysis of Gaming Monitor in Japan

Demand and Trend Analysis of Gaming Monitor in Japan Size and Share Forecast Outlook 2025 to 2035

Demand and Trend Analysis of Gaming Monitor in Korea

Demand and Trend Analysis of Gaming Monitor in Korea Size and Share Forecast Outlook 2025 to 2035

Demand and Trend Analysis of Glycine Soja (Soybean) Seed Extract Market

Glycine Soja (Soybean) Seed Extract Market Size and Share Forecast Outlook 2025 to 2035

Demand and Trend Analysis of Yeast in Japan

Demand and Trend Analysis of Yeast in Japan - Size, Share, and Forecast Outlook 2025 to 2035

Demand and Trends Analysis of Stevia in Japan

Demand and Trends Analysis of Stevia in Japan Size and Share Forecast Outlook 2025 to 2035

Demand of Pistachio-based desserts & ingredients in France

Demand of Pistachio-based desserts & ingredients in France Analysis - Size, Share & Forecast 2025 to 2035

Demand and Trend Analysis of Women’s Intimate Care Product in Japan

Japan Women’s Intimate Care Market Trends – Growth & Forecast 2024-2034

Demand and Trend Analysis of Men’s Skincare Product in Western Europe

Western Europe Men’s Skincare Market Analysis – Forecast 2023-2033

Demand and Trend Analysis of Fabric Stain Remover in Korea

Demand and Trend Analysis of Fabric Stain Remover in Korea Size and Share Forecast Outlook 2025 to 2035

Demand and Sales Analysis of Paper Cup in Japan

Demand and Sales Analysis of Paper Cup in Japan Size and Share Forecast Outlook 2025 to 2035

Demand and Sales Analysis of Paper Cup in Korea

Demand and Sales Analysis of Paper Cup in Korea Size and Share Forecast Outlook 2025 to 2035

Demand and Sales Analysis of Paper Cup in Western Europe

Demand and Sales Analysis of Paper Cup in Western Europe Size and Share Forecast Outlook 2025 to 2035

Future Market Insights

Demand for Rice Bran Fatty Alcohols in UK

Chat With MaRIA

Chat With

MaRIA

Hi There, I am MaRIA, Your Market Research Intelligence Assistant. How may I help you?