The demand for bio-based levulinic acid in the USA is projected to grow from USD 13.5 billion in 2025 to USD 32.8 billion by 2035, reflecting a compound annual growth rate (CAGR) of 9.30%. Levulinic acid, a bio-based platform chemical derived from renewable biomass, plays a key role in various industries, including biofuels, plastics, pharmaceuticals, food additives, and solvents. As sustainability and the need for green chemistry solutions continue to gain importance across the globe, the demand for bio-based levulinic acid is rising. Its versatility in creating biofuels and bioplastics, alongside its use as a precursor for valuable chemical products, makes it a critical component in the transition towards eco-friendlier industrial practices.
One of the primary drivers of this demand is the increasing global emphasis on reducing reliance on petrochemicals. The US government’s regulatory support for renewable energy sources and eco-friendly feedstocks, particularly in sectors such as chemicals and energy, is playing a vital role in promoting the adoption of bio-based chemicals. Industries such as pharmaceuticals and food production are shifting toward green alternatives due to the rising consumer preference for eco-friendly, eco-friendly products. This trend is expected to continue throughout the next decade, with levulinic acid increasingly seen as a key ingredient for producing eco-friendly chemicals.
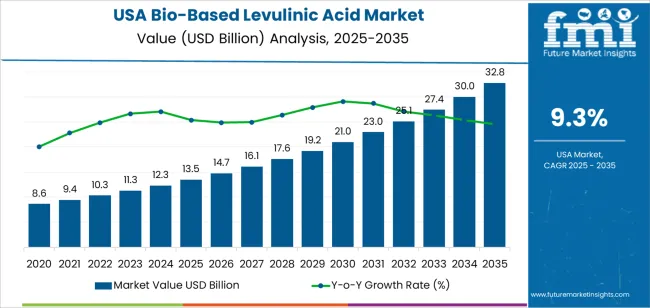
Between 2025 and 2030, the demand for bio-based levulinic acid in the USA will increase from USD 13.5 billion to approximately USD 14.7 billion. This gradual growth is driven by the initial adoption of levulinic acid derivatives in applications such as biofuels, bioplastics, and food-grade formulations. During this phase, the growth will be somewhat moderate as production capacities ramp up and the technology matures. Manufacturers will continue to develop cost-effective processes for producing levulinic acid, making it a more viable option for large-scale production.
From 2030 to 2035, the demand for bio-based levulinic acid is expected to rise more significantly, increasing from USD 14.7 billion to USD 32.8 billion. This sharp increase will be driven by technological advancements in levulinic acid production, improving efficiency, and reducing production costs. The commercialization of new bio-based products using levulinic acid as a key feedstock will gain momentum, particularly in sectors such as packaging, coatings, and solvents, where bio-based alternatives are becoming more popular due to their lower environmental impact. The shift towards eco-friendlier materials in industries like automotive, electronics, and consumer goods will significantly drive demand for levulinic acid, as it becomes a key component in the production of biodegradable and eco-friendly products.
| Metric | Value |
|---|---|
| Demand for Bio-Based Levulinic Acid in USA Value (2025) | USD 13.5 billion |
| Demand for Bio-Based Levulinic Acid in USA Forecast Value (2035) | USD 32.8 billion |
| Demand for Bio-Based Levulinic Acid in USA Forecast CAGR (2025-2035) | 9.3% |
The demand for bio-based levulinic acid in the USA is increasing as industries seek eco-friendly alternatives to petrochemical-derived chemicals. Levulinic acid, derived from biomass, is used in various applications, including biofuels, plastics, food additives, and pharmaceuticals. The growing preference for eco-friendly chemicals is driving the adoption of bio-based levulinic acid, as businesses and consumers look for more renewable, less environmentally harmful options.
The rising demand for biofuels and biodegradable plastics is one of the primary drivers of this growth. As the USA shifts towards eco-friendlier energy sources and products, levulinic acid offers a renewable building block for the production of bio-based chemicals. Furthermore, increasing regulations that promote the use of renewable resources in industrial processes are encouraging the adoption of bio-based levulinic acid across several sectors.
Technological advancements in production methods, along with the development of more efficient and cost-effective manufacturing processes, are also supporting this growth. As industries in the USA continue to prioritize sustainability and innovation, the demand for bio-based levulinic acid is expected to rise steadily through 2035, driven by its diverse applications and eco-friendly properties.
Demand for bio-based levulinic acid in the USA is segmented by product form, end-use industry, and region. By product form, demand is divided into liquid and solid, with liquid holding the largest share at 59%. The demand is also segmented by end-use industry, including energy & environment, automotive, packaging & consumer goods, pharmaceuticals and cosmetics, agriculture, and others, with energy & environment leading the demand at 41.5%. Regionally, demand is divided into West USA, South USA, Northeast USA, and Midwest USA.
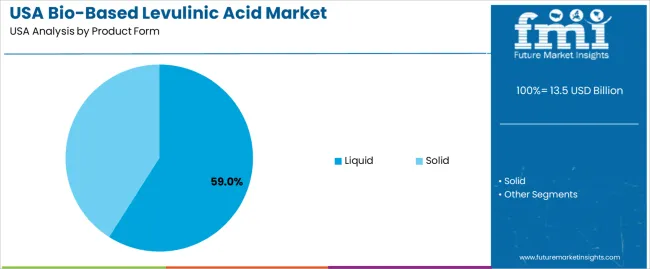
Liquid form accounts for 59% of the demand for bio-based levulinic acid in the USA. The liquid form of levulinic acid is more versatile and easier to handle in various industrial applications, particularly in the energy, automotive, and agricultural sectors. Its solubility and ease of integration into formulations and chemical processes make it a preferred choice for manufacturers. Liquid levulinic acid is used in the production of biofuels, as a solvent, and in the synthesis of other chemicals, such as plasticizers and agricultural products.
Its ease of use in these processes, combined with the growing demand for eco-friendly and renewable chemicals, contributes to its dominance in the market. The versatility, lower transportation costs, and broader range of applications ensure that liquid levulinic acid remains the leading form in the USA.
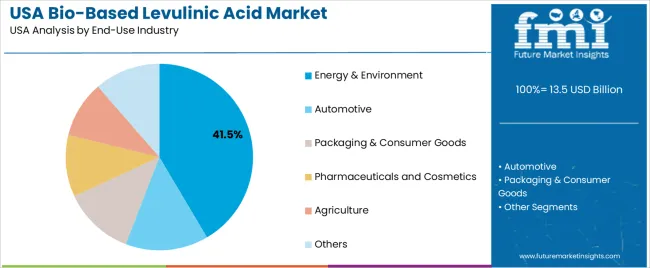
The energy & environment industry accounts for 41.5% of the demand for bio-based levulinic acid in the USA. Bio-based levulinic acid is a key building block in the production of biofuels, particularly in the development of eco-friendly and renewable energy sources. It is used in the conversion of biomass into liquid fuels, providing an alternative to petroleum-based products. As industries and governments focus on reducing carbon footprints and transitioning toward greener energy solutions, the demand for bio-based chemicals like levulinic acid has increased significantly.
Its applications in biofuel production and environmental sustainability drive the demand in this sector. Furthermore, levulinic acid is used in water treatment and as a platform chemical for other bio-based products, reinforcing its role in energy and environmental applications. As renewable energy initiatives continue to grow, the demand for bio-based levulinic acid in the energy & environment sector is expected to remain strong.
Key drivers include the growing corporate and regulatory emphasis on eco-friendly and renewable chemical alternatives, especially in sectors such as personal care, plastics, agriculture, and fuels. Regulations like the USDA BioPreferred Program encourage bio‑based content in chemicals. Also, levulinic acid serves as a versatile platform chemical for derivatives, which enhances its appeal. Restraints include the relatively high production cost and limited scale of bio‑based levulinic acid compared to petrochemical alternatives, feedstock variability and availability issues (biomass supply chain), and slower commercialisation of large‑scale production facilities, which limits availability and keeps margins under pressure.
In the USA, demand for bio‑based levulinic acid is growing because manufacturers across industries are seeking greener building‑blocks to meet sustainability goals and regulatory mandates. For example, cosmetic and personal‑care companies prefer bio‑based ingredients to differentiate their brands and satisfy clean‑label consumer trends. In plastics and packaging, the drive to replace fossil‑based monomers and plasticisers boosts interest in levulinic‑acid derivatives. Also, the development of advanced bio‑fuels and renewable chemical feedstocks increases the need for versatile platform chemicals such as levulinic acid. These combined factors are pushing USA demand upward.
Technological innovations are enabling growth of bio‑based levulinic acid in the USA by improving production efficiency, feedstock flexibility, and product purity. Advances include improved acid‑hydrolysis and biomass‑conversion technologies, development of catalysts and processes tailored for lignocellulosic feedstocks, and refinement of downstream derivatives for high‑value applications. Some innovations target lower cost‑per‑ton production and higher yields from non‑food biomass. These improvements reduce the gap versus fossil alternatives and make levulinic acid more commercially viable, thereby supporting broader adoption in USA industries.
Despite promising growth, adoption of bio‑based levulinic acid in the USA faces several major challenges. One is economics: bio‑based production remains more expensive and at smaller scale compared to established petrochemical routes, which limits price competitiveness and the willingness of end‑users to switch. Another is feedstock and supply chain: consistent, cost‑effective biomass sources and robust conversion infrastructure are still developing, which creates risk for large buyers. Production of high‑purity grades suitable for pharmaceuticals or sensitive applications requires further investment and validation. All of these factors slow down the pace at which levulinic acid can penetrate mainstream applications.
| Region | CAGR (%) |
|---|---|
| West | 10.7% |
| South | 9.6% |
| Northeast | 8.6% |
| Midwest | 7.4% |
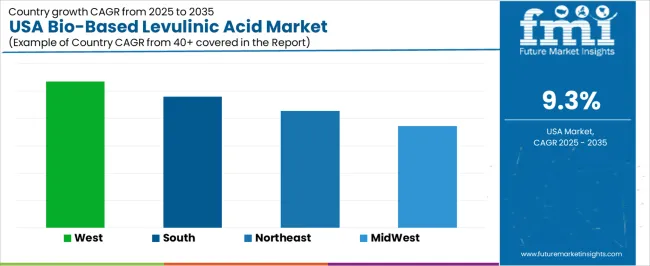
Demand for bio-based levulinic acid in the USA is increasing across all regions, with the West leading at a 10.7% CAGR. This growth is driven by the region’s emphasis on eco-friendly production and renewable chemicals, particularly in states like California. The South follows with a 9.6% CAGR, supported by its large agricultural sector and growing bio-refining industries. The Northeast shows a steady 8.6% CAGR, driven by its strong biotech and chemical sectors focused on sustainability. The Midwest experiences moderate growth at a 7.4% CAGR, with demand primarily driven by agricultural feedstock and bio-refining operations. As industries continue to prioritize sustainability and reduce reliance on fossil fuels, demand for bio-based levulinic acid is expected to grow in all regions.
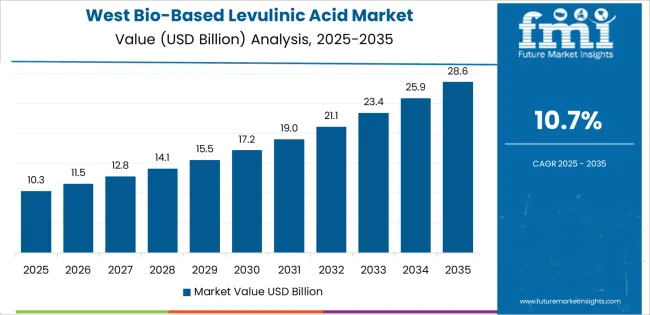
The West is experiencing the highest demand for bio-based levulinic acid in the USA, with a 10.7% CAGR. This growth is driven by the region’s strong focus on renewable chemicals and green technologies. California and other West Coast states are leaders in promoting eco-friendly and eco-friendly production methods, making bio-based levulinic acid a key component of the growing bioeconomy. The West’s robust agricultural base, particularly in states like California, supports the production of bio-based chemicals derived from renewable resources.
The increasing demand for bio-based solvents, fuels, and additives in various industries, including pharmaceuticals, cosmetics, and food, is further contributing to the rise of levulinic acid. The region’s emphasis on reducing carbon footprints and its favorable regulatory environment for bio-based products make it a critical driver for the growth of bio-based levulinic acid in the USA.
The South is seeing strong demand for bio-based levulinic acid in the USA, with a 9.6% CAGR. The region’s large agricultural sector and growing bio-refining industries are key contributors to this trend. States like Texas, Louisiana, and Georgia are increasingly adopting bio-based chemicals to support sustainability goals and reduce reliance on petroleum-based products. The South’s extensive agricultural activities, particularly in the production of corn and sugarcane, provide ample feedstock for the production of levulinic acid.
This renewable chemical is used in a wide range of applications, including biofuels, plastics, and food additives. The South’s expanding industrial and chemical manufacturing base is adopting levulinic acid as an eco-friendly alternative to traditional chemicals. As the region continues to invest in bio-refining and renewable energy technologies, the demand for bio-based levulinic acid is expected to grow significantly, driven by both agricultural production and industrial applications.
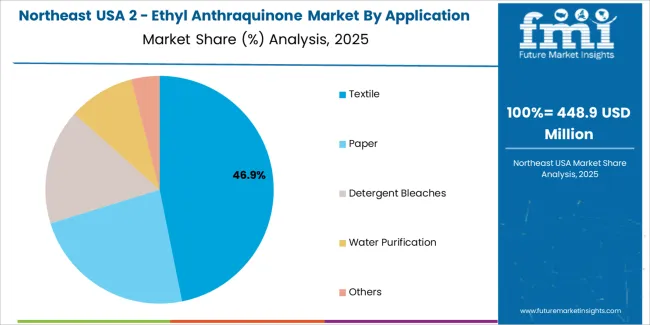
The Northeast is experiencing steady demand for bio-based levulinic acid in the USA, with an 8.6% CAGR. The region’s focus on sustainability, green technologies, and innovation in the chemical sector is driving the growth of bio-based levulinic acid. States like New York and Massachusetts are home to a large number of research institutions, biotech companies, and manufacturers that are increasingly adopting bio-based chemicals as part of their commitment to reducing environmental impact.
Levulinic acid is used in a variety of applications, including food additives, cosmetics, and pharmaceuticals, all of which have significant markets in the Northeast. The region’s emphasis on reducing carbon emissions and reliance on fossil fuels, along with growing consumer demand for eco-friendly products, supports the increasing adoption of bio-based levulinic acid. As businesses in the Northeast continue to prioritize sustainability, demand for levulinic acid is expected to grow steadily.
The Midwest is seeing moderate demand for bio-based levulinic acid in the USA, with a 7.4% CAGR. The region’s agricultural base, particularly in states like Iowa, Illinois, and Nebraska, provides a strong supply of biomass feedstock for producing levulinic acid. The growing adoption of renewable chemicals in industries such as agriculture, food processing, and biofuels is driving demand for bio-based levulinic acid.
The Midwest is home to many bio-refining operations, which are increasingly using levulinic acid in the production of biofuels, solvents, and other bio-based products. As the region continues to expand its focus on eco-friendly manufacturing and reduce its reliance on fossil fuels, levulinic acid is becoming an increasingly important component in the production of renewable chemicals. While the growth rate is more moderate than in the West and South, the Midwest’s focus on bio-refining and sustainability ensures a steady demand for bio-based levulinic acid.
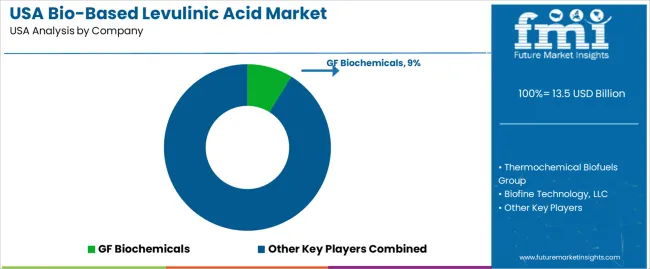
In the USA, demand for bio‑based levulinic acid is driven by increasing interest in renewable feedstock chemicals as alternatives to petrochemical-derived products. This versatile platform chemical finds applications across various industries, including biofuels, biodegradable plastics, agrochemicals, personal care products, and specialty solvents. It can be converted into a wide range of derivatives, making it highly valuable in the growing market for eco-friendly materials.
Key players in the USA bio‑based levulinic acid market include GF Biochemicals with an 8.8% share, Thermochemical Biofuels Group, Biofine Technology, LLC, Segetis, Inc., and Avantium N.V. These companies stand out by differentiating their offerings through unique feedstock sources, proprietary process technologies, and certifications for biobased content. GF Biochemicals leads the market, particularly in commercializing production technologies and scaling up manufacturing capacity.
The competitive dynamics are shaped by several factors. One key driver is the increasing adoption of renewable chemicals across various industries, spurred by both regulatory pressures and consumer demand for eco-friendly products. Innovations in production processes, such as more cost-effective methods and improved feedstock conversion technologies, are further boosting growth in the market. Challenges remain, such as the high cost of production, variability in feedstock supply, and competition from alternative bio-based chemicals. Companies that can scale production, reduce costs, and integrate effectively into downstream supply chains are well-positioned to capitalize on the growing demand for bio-based levulinic acid in the USA.
| Items | Values |
|---|---|
| Quantitative Units (2025) | USD billion |
| Product Form | Liquid, Solid |
| End-Use Industry | Energy & Environment, Automotive, Packaging & Consumer Goods, Pharmaceuticals and Cosmetics, Agriculture, Others |
| Region | West USA, South USA, Northeast USA, Midwest USA |
| Countries Covered | USA |
| Key Companies Profiled | GF Biochemicals, Thermochemical Biofuels Group, Biofine Technology, LLC, Segetis, Inc., Avantium N.V. |
| Additional Attributes | Dollar sales by product form and end-use industry; regional CAGR and adoption trends; demand trends in bio-based levulinic acid; growth in energy, automotive, packaging, and pharmaceuticals sectors; technology adoption for renewable chemicals; vendor offerings including production technologies and services; regulatory influences and industry standards |
The demand for bio-based levulinic acid in usa is estimated to be valued at USD 13.5 billion in 2025.
The market size for the bio-based levulinic acid in usa is projected to reach USD 32.8 billion by 2035.
The demand for bio-based levulinic acid in usa is expected to grow at a 9.3% CAGR between 2025 and 2035.
The key product types in bio-based levulinic acid in usa are liquid and solid.
In terms of end-use industry, energy & environment segment is expected to command 41.5% share in the bio-based levulinic acid in usa in 2025.


Our Research Products

The "Full Research Suite" delivers actionable market intel, deep dives on markets or technologies, so clients act faster, cut risk, and unlock growth.

The Leaderboard benchmarks and ranks top vendors, classifying them as Established Leaders, Leading Challengers, or Disruptors & Challengers.

Locates where complements amplify value and substitutes erode it, forecasting net impact by horizon

We deliver granular, decision-grade intel: market sizing, 5-year forecasts, pricing, adoption, usage, revenue, and operational KPIs—plus competitor tracking, regulation, and value chains—across 60 countries broadly.

Spot the shifts before they hit your P&L. We track inflection points, adoption curves, pricing moves, and ecosystem plays to show where demand is heading, why it is changing, and what to do next across high-growth markets and disruptive tech

Real-time reads of user behavior. We track shifting priorities, perceptions of today’s and next-gen services, and provider experience, then pace how fast tech moves from trial to adoption, blending buyer, consumer, and channel inputs with social signals (#WhySwitch, #UX).

Partner with our analyst team to build a custom report designed around your business priorities. From analysing market trends to assessing competitors or crafting bespoke datasets, we tailor insights to your needs.
Supplier Intelligence
Discovery & Profiling
Capacity & Footprint
Performance & Risk
Compliance & Governance
Commercial Readiness
Who Supplies Whom
Scorecards & Shortlists
Playbooks & Docs
Category Intelligence
Definition & Scope
Demand & Use Cases
Cost Drivers
Market Structure
Supply Chain Map
Trade & Policy
Operating Norms
Deliverables
Buyer Intelligence
Account Basics
Spend & Scope
Procurement Model
Vendor Requirements
Terms & Policies
Entry Strategy
Pain Points & Triggers
Outputs
Pricing Analysis
Benchmarks
Trends
Should-Cost
Indexation
Landed Cost
Commercial Terms
Deliverables
Brand Analysis
Positioning & Value Prop
Share & Presence
Customer Evidence
Go-to-Market
Digital & Reputation
Compliance & Trust
KPIs & Gaps
Outputs
Full Research Suite comprises of:
Market outlook & trends analysis
Interviews & case studies
Strategic recommendations
Vendor profiles & capabilities analysis
5-year forecasts
8 regions and 60+ country-level data splits
Market segment data splits
12 months of continuous data updates
DELIVERED AS:
PDF EXCEL ONLINE
USA Lactic Acid Market Analysis – Trends, Growth & Industry Insights 2025-2035
USA Adipic Acid Market Analysis – Size & Industry Trends 2025-2035
USA Hyaluronic Acid Products Market Insights – Growth, Demand & Forecast 2025-2035
Bio-Based Levulinic Acid Market Growth - Trends & Forecast 2025 to 2035
Demand for Acidity Regulator in USA Size and Share Forecast Outlook 2025 to 2035
Demand for Biobased Propylene Glycol in USA Size and Share Forecast Outlook 2025 to 2035
Demand for Bio-Based Levulinic Acid in Japan Size and Share Forecast Outlook 2025 to 2035
Demand for Biobased Biodegradable Plastic in USA Size and Share Forecast Outlook 2025 to 2035
Demand for Dihydroxybenzoic Acids (DHBA) in USA Size and Share Forecast Outlook 2025 to 2035
Biobased Binder for Nonwoven Market Size and Share Forecast Outlook 2025 to 2035
Acid Resistant Pipe Market Forecast and Outlook 2025 to 2035
Acid Coil Cleaner Market Size and Share Forecast Outlook 2025 to 2035
USA Medical Coding Market Size and Share Forecast Outlook 2025 to 2035
Acid Filling and Leveling Machine Market Size and Share Forecast Outlook 2025 to 2035
USA Labels Market Size and Share Forecast Outlook 2025 to 2035
USA Plant-based Creamers Market Size and Share Forecast Outlook 2025 to 2035
USA Barrier Coated Paper Market Size and Share Forecast Outlook 2025 to 2035
USA Electronic Health Records (EHR) Market Size and Share Forecast Outlook 2025 to 2035
USA Animal Model Market Size and Share Forecast Outlook 2025 to 2035
USA and Canada Packer Bottle Market Size and Share Forecast Outlook 2025 to 2035

Thank you!
You will receive an email from our Business Development Manager. Please be sure to check your SPAM/JUNK folder too.
Chat With
MaRIA