The demand for blind spot detection systems in the USA is expected to grow from USD 1.1 billion in 2025 to USD 3.7 billion by 2035, reflecting a CAGR of 13.2%. Blind spot detection (BSD) is a crucial component of driver assistance systems, enhancing vehicle safety by alerting drivers to vehicles in their blind spots, reducing the risk of accidents. As consumer demand for advanced driver-assistance systems (ADAS) grows, the need for blind-spot detection systems will continue to increase. The increasing adoption of ADAS technologies in both consumer vehicles and commercial fleets is expected to fuel market growth, especially as automakers integrate these systems into standard vehicle features to meet regulatory safety standards.
The demand will be further driven by the growing emphasis on vehicle safety, regulations mandating ADAS technologies, and consumer preference for enhanced driving experiences. Additionally, as more electric vehicles (EVs) and autonomous driving technologies become mainstream, blind spot detection will be integrated into a broader range of vehicles. Technological advancements in sensor systems, radar, and camera technology will make these systems more effective, affordable, and widespread, thus contributing to steady market growth through the forecast period.
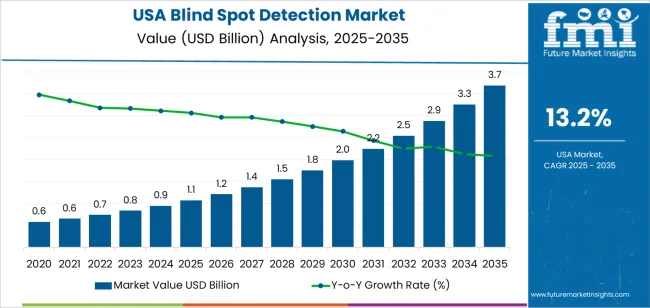
From 2025 to 2030, the demand for blind spot detection systems in the USA will grow from USD 1.1 billion to USD 2.0 billion, adding USD 0.9 billion in value. This early phase will see high acceleration driven by the increased adoption of driver assistance systems in consumer vehicles, particularly as vehicle manufacturers seek to comply with safety regulations and offer advanced features that enhance consumer satisfaction. During this period, the CAGR will be notably higher, reflecting the initial integration of blind spot detection systems into a broader range of vehicles, including mid-range models.
From 2030 to 2035, the market will grow from USD 2.0 billion to USD 3.7 billion, contributing USD 1.7 billion in value. While the growth rate will moderate slightly, the demand will continue to be strong, driven by the increasing installation of ADAS features across the vehicle fleet and the widespread use of blind spot detection as a standard safety feature in vehicles. As the market matures, technological innovations and cost reductions will further expand accessibility, allowing the system to be standardized across a wider range of vehicle models. Despite the deceleration in CAGR, the absolute dollar value opportunity will continue to grow due to the increasing market penetration and technological advancements.
| Metric | Value |
|---|---|
| Industry Sales Value (2025) | USD 1.1 billion |
| Industry Forecast Value (2035) | USD 3.7 billion |
| Industry Forecast CAGR (2025-2035) | 13.2% |
Demand for blind spot detection systems in the USA is being pushed by increased regulatory focus on vehicle safety and the growing expectation that new vehicles offer advanced driver assistance features. The National Highway Traffic Safety Administration (NHTSA) has announced that, starting with model year 2026 vehicles, requirements will include blind spot warning and intervention systems in its crash rating program. As original equipment manufacturers (OEMs) respond, uptake in new vehicles rises accordingly. Market analysis shows the broader regional segment is forecast to grow at a compound annual growth rate (CAGR) of about 10.1 % through the late 2020s.
Another important factor is the transition toward electric vehicles (EVs) and connected vehicles, which frequently incorporate sensor based safety features as standard. Automakers are increasingly fitting radar, camera, and ultrasonic based blind spot systems across vehicle classes, not only luxury models. This upward trend is supported by the replacement market for aftermarket systems and aftermarket installation in older vehicles lacking factory fitted solutions. Challenges include the cost of sensor hardware and calibration, integration complexity within mixed OEM and aftermarket channels, and consumer awareness of aftermarket options. Nonetheless, as safety regulations converge, vehicle technology advances, and consumer awareness grows, the demand for blind spot detection systems in the USA is expected to rise.
The demand for blind spot detection in the USA is primarily driven by technology and sales channel. The leading technology is radar sensors, capturing 37% of the market share, while Original Equipment Manufacturer (OEM) sales dominate, accounting for 82.1% of the demand. Blind spot detection systems are becoming a crucial safety feature in vehicles, with advanced sensor technologies and the growing adoption of these systems in both new and existing vehicles driving the market.
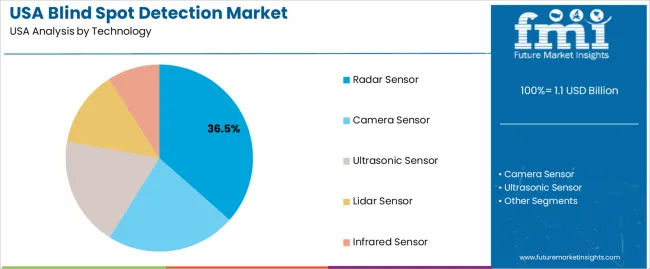
Radar sensors lead the demand for blind spot detection systems in the USA, holding 37% of the market share. Radar sensors are widely preferred for their ability to provide reliable and accurate detection, even in challenging conditions such as poor weather or low visibility. These sensors work by emitting radio waves to detect the presence of objects in the vehicle’s blind spots, making them an essential component for improving vehicle safety.
The demand for radar sensors is driven by their robustness, precision, and ability to operate over longer ranges, making them ideal for use in blind spot detection systems. They are less affected by environmental factors like rain or fog, offering a higher degree of reliability compared to other sensor types. As the automotive industry continues to focus on enhancing vehicle safety features and the growing demand for autonomous driving technologies, radar sensors are expected to remain the dominant technology for blind spot detection systems.
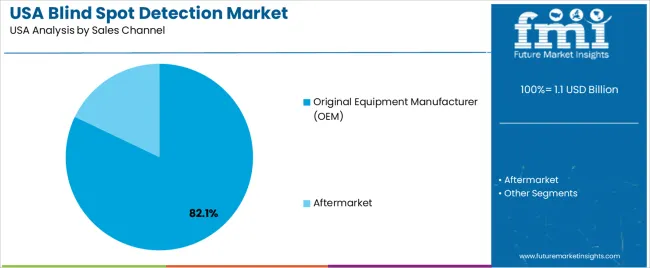
Original Equipment Manufacturer (OEM) sales dominate the demand for blind spot detection systems in the USA, capturing 82.1% of the market share. OEMs play a critical role in integrating blind spot detection systems into new vehicles as standard or optional safety features. Automakers are increasingly incorporating these systems into a wide range of vehicle models, from economy to luxury cars, as consumer demand for advanced driver assistance systems (ADAS) continues to grow.
The high demand for OEM-installed blind spot detection systems is driven by the increased focus on safety, regulatory requirements, and consumer expectations for modern vehicles. As more consumers prioritize safety features, OEMs are incorporating these systems into more models, making them widely available to vehicle buyers. The rise in new car sales, combined with the growing adoption of advanced safety technologies, ensures that OEMs will continue to drive the market for blind spot detection systems in the USA.
Demand for blind spot detection systems (BSD) in the USA is driven by increasing concern over vehicle safety, regulatory pressure on advanced driver assistance systems (ADAS), and rising vehicle production for passenger and commercial markets. Consumers are choosing vehicles equipped with safety features as standard, while automakers integrate sensors such as radar and cameras to meet competitive demands. At the same time, rising costs of sensor modules, complexity of integrating systems in vehicles, and the emergence of fully electric vehicles (EVs) altering component needs moderate growth. These factors together define the emerging trajectory of BSD system adoption in the USA
Several factors support growth. First, regulatory actions are encouraging or mandating the inclusion of driver assistance and blind spot warning technologies in new vehicles. An updated rule by the National Highway Traffic Safety Administration (NHTSA) relevant to blind spot warning and intervention will apply to vehicles as early as the 2026 model year. Second, consumer demand for safer vehicles and premium features means automakers increasingly offer BSD systems both in luxury and mainstream models. Third, the shift to electric vehicles supports more sensor heavy architectures since EV platforms more easily accommodate camera and radar systems. Fourth, the rise of connected vehicle and fleet management applications uses BSD systems as part of telematics and safety analytics, expanding use cases beyond traditional passenger cars.
Despite favourable drivers, several constraints apply. Cost remains a concern: advanced radar or camera systems add vehicle BOM (bill of materials) cost and can constrain uptake in lower priced vehicle segments. Integration complexity is also a hurdle: OEMs must coordinate sensors, software, and calibration, and retrofit or aftermarket systems face compatibility issues. Moreover, EV transition presents mixed impact: as electric vehicles change architectures, some traditional sensor modules may be eliminated or changed, affecting demand for legacy BSD components. Finally, supply chain constraints for sensors, semiconductors and testing infrastructure may delay rollout or increase module cost for manufacturers.
Important trends include increased use of multi sensor fusion in BSD systems combining radar, camera and ultrasonic sensors for more accurate detection under varied conditions (rain, snow, glare). There is also growth in aftermarket and retrofit BSD systems for older vehicles through sensor kit vendors and fleet applications. Connected vehicle platforms and over the air updates are enabling BSD systems to evolve post sale and support predictive maintenance and incident analytics. Finally, as autonomous driving develops, BSD functionality is converging with lane change assist, blind zone monitoring and surround view systems, making BSD part of a broader ADAS suite rather than a standalone feature.
The demand for blind spot detection systems in the USA is growing rapidly, with regional variations reflecting different rates of adoption and technological integration. The West leads the demand with a CAGR of 15.2%, driven by high levels of technological innovation, consumer interest in vehicle safety, and the region's strong automotive market. The South follows closely with a CAGR of 13.6%, benefiting from the expanding automotive manufacturing sector and growing awareness of driver assistance technologies.
The Northeast shows steady growth at 12.1%, supported by its well-established automotive market and increasing consumer preference for safety features. The Midwest has the lowest growth rate at 10.6%, although it still reflects a healthy demand, driven by the region’s established car manufacturing industry and steady technological adoption. Overall, the demand for blind spot detection systems is strong across the USA, fueled by consumer demand for advanced safety features and the increasing integration of driver assistance technologies in vehicles.

| Region | CAGR (2025-2035) |
|---|---|
| West | 15.2% |
| South | 13.6% |
| Northeast | 12.1% |
| Midwest | 10.6% |
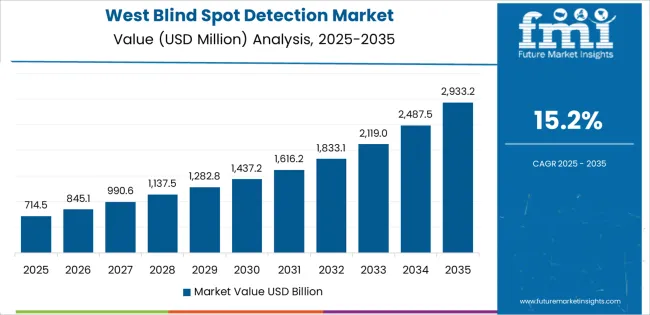
The demand for blind spot detection in the West is projected to grow at a CAGR of 15.2%, reflecting the region’s leadership in technological innovation and consumer adoption of advanced safety features. The West, particularly states like California, is a hub for automotive manufacturers and tech companies, which are increasingly integrating advanced driver assistance systems (ADAS) into vehicles.
The high consumer awareness and demand for enhanced vehicle safety, combined with the region’s progressive stance on environmental and technological regulations, contribute significantly to the adoption of blind spot detection systems. As consumers prioritize safety in their vehicle purchasing decisions, the West’s dynamic automotive market continues to drive substantial demand for these systems. Additionally, the region’s focus on electric vehicles and autonomous driving technologies further accelerates the integration of safety features such as blind spot detection.
In the South, the demand for blind spot detection is expected to grow at a CAGR of 13.6%, fueled by the region’s rapidly expanding automotive manufacturing sector and a growing focus on vehicle safety. The South is home to several major automotive manufacturers, including those focused on both traditional vehicles and newer electric vehicle models, which are increasingly incorporating advanced safety technologies like blind spot detection.
As the region’s car production and sales increase, so too does the demand for vehicles equipped with cutting-edge safety features. The growing awareness of road safety and the rising number of vehicle accidents also play a role in driving consumer demand for blind spot detection systems. Furthermore, as regional automakers continue to innovate and meet consumer expectations for safer vehicles, the demand for these systems is expected to grow steadily in the South.
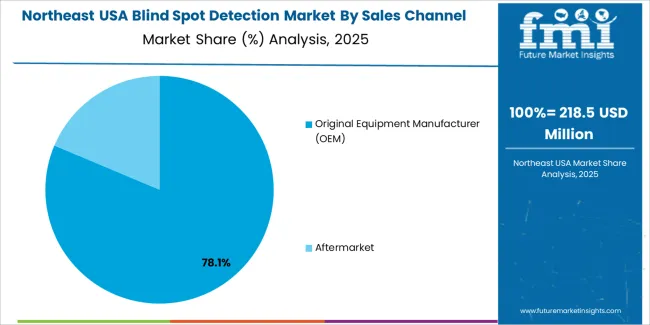
In the Northeast, the demand for blind spot detection is projected to grow at a CAGR of 12.1%, supported by the region’s established automotive market and increasing consumer demand for safety technologies. The Northeast has a large, mature vehicle market, with a high proportion of consumers prioritizing safety features in their purchasing decisions. With a significant number of urban areas and high population density, traffic-related accidents are a key concern, further driving demand for advanced driver assistance systems (ADAS) like blind spot detection.
The Northeast’s well-developed automotive infrastructure, including numerous dealerships and repair centers, supports the steady integration of these systems into vehicles. Additionally, regulatory pressures regarding vehicle safety standards and an increasing consumer preference for high-tech features in vehicles contribute to the consistent growth of demand for blind spot detection in the region.
The demand for blind spot detection in the Midwest is expected to grow at a CAGR of 10.6%, reflecting steady, though more moderate, adoption compared to other regions. The Midwest is home to many traditional automotive manufacturing centers, particularly in Michigan and Ohio, where vehicle safety features are increasingly being integrated into both new vehicles and models produced by domestic automakers. However, the region tends to adopt new technologies at a slightly slower pace than the West and South, which contributes to the slower growth in blind spot detection demand.
Nevertheless, as consumer awareness about the importance of vehicle safety grows and automakers continue to include more advanced safety technologies in their vehicles, demand for these systems is expected to rise. The Midwest’s strong automotive industry, coupled with its increasing emphasis on enhancing driver safety, ensures steady growth in the demand for blind spot detection systems.
The demand for blind spot detection systems in the United States is growing, driven by higher awareness of vehicle safety, increased vehicle production, and the integration of advanced driver assistance systems (ADAS). Market analysis shows the North American segment of the automotive blind spot detection system market is expected to grow at a compound annual growth rate (CAGR) of around 10.1% through 2031, with the USA being the dominant country in the region. Key companies in this industry include Continental AG (holding approximately 20% share), Bosch, Denso Corporation, Aptiv and Valeo. These firms develop radar , camera and sensor based systems that alert drivers to vehicles or objects in their blind spots during lane changes or merging.
Companies compete on technology performance, sensor integration and alignment with OEM standards. Firms invest in higher resolution radar and camera sensors that deliver reliable detection under varied driving conditions. Another competitive aspect is system integration: solutions that can be embedded within a vehicle’s existing ADAS platform, linked with V2V (vehicle to vehicle) or V2I (vehicle to infrastructure) systems, offer manufacturers a stronger value proposition.
Further differentiation arises from cost reduction, modular design and compatibility with both conventional internal combustion engines and electric vehicle architectures. Marketing materials commonly highlight detection range, false alarm rate, compatibility with multiple vehicle platforms and ease of retrofitting. By focusing on these technical and integration features, companies aim to strengthen their position in the USA blind spot detection system industry.
| Items | Details |
|---|---|
| Quantitative Units | USD Billion |
| Regions Covered | USA |
| Technology | Radar Sensor, Camera Sensor, Ultrasonic Sensor, Lidar Sensor, Infrared Sensor |
| Sales Channel | Original Equipment Manufacturer (OEM), Aftermarket |
| Vehicle Type | Passenger Vehicle, Light Commercial Vehicle, Heavy Commercial Vehicle |
| Key Companies Profiled | Continental AG, Bosch, Denso Corporation, Aptiv, Valeo |
| Additional Attributes | The market analysis includes dollar sales by technology, sales channel, vehicle type, and company categories. It also covers regional demand trends in the USA, particularly driven by the increasing adoption of blind spot detection systems in passenger, light commercial, and heavy commercial vehicles. The competitive landscape highlights key manufacturers focusing on innovations in sensor technologies, including radar, camera, ultrasonic, lidar, and infrared sensors. Trends in the growing demand for enhanced safety features in vehicles, along with advancements in sensor integration, system reliability, and real-time data processing, are explored. |
The demand for blind spot detection in usa is estimated to be valued at USD 1.1 billion in 2025.
The market size for the blind spot detection in usa is projected to reach USD 3.7 billion by 2035.
The demand for blind spot detection in usa is expected to grow at a 13.2% CAGR between 2025 and 2035.
The key product types in blind spot detection in usa are radar sensor, camera sensor, ultrasonic sensor, lidar sensor and infrared sensor.
In terms of sales channel, original equipment manufacturer (oem) segment is expected to command 82.1% share in the blind spot detection in usa in 2025.


Our Research Products

The "Full Research Suite" delivers actionable market intel, deep dives on markets or technologies, so clients act faster, cut risk, and unlock growth.

The Leaderboard benchmarks and ranks top vendors, classifying them as Established Leaders, Leading Challengers, or Disruptors & Challengers.

Locates where complements amplify value and substitutes erode it, forecasting net impact by horizon

We deliver granular, decision-grade intel: market sizing, 5-year forecasts, pricing, adoption, usage, revenue, and operational KPIs—plus competitor tracking, regulation, and value chains—across 60 countries broadly.

Spot the shifts before they hit your P&L. We track inflection points, adoption curves, pricing moves, and ecosystem plays to show where demand is heading, why it is changing, and what to do next across high-growth markets and disruptive tech

Real-time reads of user behavior. We track shifting priorities, perceptions of today’s and next-gen services, and provider experience, then pace how fast tech moves from trial to adoption, blending buyer, consumer, and channel inputs with social signals (#WhySwitch, #UX).

Partner with our analyst team to build a custom report designed around your business priorities. From analysing market trends to assessing competitors or crafting bespoke datasets, we tailor insights to your needs.
Supplier Intelligence
Discovery & Profiling
Capacity & Footprint
Performance & Risk
Compliance & Governance
Commercial Readiness
Who Supplies Whom
Scorecards & Shortlists
Playbooks & Docs
Category Intelligence
Definition & Scope
Demand & Use Cases
Cost Drivers
Market Structure
Supply Chain Map
Trade & Policy
Operating Norms
Deliverables
Buyer Intelligence
Account Basics
Spend & Scope
Procurement Model
Vendor Requirements
Terms & Policies
Entry Strategy
Pain Points & Triggers
Outputs
Pricing Analysis
Benchmarks
Trends
Should-Cost
Indexation
Landed Cost
Commercial Terms
Deliverables
Brand Analysis
Positioning & Value Prop
Share & Presence
Customer Evidence
Go-to-Market
Digital & Reputation
Compliance & Trust
KPIs & Gaps
Outputs
Full Research Suite comprises of:
Market outlook & trends analysis
Interviews & case studies
Strategic recommendations
Vendor profiles & capabilities analysis
5-year forecasts
8 regions and 60+ country-level data splits
Market segment data splits
12 months of continuous data updates
DELIVERED AS:
PDF EXCEL ONLINE
Blind Spot Detection Market Growth - Trends & Forecast 2025 to 2035
Demand for Blind Spot Detection in Japan Size and Share Forecast Outlook 2025 to 2035
Adaptive Cruise Control and Blind Spot Detection Market Analysis - Size, Share, and Forecast Outlook 2025 to 2035
Blind Spot Monitor Market Size and Share Forecast Outlook 2025 to 2035
Automotive Blind Spot Monitors Market
Blinds and Shades Market Size and Share Forecast Outlook 2025 to 2035
USA Medical Coding Market Size and Share Forecast Outlook 2025 to 2035
USA Labels Market Size and Share Forecast Outlook 2025 to 2035
USA Plant-based Creamers Market Size and Share Forecast Outlook 2025 to 2035
USA Barrier Coated Paper Market Size and Share Forecast Outlook 2025 to 2035
USA Electronic Health Records (EHR) Market Size and Share Forecast Outlook 2025 to 2035
USA Animal Model Market Size and Share Forecast Outlook 2025 to 2035
USA and Canada Packer Bottle Market Size and Share Forecast Outlook 2025 to 2035
USA Stretch Hood Films Market Size and Share Forecast Outlook 2025 to 2035
USA and Canada Fence Screen Market Size and Share Forecast Outlook 2025 to 2035
USA Lubricant Contaminated HDPE Container Waste Market Size and Share Forecast Outlook 2025 to 2035
USA Commercial Walk-In Refrigeration Market Size and Share Forecast Outlook 2025 to 2035
USA & Canada Pre-painted Steel Roofing and Cladding Market Size and Share Forecast Outlook 2025 to 2035
USA Residential Cotton Candy Maker Market Size and Share Forecast Outlook 2025 to 2035
USA Faith Based Tourism Market Size and Share Forecast Outlook 2025 to 2035

Thank you!
You will receive an email from our Business Development Manager. Please be sure to check your SPAM/JUNK folder too.
Chat With
MaRIA