The demand for fitness apps in the USA is expected to grow from USD 2.6 billion in 2025 to USD 7.9 billion by 2035, reflecting CAGR of 11.90%. The increasing focus on personal health, well-being, and fitness, combined with advancements in digital technologies, has made fitness apps an essential tool for millions of users across the nation. As people seek more flexible and accessible ways to maintain a healthy lifestyle, fitness apps offer convenient solutions that provide personalized workout plans, nutrition tracking, and mental wellness support.
The rise of wearable technologies, such as fitness trackers and smartwatches, has further boosted the adoption of fitness apps. These apps integrate seamlessly with devices, allowing users to track their health data in real-time. Moreover, the pandemic significantly accelerated the shift toward home-based fitness solutions, which further accelerated the demand for fitness apps. As a result, consumers are increasingly turning to these apps for everything from guided workouts to stress management, contributing to the industry's overall growth.
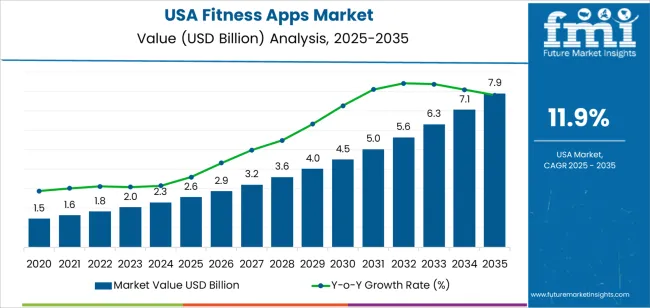
Between 2025 and 2030, the demand for fitness apps in the USA will increase from USD 2.6 billion to USD 4.5 billion, adding USD 1.9 billion. During this phase, the demand will be driven by the expanding user base, as more people seek digital solutions for fitness and wellness. The app's continued integration with wearable technology and the increasing preference for at-home fitness solutions will continue to fuel this growth. Additionally, as fitness apps evolve to offer more comprehensive health solutions, including personalized programs and virtual coaching, their popularity will rise even further.
From 2030 to 2035, the demand for fitness apps is expected to grow from USD 4.5 billion to USD 7.9 billion, adding USD 3.4 billion. This phase will see a sharp rise in demand, driven by continued technological innovation, the increasing penetration of digital fitness solutions, and the growing awareness around health and well-being. As the fitness app industry becomes more competitive, companies will focus on enhancing user experience, expanding their offerings, and integrating advanced technologies like artificial intelligence and virtual reality to further engage and retain users.
| Metric | Value |
|---|---|
| Demand for Fitness Apps in USA Value (2025) | USD 2.6 billion |
| Demand for Fitness Apps in USA Forecast Value (2035) | USD 7.9 billion |
| Demand for Fitness Apps in USA Forecast CAGR (2025 to 2035) | 11.90% |
The demand for fitness apps in the USA is rising as more consumers turn to digital solutions for health and wellness. With increasing health consciousness, people are seeking flexible and accessible ways to track fitness goals, monitor nutrition, and access workout routines. Fitness apps offer convenience and personalized options that cater to users at various levels of fitness, from beginners to advanced athletes, contributing to their growing popularity.
The rise of the at-home fitness trend, amplified by recent global events, has further fueled the adoption of fitness apps. Users are shifting away from traditional gym memberships, opting instead for digital platforms that offer on-demand workouts, live classes, and virtual coaching. This transition is driving demand for a variety of fitness app features, such as integration with wearable devices, personalized training plans, and nutrition tracking tools, making it easier for users to manage their fitness journey.
Technological innovations, including AI-powered personalized fitness plans, and the increasing integration of fitness apps with other health-tracking tools are boosting growth. As health and fitness continue to be prioritized, consumers are adopting fitness apps for their ability to provide real-time data and tailored experiences. This trend is expected to drive the steady expansion of the fitness app industry in the USA through 2035.
Demand for fitness apps in the USA is segmented by type, platform, and device type. By type, demand is divided into exercise & weight loss, diet & nutrition, and activity tracking, with exercise & weight loss holding the largest share. In terms of platform, the industry is categorized into iOS, Android, and others, with iOS leading the demand. The device type segment includes wearable devices, tablets, and smartphones, with wearable devices accounting for the highest share. Regionally, demand is divided into West, South, Northeast, and Midwest.
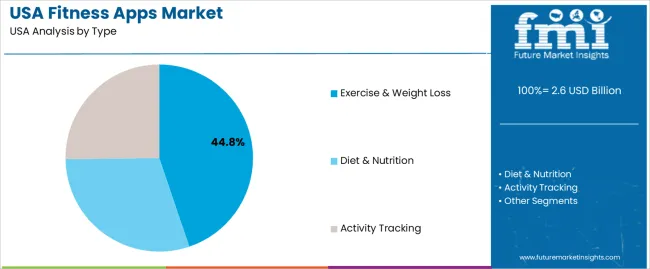
Exercise & weight loss apps account for 45% of the demand for fitness apps in the USA. These apps are designed to help users achieve their fitness goals, such as weight loss, body toning, and improving overall physical health through various workout routines, exercise programs, and weight loss strategies. The demand for exercise & weight loss apps is driven by the growing consumer focus on health, fitness, and maintaining an active lifestyle, particularly as more people turn to digital solutions for personalized fitness guidance and motivation.
The popularity of these apps is fueled by the increasing prevalence of obesity and sedentary lifestyles, leading to a higher demand for accessible fitness solutions. Exercise & weight loss apps offer users the flexibility to work out from home, track their progress, and receive personalized exercise plans, making them convenient and effective for individuals looking to improve their fitness. With the growing trend of health consciousness and fitness awareness, the demand for these apps is expected to continue rising, making them the leading category in the fitness app industry.
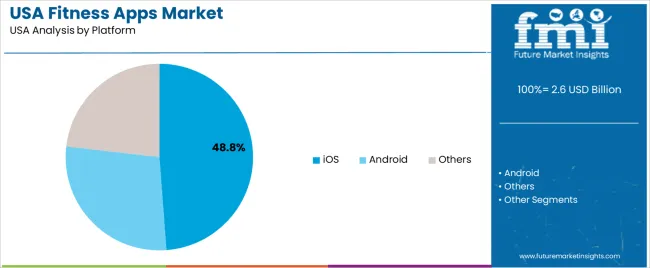
iOS accounts for 48.8% of the demand for fitness apps in the USA. The popularity of the iOS platform for fitness apps is largely driven by the high adoption rate of Apple devices, such as iPhones and iPads, which are widely used by consumers for health and fitness tracking. iOS users are often early adopters of new technologies and tend to be more engaged with health-focused apps that integrate seamlessly with Apple’s ecosystem, including the Apple Health app and Apple Watch.
The demand for fitness apps on iOS is also fueled by the platform’s robust app store, which offers a wide range of highly rated and user-friendly fitness apps, along with seamless integration with wearable devices like the Apple Watch. These features enhance the user experience by allowing easy synchronization of fitness data across devices. As health tracking and fitness monitoring become more integrated into everyday life, iOS remains the dominant platform for fitness apps, further driving demand.
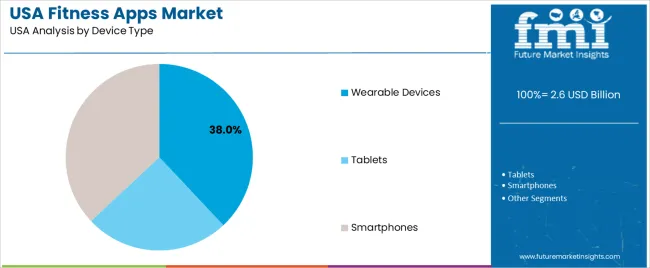
Wearable devices account for 38% of the demand for fitness apps in the USA. Devices like fitness trackers, smartwatches, and heart rate monitors are increasingly used in conjunction with fitness apps to track physical activity, monitor heart rates, and provide real-time data on exercise performance. The rise in the use of wearables has significantly contributed to the demand for fitness apps, as these devices offer users personalized insights into their health and fitness progress.
The demand for wearable devices is driven by their ability to offer continuous, hands-free fitness tracking, which allows users to monitor their activity levels, calories burned, and sleep patterns throughout the day. As wearable technology continues to evolve, with features like GPS tracking, step counting, and even advanced health metrics, the demand for fitness apps that sync with these devices will continue to grow. The combination of convenience, real-time data, and improved health tracking has made wearable devices an essential tool for fitness enthusiasts, driving their dominance in the fitness app industry.
Fitness apps offer features such as workout planning, activity tracking, nutrition guidance, and remote coaching. Key drivers include rising health awareness, increased smartphone and wearable device penetration, integration with digital health services, and the shift toward remote / hybrid fitness patterns since the pandemic. Restraints include concerns about data privacy and security, high competition and user‑churn in app subscriptions, and the challenge of long‑term user engagement and retention despite initial downloads.
Why is Demand for Fitness Apps Growing in USA?
In the USA, demand is growing because consumers are increasingly adopting digital fitness solutions to complement or replace traditional gym‑based workouts. Smartphone ubiquity, the convenience of on‑demand workouts, and seamless integration with wearables make fitness apps appealing. As people seek flexible options (home workouts, outdoor routines, tracked progress) and more personalised health management, apps are well‑positioned. Employers and insurers are also promoting digital fitness tools as part of wellness programmes, further broadening uptake. The synergy of technology, wellness culture and user‑convenience is thus driving growth.
How are Technological Innovations Driving Growth of Fitness Apps in the USA?
Technological innovations are accelerating growth by increasing capability, personalisation, and user‑engagement in fitness apps. Key innovations include AI‑driven workout suggestions, adaptive training plans based on user data, integration with wearables (heart‑rate sensors, smart watches), and social / gamified elements that help motivate users. Cloud connectivity enables syncing across devices, tracking trends and sharing progress. As these features improve, apps become more compelling and justify subscription models thus driving adoption among both new and existing users.
What are the Key Challenges Limiting Adoption of Fitness Apps in the USA?
Despite strong momentum, several challenges limit adoption. One major issue is user retention: many users download apps but abandon use after a short period, reducing lifetime value. Privacy and security concerns regarding personal health data remain significant barriers for some consumers. The crowded app industry means differentiation is tough and many apps engage in heavy discounting or freemium‑models that can compress margins. Also, while technology allows deep personalisation, many users prefer live or in‑person interaction for motivation, limiting the appeal of purely digital offerings. Insurers or employers who promote wellness apps face measurable‑outcome pressure, and apps must demonstrate ROI to sustain partnerships.
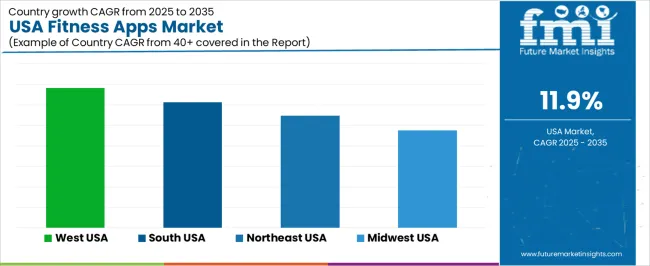
| Region | CAGR (%) |
|---|---|
| West | 13.7% |
| South | 12.2% |
| Northeast | 10.9% |
| Midwest | 9.5% |
The demand for fitness apps in the USA is growing across all regions, with the West leading at a 13.7% CAGR. This is driven by the region’s health-conscious culture, high smartphone penetration, and the growing popularity of virtual fitness solutions. The South follows with a 12.2% CAGR, supported by the increasing number of fitness enthusiasts and rising health awareness. The Northeast shows a 10.9% CAGR, influenced by urban living and access to a wide range of fitness services. The Midwest experiences moderate growth at 9.5%, driven by increasing app usage in both urban and rural areas as more people embrace digital fitness solutions.
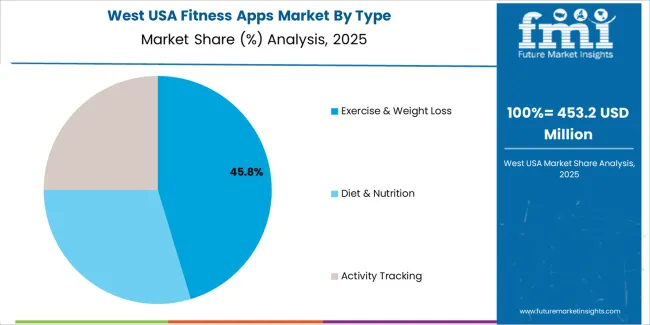
The West is experiencing the highest demand for fitness apps in the USA, with a 13.7% CAGR. This growth is primarily driven by the region’s focus on health, wellness, and active lifestyles, especially in cities like Los Angeles, San Francisco, and Seattle. These urban centers are hubs for fitness enthusiasts who are early adopters of digital fitness solutions. The increasing popularity of home workouts, coupled with the strong culture of health and fitness in the West, has contributed to a surge in demand for fitness apps.
With high smartphone penetration and a tech-savvy population, the West has become a key region for virtual fitness solutions. Consumers in this region are drawn to the convenience and flexibility that fitness apps offer, allowing them to access personalized workout plans, track progress, and engage in real-time fitness classes. The growing interest in home-based fitness solutions, especially post-pandemic, continues to drive this trend. As more individuals embrace digital tools for health management, the demand for fitness apps in the West is expected to remain strong.
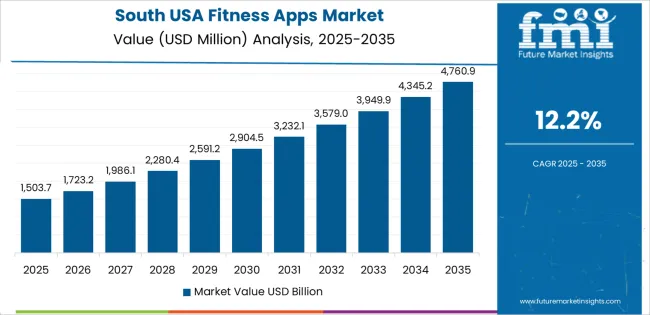
The South is seeing strong demand for fitness apps, with a 12.2% CAGR. The region’s growing health consciousness is a key driver of this demand. States like Texas, Florida, and Georgia have large, diverse populations that are increasingly adopting fitness apps to monitor workouts, follow personalized fitness plans, and access virtual training. The South’s expanding fitness infrastructure, including gyms, wellness centers, and online fitness platforms, is contributing to this growth.
The South’s warm climate and lifestyle encourage outdoor activities like walking, running, and biking, which further increases the demand for apps that track fitness progress. As more consumers in the South seek to integrate fitness into their busy lives, digital solutions such as fitness apps have become essential tools. The region’s increasing focus on wellness, combined with an expanding network of fitness-related services, ensures that the demand for fitness apps in the South will continue to grow at a steady pace.
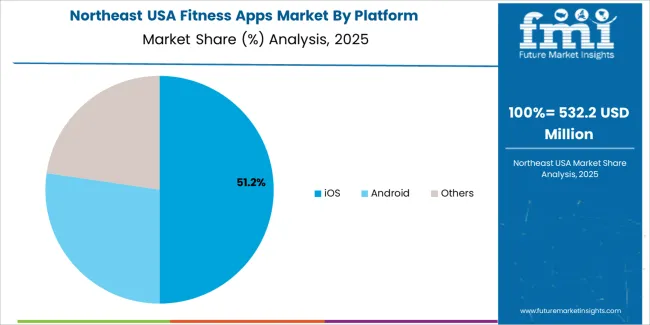
The Northeast is experiencing steady demand for fitness apps, with a 10.9% CAGR. The region’s dense urban population, particularly in cities like New York, Boston, and Philadelphia, is contributing to this trend. In these urban centers, time constraints and fast-paced lifestyles make fitness apps a popular choice for individuals seeking flexibility in their workout routines. Fitness apps allow consumers to engage in personalized fitness programs, track their health metrics, and even attend virtual fitness classes from the convenience of their homes or offices.
The Northeast has also seen an increasing focus on wellness, with many residents prioritizing health, fitness, and overall well-being. The region’s tech-savvy consumer base, combined with the availability of advanced digital fitness platforms, has driven the growth of fitness apps. As more people turn to digital solutions for exercise, recovery, and health management, the demand for fitness apps continues to grow. The Northeast’s focus on innovation and well-being, along with its urban infrastructure, ensures sustained growth in fitness app usage.
The Midwest is seeing moderate growth in demand for fitness apps, with a 9.5% CAGR. The region’s increasing focus on health, wellness, and fitness is supporting the growing use of digital fitness solutions. Cities like Chicago, Detroit, and Minneapolis are seeing more consumers adopting fitness apps to help them manage their workouts and health goals. The rise of home-based fitness, particularly in suburban areas, has contributed to the steady demand for fitness apps in the Midwest.
While growth is slower compared to regions like the West and South, the Midwest's increasing focus on personal health and fitness is creating a solid foundation for fitness app adoption. With more consumers interested in tracking their fitness journeys and accessing personalized training plans, fitness apps are becoming more popular. The region’s expanding network of gyms, wellness centers, and e-commerce platforms offering fitness solutions is further driving this growth. As the focus on health continues to increase, the Midwest will likely see steady growth in fitness app demand over the coming years.
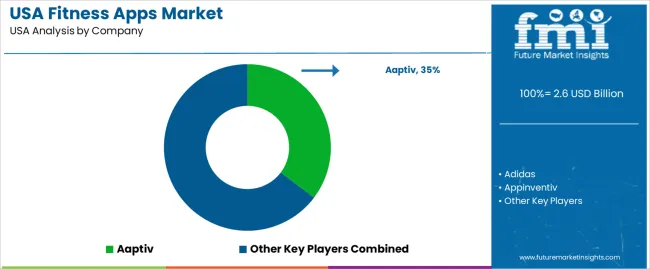
The demand for fitness apps in the United States has surged as health‑and‑wellness becomes a stronger focus for consumers and technology providers alike. With high smartphone and wearable devices penetration, users increasingly rely on fitness apps for workout planning, nutrition tracking, and wellness coaching. The expansion of remote and home‑based fitness options, particularly in recent years, has further accelerated this shift.
Within the USA demand landscape, Aaptiv is estimated to hold approximately 35.3% of share, reflecting its significant position in the providing subscription‑based audio and video workout content across mobile platforms. Other notable companies supporting the USA fitness app demand include Adidas, Appinventiv, Applico, and Azumio, Inc., each contributing through different models such as branded fitness content, app development platforms, or mobile health hubs.
Key drivers of this demand include increased consumer health consciousness, the integration of AI and personalization into app experiences, and the growth of fitness apps as part of corporate wellness programs. Technological advances such as seamless wearable integration, social‑fitness features, and virtual coaching enhance user engagement and retention. While challenges like privacy concerns, app fatigue, and subscription sentiment remain, the outlook for fitness‑app demand in the USA is robust, with continued growth expected as digital wellness becomes increasingly embedded in everyday life.
| Items | Values |
|---|---|
| Quantitative Unit | USD billion |
| Type | Exercise & Weight Loss, Diet & Nutrition, Activity Tracking |
| Platform | iOS, Android, Others |
| Device Type | Wearable Devices, Tablets, Smartphones |
| Regions Covered | West, South, Northeast, Midwest |
| Key Players Profiled | Aaptiv, Adidas, Appinventiv, Applico, Appster, Azumio, Inc. |
| Additional Attributes | Dollar sales by type, platform, device type, and regional trends with a focus on wearable devices, mobile apps, and fitness sectors. Demand is driven by rising health awareness, increasing mobile usage, and the growth of digital fitness platforms. |
The global demand for fitness apps in USA is estimated to be valued at USD 2.6 billion in 2025.
The market size for the demand for fitness apps in USA is projected to reach USD 7.9 billion by 2035.
The demand for fitness apps in USA is expected to grow at a 11.9% CAGR between 2025 and 2035.
The key product types in demand for fitness apps in USA are exercise & weight loss, diet & nutrition and activity tracking.
In terms of platform, ios segment to command 48.8% share in the demand for fitness apps in USA in 2025.


Our Research Products

The "Full Research Suite" delivers actionable market intel, deep dives on markets or technologies, so clients act faster, cut risk, and unlock growth.

The Leaderboard benchmarks and ranks top vendors, classifying them as Established Leaders, Leading Challengers, or Disruptors & Challengers.

Locates where complements amplify value and substitutes erode it, forecasting net impact by horizon

We deliver granular, decision-grade intel: market sizing, 5-year forecasts, pricing, adoption, usage, revenue, and operational KPIs—plus competitor tracking, regulation, and value chains—across 60 countries broadly.

Spot the shifts before they hit your P&L. We track inflection points, adoption curves, pricing moves, and ecosystem plays to show where demand is heading, why it is changing, and what to do next across high-growth markets and disruptive tech

Real-time reads of user behavior. We track shifting priorities, perceptions of today’s and next-gen services, and provider experience, then pace how fast tech moves from trial to adoption, blending buyer, consumer, and channel inputs with social signals (#WhySwitch, #UX).

Partner with our analyst team to build a custom report designed around your business priorities. From analysing market trends to assessing competitors or crafting bespoke datasets, we tailor insights to your needs.
Supplier Intelligence
Discovery & Profiling
Capacity & Footprint
Performance & Risk
Compliance & Governance
Commercial Readiness
Who Supplies Whom
Scorecards & Shortlists
Playbooks & Docs
Category Intelligence
Definition & Scope
Demand & Use Cases
Cost Drivers
Market Structure
Supply Chain Map
Trade & Policy
Operating Norms
Deliverables
Buyer Intelligence
Account Basics
Spend & Scope
Procurement Model
Vendor Requirements
Terms & Policies
Entry Strategy
Pain Points & Triggers
Outputs
Pricing Analysis
Benchmarks
Trends
Should-Cost
Indexation
Landed Cost
Commercial Terms
Deliverables
Brand Analysis
Positioning & Value Prop
Share & Presence
Customer Evidence
Go-to-Market
Digital & Reputation
Compliance & Trust
KPIs & Gaps
Outputs
Full Research Suite comprises of:
Market outlook & trends analysis
Interviews & case studies
Strategic recommendations
Vendor profiles & capabilities analysis
5-year forecasts
8 regions and 60+ country-level data splits
Market segment data splits
12 months of continuous data updates
DELIVERED AS:
PDF EXCEL ONLINE
Fitness Apps Market Report - Trends & Forecast 2025 to 2035
Demand for Fitness Apps in Japan Size and Share Forecast Outlook 2025 to 2035
USA Medical Coding Market Size and Share Forecast Outlook 2025 to 2035
USA Labels Market Size and Share Forecast Outlook 2025 to 2035
USA Plant-based Creamers Market Size and Share Forecast Outlook 2025 to 2035
USA Barrier Coated Paper Market Size and Share Forecast Outlook 2025 to 2035
USA Electronic Health Records (EHR) Market Size and Share Forecast Outlook 2025 to 2035
USA Animal Model Market Size and Share Forecast Outlook 2025 to 2035
USA and Canada Packer Bottle Market Size and Share Forecast Outlook 2025 to 2035
USA Stretch Hood Films Market Size and Share Forecast Outlook 2025 to 2035
USA and Canada Fence Screen Market Size and Share Forecast Outlook 2025 to 2035
Global Fitness Recovery Services Market Analysis Size and Share Forecast Outlook 2025 to 2035
USA Lubricant Contaminated HDPE Container Waste Market Size and Share Forecast Outlook 2025 to 2035
USA Commercial Walk-In Refrigeration Market Size and Share Forecast Outlook 2025 to 2035
USA & Canada Pre-painted Steel Roofing and Cladding Market Size and Share Forecast Outlook 2025 to 2035
USA Residential Cotton Candy Maker Market Size and Share Forecast Outlook 2025 to 2035
USA Faith Based Tourism Market Size and Share Forecast Outlook 2025 to 2035
United States NFC Lemon Juice Market Analysis - Size, Growth and Forecast 2025 to 2035
USA and Canada Copper Market Insights - Demand, Size & Industry Trends 2025 to 2035
USA Ground and Precipitated Calcium Carbonate Market Growth by Product Type, Application, End-Use, and Region in 2025 to 2035

Thank you!
You will receive an email from our Business Development Manager. Please be sure to check your SPAM/JUNK folder too.
Chat With
MaRIA