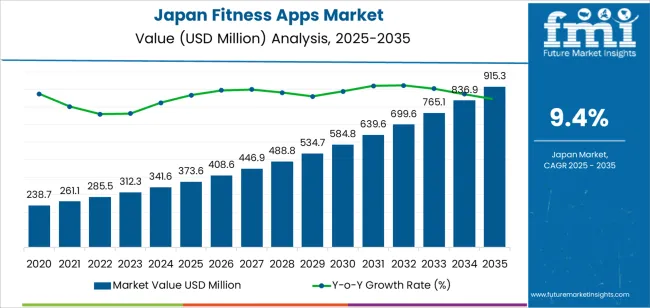
The Japan fitness apps demand is valued at USD 373.6 million in 2025 and is estimated to reach USD 915.3 million by 2035, supported by a CAGR of 9.4%. Demand is influenced by increased use of mobile-based health tools, steady interest in structured exercise programs, and wider availability of personalised digital coaching. Fitness applications support daily activity tracking, guided workouts, and nutritional monitoring, which aligns with rising engagement in home-based and hybrid exercise routines. Broader smartphone penetration and consistent app-store distribution also facilitate adoption across different age groups.
Exercise and weight-loss applications form the leading type. These platforms provide guided training modules, calorie-tracking features, and progressive workout plans that help users follow structured routines. Their use of adaptive difficulty settings and multimedia instructions supports steady uptake among individuals seeking practical exercise formats without specialised equipment. Integration with wearable devices further extends their functionality by enabling continuous monitoring of activity and vital-sign metrics.
Kyushu & Okinawa, Kanto, and Kinki register the highest demand. These regions have concentrated urban populations, established broadband access, and significant participation in lifestyle-oriented digital services. Their retail and commercial ecosystems also support partnerships between app developers, fitness studios, and wellness providers, contributing to broader user acquisition. Aaptiv, Adidas, Appinventiv, Applico, Appster, and Azumio, Inc. are the principal suppliers. Their portfolios include subscription-based training applications, AI-enabled wellness tools, and mobile platforms designed for cardiovascular workouts, strength routines, and behavioural health tracking.
Peak-to-trough analysis indicates a pronounced early peak between 2026 and 2029 as adoption expands across urban users, corporate-wellness programmes, and health-monitoring communities. This period benefits from rising smartphone penetration, greater interest in personalised workout plans, and wider integration of app-based tracking with wearables. Subscription models, data-driven coaching, and hybrid digital-fitness services reinforce this early uplift, giving the segment strong upward momentum.
A moderate trough is likely between 2030 and 2032 as usage patterns stabilise and competition intensifies among domestic and international app developers. During this phase, users consolidate around established platforms, and growth becomes tied to incremental feature upgrades rather than broad new-user expansion. Procurement by enterprises and insurers also follows more predictable renewal cycles. After 2032, the segment begins a measured recovery driven by improved biometric-tracking accuracy, expanded language-localised content, and deeper integration with sleep, nutrition, and mental-wellness modules. The peak-to-trough structure reflects a transition from rapid early adoption to a more mature, retention-focused phase shaped by consistent digital-health engagement across Japan’s consumer base.
| Metric | Value |
|---|---|
| Japan Fitness Apps Sales Value (2025) | USD 373.6 million |
| Japan Fitness Apps Forecast Value (2035) | USD 915.3 million |
| Japan Fitness Apps Forecast CAGR (2025-2035) | 9.4% |
Demand for fitness apps in Japan is increasing as more consumers seek convenient, digital solutions for health, exercise and wellness tracking. High smartphone penetration and broad use of wearable devices provide a strong foundation for growth. Japanese users place value on apps that deliver personalised workout plans, voice coaching in Japanese, and integration with local fitness culture. The trend toward home-based training and on-demand fitness content supports app uptake among both working adults and older age groups.
Corporate wellness programmes and subscription-based models further expand the addressable industry. Constraints include data privacy concerns among some users, cultural expectations for in-person training and gym membership, and fragmentation among apps in terms of quality and language support. Some developers may face difficulty sustaining user engagement over time due to competition and user attrition.
Demand for fitness apps in Japan reflects user interest in exercise guidance, nutrition planning, and activity monitoring across mobile and wearable devices. Adoption patterns vary with personal health goals, preferred operating systems, and device ecosystems. Type preferences correspond to structured workout support, calorie tracking, and daily movement monitoring. Platform distribution highlights user behaviour across iOS, Android, and alternative systems. Device-type patterns show how consumers interact with health data, notifications, and tracking interfaces.
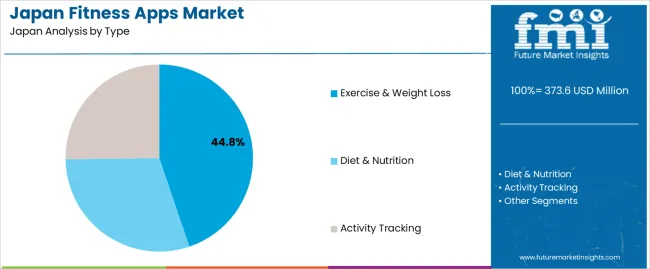
Exercise and weight-loss applications hold 44.8% of national demand and represent the leading type category. Users rely on guided workouts, progress tracking, and personalised training modules to support structured fitness routines. Diet and nutrition apps represent 30.0%, offering calorie monitoring, meal planning, and nutrient analysis tools. Activity-tracking apps hold 25.2%, supporting users who monitor steps, heart rate, movement patterns, and lifestyle indicators. Type distribution reflects varying user goals, ease of digital engagement, and the need for targeted support across fitness, dietary control, and daily activity management within Japan’s wellness ecosystem.
Key drivers and attributes:
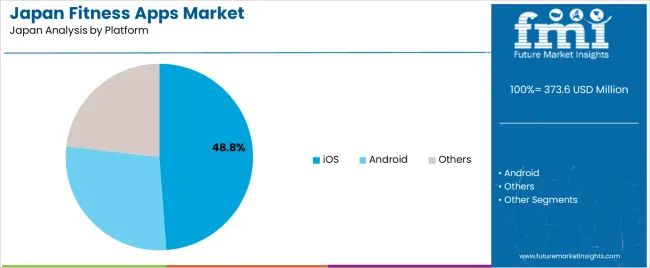
iOS holds 48.8% of national demand and represents the dominant platform for fitness app usage. Consistent device performance, integrated health frameworks, and widespread use of premium fitness apps contribute to strong adoption. Android represents 28.0%, supporting diverse device options and budget-friendly user segments. Other platforms hold 23.2%, including web-based interfaces, smartwatch-native systems, and cross-platform fitness services. Platform distribution reflects device ownership trends, app-store ecosystems, and user preferences for interface stability and data synchronisation across Japan’s digital health environment.
Key drivers and attributes:
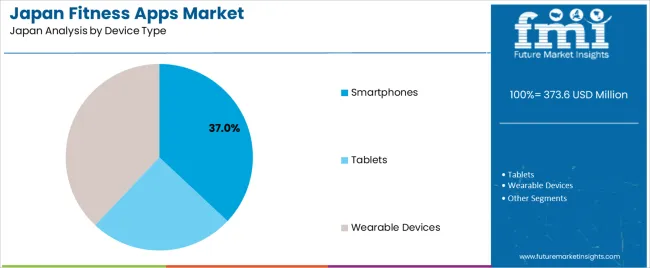
Wearable devices hold 38.0% of national demand and represent the leading device type for fitness application use. Continuous data capture allows monitoring of heart rate, sleep cycles, distance walked, and routine activity patterns. Smartphones represent 37.0%, supporting app-based tracking, notifications, and metric logging across daily activities. Tablets hold 25.0%, used mainly for viewing analytics, running full-screen workout sessions, or accessing guided programmes. Device-type distribution reflects consumer engagement with health metrics, convenience of continuous monitoring, and the integration of fitness data into daily routines across Japan’s digital health landscape.
Key drivers and attributes:
Growing health awareness, high smartphone and wearable penetration, and flexible workout preferences are driving demand.
In Japan, demand for fitness apps is increasing as consumers place greater value on maintaining health, fitness and wellness especially amid an ageing population and busy urban lifestyles. Smartphones and wearables are widely adopted, enabling fitness apps to integrate activity tracking, heart rate monitoring and workout guidance seamlessly. The convenience of digital workouts at home or on the go appeals to users who may have limited time or prefer flexible routines rather than gym membership alone. App developers offering Japanese-language content, culturally relevant exercise programmes and integration with local wearables further support uptake across demographics.
User engagement challenges, privacy concerns and competition from offline services restrain growth.
Even when downloads are high, many fitness apps struggle with sustained user engagement; users may download an app but discontinue active use within weeks. Data privacy and security are important considerations in the Japanese industry, and concerns about tracking personal health data can hinder full adoption. Traditional offline fitness services, such as gyms, boutique studios and corporate wellness programmes continue to compete strongly, which may limit shift to purely digital formats.
Personalisation via AI, hybrid home/onsite workout models, and gamified/social features define key trends.
Fitness apps in Japan are evolving to include AI-driven personalization, tailoring workouts, tracking progress and offering adaptive plans based on user behaviour and sensor data. Hybrid models that combine app-based training with occasional in-studio or group sessions are gaining popularity, blending digital convenience with social motivation. Gamification, social sharing, challenges and community features are becoming stronger, supporting user retention and motivation. Despite maturation in core industries, there remains opportunity in addressing older age segments, specialised wellness (mobility, rehabilitation) and multilingual tourism-related fitness offerings.
Demand for fitness apps in Japan is rising through 2035 as consumers adopt digital tools for exercise tracking, guided workouts, weight management, and wellness monitoring. Growth is influenced by expanded smartphone penetration, increased use of wearables, and stronger interest in hybrid fitness models combining online coaching with in-person activity. Localized app features, such as diet tracking aligned with Japanese eating patterns, stress-monitoring functions, and home-workout programssupport adoption across diverse age groups. Corporate-wellness participation and regional health campaigns also strengthen usage. Kyushu & Okinawa leads with 11.7%, followed by Kanto (10.8%), Kinki (9.5%), Chubu (8.3%), Tohoku (7.3%), and the Rest of Japan (6.9%).
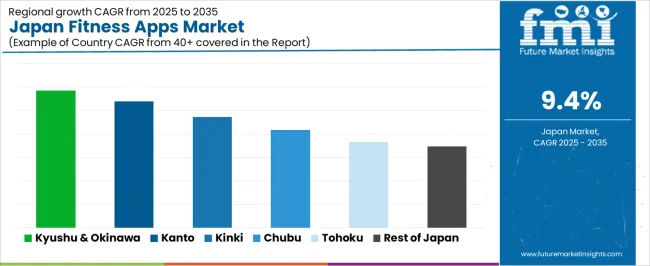
| Region | CAGR (2025-2035) |
|---|---|
| Kyushu & Okinawa | 11.7% |
| Kanto | 10.8% |
| Kinki | 9.5% |
| Chubu | 8.3% |
| Tohoku | 7.3% |
| Rest of Japan | 6.9% |
Kyushu & Okinawa grow at 11.7% CAGR, supported by strong consumer interest in accessible digital wellness tools, increasing participation in outdoor activities, and expanding smartphone usage across urban and regional communities. Fitness apps offering guided walking, bodyweight routines, and beginner-friendly programs see rapid adoption due to the region’s diverse user base. Local gyms and wellness centers integrate app-based scheduling, progress tracking, and remote-training modules that encourage consistent engagement. Tourism areas with active lifestyles contribute to demand for step-tracking and activity-monitoring applications. Regional health programs promoting preventive care also encourage residents to adopt digital fitness solutions for daily monitoring and goal setting.
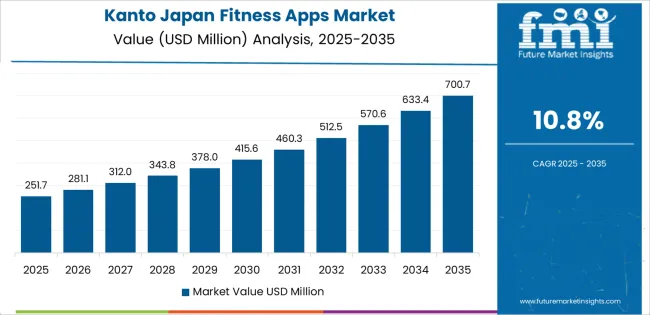
Kanto grows at 10.8% CAGR, driven by dense urban populations, high smartphone penetration, and strong engagement with digital wellness platforms across Tokyo, Kanagawa, and Saitama. Busy professionals rely on app-based exercise routines that fit into short schedules, including HIIT, mobility, and stretching programs. Gyms and boutique studios integrate app features for class booking, performance tracking, and virtual coaching. Wearable-device adoption is high, supporting synchronization with fitness apps for heart-rate monitoring and daily-activity analysis. Urban consumers show strong interest in diet-logging, step-tracking, and sleep-analysis tools. Corporations in metropolitan areas expand wellness initiatives that include app-based participation incentives.
Kinki grows at 9.5% CAGR, supported by active urban lifestyles and steady adoption of digital health technologies across Osaka, Kyoto, and Hyogo. Fitness apps offering structured workout plans, calorie-tracking tools, and personalized suggestions appeal to diverse users balancing work and wellness. Gyms use app-based systems to support class scheduling and individualized progress management. Wearables linked to fitness apps help users monitor training intensity and recovery. Cultural interest in walking, running, and light fitness routines aligns with app-based tracking and coaching features. Universities and corporate campuses broaden engagement by promoting app-based health-improvement initiatives.
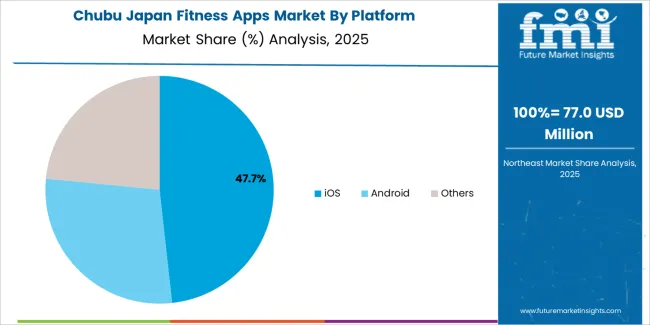
Chubu grows at 8.3% CAGR, shaped by rising interest in home-based exercise, growing online-coaching availability, and steady smartphone adoption across Aichi, Shizuoka, and Gifu. Fitness apps supporting low-equipment routines, step-tracking, and weight-management tools appeal to users seeking convenience outside traditional gym settings. Manufacturers and large employers in the region integrate wellness apps into employee-health programs. Wearable devices linked to fitness platforms help users track daily activity during commutes and workplace routines. Younger populations show interest in app-based training challenges and community features that encourage consistent engagement.
Tohoku grows at 7.3% CAGR, supported by increasing awareness of digital wellness benefits, interest in preventive healthcare, and growing engagement with mobile fitness tools across Miyagi, Fukushima, and Akita. Users adopt fitness apps for structured walking programs, stretching routines, and personalized health tracking suited to regional lifestyle patterns. Local employers and community organizations incorporate digital fitness initiatives that encourage regular activity. Wearable devices are becoming more common, enabling integration with exercise-tracking apps. Although overall digital adoption is slower than in metropolitan regions, steady interest in health-improvement tools maintains consistent growth.
The Rest of Japan grows at 6.9% CAGR, supported by moderate smartphone adoption, gradual interest in home-based exercise, and expanding participation in digital wellness programs. Users rely on fitness apps for simple routines including mobility sessions, guided walking, and goal-tracking features. Gyms in smaller cities introduce app-based tools for membership management and class scheduling. Regional health agencies promote digital wellness campaigns that encourage daily activity tracking. Adoption remains slower due to population dispersion, but sustained interest in accessible, low-cost fitness tools ensures ongoing demand.
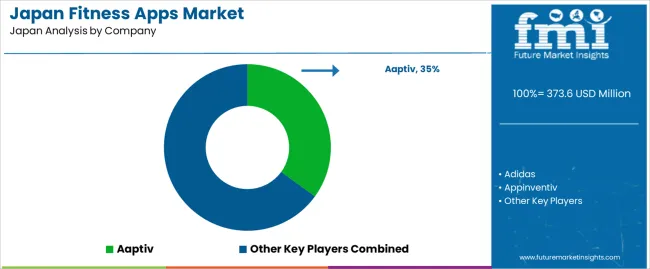
Demand for fitness apps in Japan is shaped by a group of digital-wellness developers serving users seeking structured workouts, activity tracking, and guided training across mobile and connected devices. Aaptiv holds the leading position with an estimated 35.0% share, supported by its library of audio- and video-based training sessions, consistent user-interface stability, and long-standing adoption among individuals seeking structured home and gym workouts. Its position is reinforced by dependable content updates and predictable performance across iOS and Android platforms.
Adidas and Azumio, Inc. follow as significant participants. Adidas provides app-based training programmes with controlled progression structures and steady engagement tools suited to cardio, strength, and conditioning routines. Azumio contributes validated tracking features, nutritional logging, and activity-monitoring functions aligned with health-management patterns common among Japanese users. Appinventiv and Applico maintain roles as technology partners that support custom fitness-app development for wellness brands and gym networks, supplying stable backend architectures and consistent UX frameworks. Appster adds capability through design-driven fitness-app builds suited to niche training categories and wellness platforms.
Competition across this segment centres on content quality, tracking accuracy, user-engagement consistency, integration with wearables, and app stability under daily use. Demand continues to grow as Japanese consumers prioritise guided home workouts, personalised training paths, and mobile health tools that deliver reliable performance and straightforward progression monitoring across diverse fitness levels.
| Items | Values |
|---|---|
| Quantitative Units | USD million |
| Type | Exercise & Weight Loss, Diet & Nutrition, Activity Tracking |
| Platform | iOS, Android, Others |
| Device Type | Smartphones, Tablets, Wearable Devices |
| Regions Covered | Kyushu & Okinawa, Kanto, Kinki, Chubu, Tohoku, Rest of Japan |
| Key Companies Profiled | Aaptiv, Adidas, Appinventiv, Applico, Appster, Azumio, Inc. |
| Additional Attributes | Dollar sales by app type, platform, and device category; regional adoption trends across Kyushu & Okinawa, Kanto, Kinki, Chubu, Tohoku, and Rest of Japan; competitive landscape of fitness and wellness app developers; advancements in AI-driven workout plans, nutrition tracking, and wearable device integration; integration with gyms, home fitness routines, corporate wellness programs, and personalised health monitoring across Japan. |
The demand for fitness apps in Japan is estimated to be valued at USD 373.6 million in 2025.
The market size for the fitness apps in Japan is projected to reach USD 915.3 million by 2035.
The demand for fitness apps in Japan is expected to grow at a 9.4% CAGR between 2025 and 2035.
The key product types in fitness apps in Japan are exercise & weight loss, diet & nutrition and activity tracking.
In terms of platform, ios segment is expected to command 48.8% share in the fitness apps in Japan in 2025.


Our Research Products

The "Full Research Suite" delivers actionable market intel, deep dives on markets or technologies, so clients act faster, cut risk, and unlock growth.

The Leaderboard benchmarks and ranks top vendors, classifying them as Established Leaders, Leading Challengers, or Disruptors & Challengers.

Locates where complements amplify value and substitutes erode it, forecasting net impact by horizon

We deliver granular, decision-grade intel: market sizing, 5-year forecasts, pricing, adoption, usage, revenue, and operational KPIs—plus competitor tracking, regulation, and value chains—across 60 countries broadly.

Spot the shifts before they hit your P&L. We track inflection points, adoption curves, pricing moves, and ecosystem plays to show where demand is heading, why it is changing, and what to do next across high-growth markets and disruptive tech

Real-time reads of user behavior. We track shifting priorities, perceptions of today’s and next-gen services, and provider experience, then pace how fast tech moves from trial to adoption, blending buyer, consumer, and channel inputs with social signals (#WhySwitch, #UX).

Partner with our analyst team to build a custom report designed around your business priorities. From analysing market trends to assessing competitors or crafting bespoke datasets, we tailor insights to your needs.
Supplier Intelligence
Discovery & Profiling
Capacity & Footprint
Performance & Risk
Compliance & Governance
Commercial Readiness
Who Supplies Whom
Scorecards & Shortlists
Playbooks & Docs
Category Intelligence
Definition & Scope
Demand & Use Cases
Cost Drivers
Market Structure
Supply Chain Map
Trade & Policy
Operating Norms
Deliverables
Buyer Intelligence
Account Basics
Spend & Scope
Procurement Model
Vendor Requirements
Terms & Policies
Entry Strategy
Pain Points & Triggers
Outputs
Pricing Analysis
Benchmarks
Trends
Should-Cost
Indexation
Landed Cost
Commercial Terms
Deliverables
Brand Analysis
Positioning & Value Prop
Share & Presence
Customer Evidence
Go-to-Market
Digital & Reputation
Compliance & Trust
KPIs & Gaps
Outputs
Full Research Suite comprises of:
Market outlook & trends analysis
Interviews & case studies
Strategic recommendations
Vendor profiles & capabilities analysis
5-year forecasts
8 regions and 60+ country-level data splits
Market segment data splits
12 months of continuous data updates
DELIVERED AS:
PDF EXCEL ONLINE
Demand Signal Repository Solutions Market Size and Share Forecast Outlook 2025 to 2035
Demand Side Management Market Size and Share Forecast Outlook 2025 to 2035
Demand Response Market Analysis - Size, Share, and Forecast Outlook 2025 to 2035
North America Shipping Supplies Market Trends – Innovations & Growth 2024-2034
Demand of Kozani Saffron in Greece Analysis - Size, Share & Forecast 2025 to 2035
Demand of No-acid Whey Strained Dairy Processing Concepts in European Union Size and Share Forecast Outlook 2025 to 2035
Demand for Bronte Pistachio in Italy Analysis - Size, Share & Forecast 2025 to 2035
Demand and Trend Analysis of Gaming Monitor in Western Europe Size and Share Forecast Outlook 2025 to 2035
Demand and Trend Analysis of Gaming Monitor in Korea Size and Share Forecast Outlook 2025 to 2035
Demand and Trend Analysis of Gaming Monitor in Japan Size and Share Forecast Outlook 2025 to 2035
Glycine Soja (Soybean) Seed Extract Market Size and Share Forecast Outlook 2025 to 2035
Demand and Trend Analysis of Yeast in Japan - Size, Share, and Forecast Outlook 2025 to 2035
Demand of Pistachio-based desserts & ingredients in France Analysis - Size, Share & Forecast 2025 to 2035
Western Europe Men’s Skincare Market Analysis – Forecast 2023-2033
Demand and Trends Analysis of Stevia in Japan Size and Share Forecast Outlook 2025 to 2035
Japan Women’s Intimate Care Market Trends – Growth & Forecast 2024-2034
Demand and Trend Analysis of Fabric Stain Remover in Korea Size and Share Forecast Outlook 2025 to 2035
Demand and Sales Analysis of Paper Cup in Korea Size and Share Forecast Outlook 2025 to 2035
Demand and Sales Analysis of Paper Cup in Western Europe Size and Share Forecast Outlook 2025 to 2035
Demand of MFGM-enriched Powders & RTDs in European Union Size and Share Forecast Outlook 2025 to 2035

Thank you!
You will receive an email from our Business Development Manager. Please be sure to check your SPAM/JUNK folder too.
Chat With
MaRIA