Veterinary Ultrasound Scanner Market Size and Share Forecast Outlook 2025 to 2035

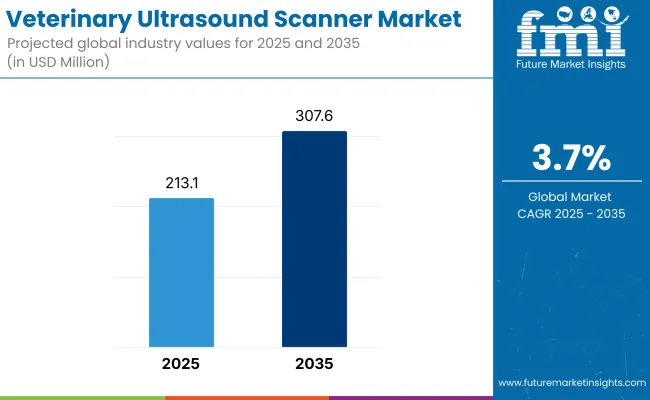
The Veterinary Ultrasound Scanner Market is estimated to reach USD 213.1 million by 2025. Between 2025 and 2035, the market is expected to grow at a CAGR of 3.7% reaching a total value of USD 307.6 million by the end of the assessment period.
Quick Stats for Veterinary Ultrasound Scanner Market

  • Industry Value (2025): USD 213.1 million
  • Forecast Value (2035): USD 307.6 million
  • Forecast CAGR: 3.7%
  • Leading Segment in 2025: Portable/Handheld Ultrasound Scanners
  • Key Growth Region: North America, Asia-Pacific (notably China and India)
  • Top Key Players: Mindray Medical International Limited, GE Healthcare, FUJIFILM Sonosite, Esaote SPA, Siemens Medical Solutions USA, Inc., Diagnostic Imaging Systems, Inc., Shenzhen Ricso Technology Co., Ltd.Heska Corporation, E.I. Medical Imaging, Promed Technology Co., Ltd, IMV Technologies SA,
Metric Value
Industry Size (2025E) USD 213.1 million
Industry Value (2035F) USD 307.6 million
CAGR (2025 to 2035) 3.7%

The veterinary ultrasound scanner market is witnessing sustained growth as veterinary practices increasingly prioritize advanced diagnostic imaging to improve animal care outcomes. The market is driven by rising pet ownership, growing awareness of preventive care in companion animals, and the expansion of livestock management practices emphasizing herd health monitoring.

Digital transformation across veterinary clinics has also influenced purchasing decisions, with more practices adopting portable and high-resolution imaging systems to enable faster diagnoses and better workflow efficiency.

Manufacturers have responded by investing in product innovation, integrating features such as wireless connectivity, touch-screen interfaces, and cloud-based image storage. Regulatory frameworks have remained supportive of technological upgrades, with standards evolving to encourage adoption of equipment aligned with modern data management practices.
Analyzing Veterinary Ultrasound Scanner Market by Top Investment Segments

Portable/Hand Held Ultrasound Scanners Leading the Product Segment

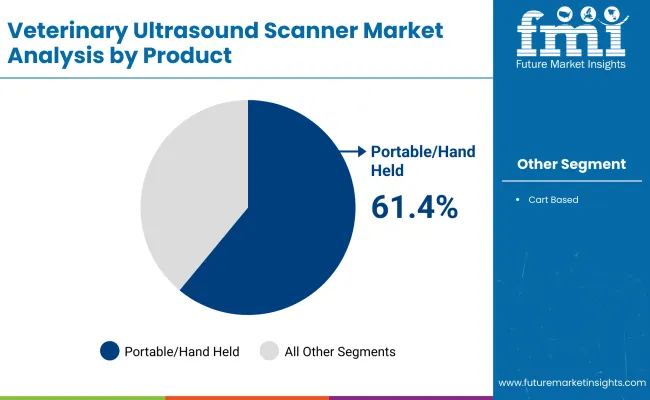
In 2025, portable and handheld ultrasound scanners are anticipated to hold a 61.4% revenue share in the veterinary ultrasound scanner market. This dominance has been driven by the growing need for flexible, point-of-care imaging that supports both field-based and in-clinic applications.

Veterinary practitioners have increasingly favored portable systems due to their ease of transport, rapid setup times, and ability to deliver real-time assessments in diverse animal health settings. Advances in miniaturization and battery life have further improved the usability and reliability of handheld devices, while wireless data transfer capabilities have streamlined integration into clinic record systems. Favorable clinician feedback regarding ergonomic design and workflow benefits has reinforced confidence in portable scanners as a first-line diagnostic solution.
Digital Imaging Technology as the Preferred Imaging Technology

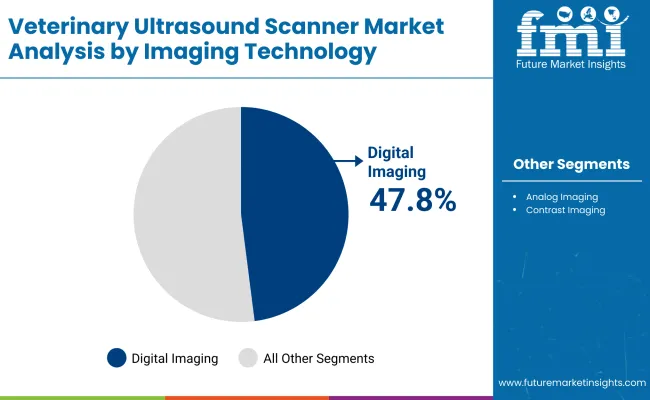
Digital imaging technology is projected to account for 47.8% of the market share in 2025. The segment’s leadership has been underpinned by its ability to provide superior image resolution, enhanced diagnostic accuracy, and efficient data storage compared to conventional analog systems.

Veterinary clinics have prioritized digital solutions to meet the demands of higher throughput and to improve communication with pet owners through clearer visual documentation. Integration of digital platforms with practice management software has further strengthened adoption by enabling seamless reporting and image archiving. Continuous improvements in transducer design and image processing algorithms have also contributed to clinical confidence in digital imaging.

Challenges and Opportunities

Challenges

High Initial Investment and Maintenance Costs Associated with Advanced Ultrasound Scanners Could be the Key Barrier in the Veterinary Ultrasound Scanner Market

High initial investment & maintenance costs of advanced ultrasound scanners are one of the major challenges faced. Portable and handheld units have lower prices, but high-end machines and resulting imaging capabilities are still costly. For many small and independent veterinary clinics, budget constraints make this approach difficult to adopt. Access to funding & financial support is less in developing regions, and the cost factor impacts veterinary practices there as well.

The other major challenge is the deficit of trained manpower in ultrasound imaging. In human healthcare, radiology is a trained field, but many veterinarians are left to their own devices when it comes to using imaging machines. In certain areas, where formal training programs do not exist, this can result in variability in the accuracy of diagnosis as well as suboptimal use of ultrasound technology.

This poses a direct challenge to the efficacy of veterinary imaging and limits its availability for application across the board.

Moreover, there are differences in regulatory requirements and compliance across regions, which make device approval and distribution more complex. This is especially true in countries with strict import regulations or burdensome certification processes, which can delay the introduction of state-of-the-art ultrasound scanners to the industry.

Technological limitations constitute another barrier with regard to some ultrasound devices, especially low-cost models. Imaging resolution that is not consistent, a limited probe in your hand, and poor compatibility with other diagnostic tools all lead to less effective veterinary diagnostics.

This results in reluctance among Veterinary professionals to adopt new ultrasound solutions. Also, to make it possible will require greater investment into training, affordability, better streamlining of regulation, as well as continued improvement of imaging technology, all of which can expand access to better veterinary diagnostics.

Opportunities

Advancement in Battery-powered and Ultra-Portable Ultrasound Scanners Creating Opportunity for the Market

Innovation and accessibility evolution in the veterinary ultrasound scanner industry. One major opportunity is in the development of AI-supported imaging interpretation.” Ultrasound images are complex, and many veterinarians have difficulty diagnosing conditions. Combining smart imaging software that offers rapid review and automated outlier detection, weaves ultrasound technology into the everyday practice of veterinarians with differing experience levels, ultimately improving diagnostic accuracy and workflow efficiency.

An added area of great opportunity is the growing need for multi-species ultrasound solutions. Ultrasound technology is well-established in small animal and livestock care, but interest is growing in its applications for exotic animals, marine life, and wildlife conservation. Custom approaches will allow for scanners with specialized probes and additional imaging abilities for wildlife, along with pets and livestock, as far as veterinary diagnostics extends.

The development of battery-operated nail tip forms and portable ultrasound scanners is also providing new options, particularly for field veterinarians and those working in more remote locations. Classically trained mobile ultrasound solution for on-site diagnostics is very useful for regions without fully equipped veterinary facilities. These compact, rugged, and wireless devices improve veterinary outreach programs and emergency treatment of large and mobile animals.

Plus, the integration of telemedicine in the veterinary diagnostic process is changing how ultrasound technology is used. Vet specialists who tackle ultrasound images are further away from them; for vet professionals, the need for human contact is still an aspect, as they help to diagnose the actual issues for their patients (animals) as well. These are international innovations that position ultrasound technology as a particularly valuable tool in the future of veterinary care.
Country-Wise Analysis

United States

Market Outlook

The veterinary ultrasound scanner market in the United States is growing due to a well-established veterinary healthcare system and high spending on pet wellness. One of the key growth-driving factors is the increasing number of specialty veterinary hospitals and referral centers.

These centers have the latest imaging technology, from high-resolution ultrasound scanners capable of accurate diagnosis, to complex medical solutions; Meanwhile, advances in ultrasound technology, as well as the increased availability of veterinary insurance that covers the costs of many diagnostic procedures, have made it easier (and less costly) for pet owners to opt for more advanced diagnostics, and ultrasound has become both a routine and emergency diagnostic tool.

Moreover, the presence of key players in the imaging technology space provides a continuous flow of product innovations, helping the veterinary ultrasound solutions to be more widely adopted, ultimately making a difference in terms of accessibility and efficiency.

Market Growth Factors

  • Growth of Specialty Veterinary Centers - The growing number of high-end veterinary hospitals and referral clinics has contributed to the adoption of high-resolution ultrasound scanners for specialty diagnostics.
  • Good Insurance Coverage - A large percentage of pet owners use insurance, allowing for high-quality diagnostic procedures, such as ultrasound imaging, to be more attainable.
  • High Demand for Emergency and Critical Care - The increase in 24/7 veterinary emergency facilities requires real-time and accurate diagnostic tools, propelling the use of ultrasound technology.
  • Advances by Leading Manufacturers in Imaging Equipment - Some of the biggest names in veterinary imaging manufacturers are found in the United States, ensuring their ultrasound technology is always on the cutting edge.
  • Increased Pet Owner Demands - A growing segment of the public is choosing to keep birds, reptiles, and small mammals as pets, increasing demand for advanced applications in ultrasound for species-specific diagnostics.

Market Forecast

Country CAGR (2025 to 2035)
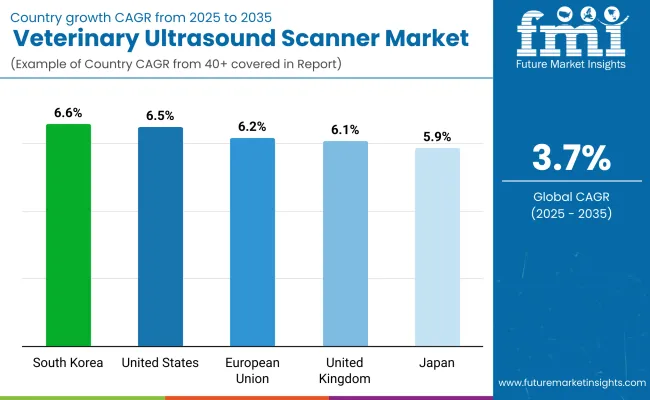
United States 2.2%

Germany

Market Outlook

Germany’s veterinary ultrasound market is booming due to the country’s focus on precision diagnostics and high standards of animal care. The sound veterinary education system guarantees that specialists are trained in modern methods of diagnosis, which in turn is followed by a wider use of ultrasound imaging in everyday life.

Germany’s livestock sector is also well-trained on ultrasound technologies, which are able to help herds ensure managed health and breeding programs. The evolution and accessibility of state-of-the-art ultrasound equipment are also facilitated by regulatory environments encouraging innovation in veterinary medical devices.

The veterinary imaging field continues to grow with advancements that enhance diagnostic accuracy, thanks to the country’s focus on research in the area of animal healthcare.

Market Growth Factors

  • Universal Healthcare System Coverage - A systematic healthcare system provides comprehensive or partial coverage of dialysis treatments, making them more affordable for patients.
  • Hospital Decongestion - The trend toward outpatient dialysis centers is relieving hospitals from the workload and demanding effective dialysis technologies.
  • Hemodiafiltration Developments - Germany is at the forefront in using high-efficiency dialysis technologies that are effective in removing toxins and improving patients' comfort levels.
  • Robust Industry-Academic Partnerships - Universities and research organizations are directly involved in developing innovative dialysis solutions.
  • Regulatory Stringency - Regulations of high-quality manufacturing ensure that dialysis machines and concentrates adhere to higher safety and effectiveness standards.

Market Forecast

Country CAGR (2025 to 2035)
Germany 2.0%

United Kingdom

Market Outlook

Trends in Veterinary Ultrasound in the United Kingdom Markets in October 2023. The veterinary ultrasound market in the United Kingdom is growing modestly, with the increasing demand for specialized care of companion animals as the primary growth driver. Increased interest in preventive diagnostics due to increased interest in pet wellness programs has made ultrasound another integral tool to be used to identify disease at an early stage.

In addition, there is an increasing number of mobile veterinary services that appeal to pet owners who want at-home diagnostics, thus driving the growth of portable ultrasound devices. The shift toward multidisciplinary veterinary care, which uses multiple diagnostic approaches in conjunction with one another, has also accelerated the use of ultrasound scanners in both urban and rural veterinary practices.

Market Growth Drivers

  • Growing Emphasis on Preventive Veterinary Care- Pet wellness programs are focused on early disease detection, which is anticipated to increase the adoption of ultrasound scanners.
  • Mobile Veterinary Services are on the rise. Increasing demand for in-home vet care has led to an increase in portable ultrasound devices for diagnostics.
  • Integration of Multi-Disciplinary Veterinary Services - ImageOne Diagnostics.
  • Veterinary Facilities Opened with Government Funds - Taxpayer spending on animal health services has expanded access to modern diagnostic technology in urban and rural clinics.
  • Focus on Small Animal and Geriatric Pet Care- Pets are living longer and require more sophisticated imaging solutions to help manage aging-related disease processes, organ degeneration, and other conditions.

Market Forecast

Country CAGR (2025 to 2035)
United Kingdom 2.6%

China

Market Outlook

China’s veterinary ultrasound scanner industry is thriving, thanks to a burgeoning livestock and pet healthcare market. Ultrasound is increasingly used for reproductive management and disease prevention on modern large-scale livestock farms. Moreover, the increase of the middle-class population has led to a pet owning boom with more emphasis on veterinary healthcare services.

These ultrasound scanners are cost-efficient, providing a boost to the manufacturing of technological innovations in China, and hence, offer such equipment at a more affordable price to veterinarians in the respective countries. In addition, ultrasound imaging is now widely taught in veterinary schools, and there is a growing number of animal clinics, only further adding to the increased accessibility of ultrasound equipment.

Market Growth Drivers

  • Powering Up Livestock Farming - Commercial farms with large herds have begun to use ultrasound for herd health monitoring and reproductive management.
  • Governments are encouraging the provision of veterinary healthcare, which drives growth for animal disease control-related diagnostic imaging solutions.
  • Rising Pet Ownership in Middle-Class Households - Rising pet ownership in middle-class households is supported by rapid urbanization and increasing per capita disposable income. Local
  • Manufacturing - Domestic companies are manufacturing affordable ultrasound scanners that help make these useful tools available within the reach of vets.
  • Expansion of Veterinary Educational Programs - The number of veterinary schools and training programs that offer ultrasound imaging as part of their curriculum is increasing, thus facilitating wider adoption among emerging professionals.

Market Forecast

Country CAGR (2025 to 2035)
China 5.8%

India

Market Outlook

The increasing demand for veterinary services in rural and urban areas is driving growth for India’s veterinary ultrasound market. The relatively innovations in imaging farm and ranch animals have found a new home in government - or federally led - livestock healthcare initiatives. Portable ultrasound scanners are becoming increasingly popular, allowing vets to perform field diagnostics, especially in less accessible areas with low animal treatment facilities.

In addition, the rise in the number of veterinary colleges and training programs emphasizing modern imaging motivated the awareness and adoption of ultrasound technology. Further, as the dairy and poultry farming across the country is being organized; the need for efficient diagnostic tools has increased, especially across the veterinary ultrasound solutions landscape in the country.

Market Growth Factors

  • Pediatric Veterinary Techniques - Government-sponsored large-scale dairy and poultry programs encourage ultrasound in disease prevention and reproductive efficiency.
  • Emergence of Portable Ultrasound Scanners - In remote locations, field veterinarians regularly utilize portable battery-powered lightweight devices for diagnostics.
  • Trees and bushes were torched and thrown in a line like torches - if anyone can light them all," he explained.
  • Veterinary Skill Development and Training Initiatives - Institutions are focusing on special ultrasound training programs, which are helping in the broader adoption by veterinarians.
  • Cost-Effective Imaging Solutions - Veterinarians demand a durable and affordable ultrasound scanner that can be used from small animal clinics to large livestock farms.

Market Forecast

Country CAGR (2025 to 2035)
India 6.3%

Competitive Outlook

The veterinary ultrasound scanner market is moderately consolidated and technology-driven, fueled by demand for high-resolution, portable imaging systems across companion animal, equine, and livestock practices. Leading companies are investing in compact cart-based and handheld devices with advanced Doppler capabilities, wireless connectivity, and intuitive touch interfaces to improve diagnostic confidence and workflow efficiency.

Strategic partnerships with veterinary distributors, training initiatives, and product bundling with practice management software are central to expanding market share. Additionally, rising pet ownership, increasing expenditure on animal health, and growing adoption of point-of-care imaging are driving sustained growth globally. Emphasis on multi-species presets, battery-powered portability, and integration with cloud-based archiving is shaping competitive differentiation.

In 2024, Esaote North America launched MyLab™FOX, their latest veterinary ultrasound. Inspired by the fox, this adaptable, multi-faceted solution sets a new standard for diagnostic imaging, promising clever, fast, and intelligent scanning

Companies

  • GE Healthcare
  • FUJIFILM Sonosite
  • Esaote SPA
  • Shenzhen Mindray Bio-Medical Electronics Co., Ltd.
  • Siemens Medical Solutions USA, Inc.
  • Diagnostic Imaging Systems, Inc.
  • Shenzhen Ricso Technology Co., Ltd.
  • Heska Corporation
  • E.I. Medical Imaging
  • Promed Technology Co., Ltd
  • IMV Technologies SA
  • DRAMINSKI S.A.

Key Segments 

By Product:

Portable/Hand Held Ultrasound Scanners and Cart Based Ultrasound Scanners

By Imaging Technology:

Digital Imaging Technology, Analog Imaging Technology and Contrast Imaging Technology

By End User:

In-center Dialysis, Hospitals, Independent Dialysis Centers and Home Dialysis

By Region:

North America, Latin America, Western Europe, Eastern Europe, East Asia, South Asia & Pacific, Middle East & Africa

Table of Content

  1. Executive Summary
  2. Industry Introduction, including Taxonomy and Market Definition
  3. Market Trends and Success Factors, including Macro-Economic Factors, Market Dynamics, and Recent Industry Developments
  4. Global Market Demand Analysis 2020 to 2024 and Forecast 2025 to 2035, including Historical Analysis and Future Projections
  5. Global Market Analysis 2020 to 2024 and Forecast 2025 to 2035
    • By Product
    • By Imaging Technology
    • By End User
    • By Region
  6. Global Market Analysis 2020 to 2024 and Forecast 2025 to 2035, By Product
    • Portable/Hand Held Ultrasound Scanners
    • Cart Based Ultrasound Scanners
  7. Global Market Analysis 2020 to 2024 and Forecast 2025 to 2035, By Imaging Technology
    • Digital Imaging Technology
    • Analog Imaging Technology
    • Contrast Imaging Technology
  8. Global Market Analysis 2020 to 2024 and Forecast 2025 to 2035, By End User
    • In-center Dialysis
    • Hospitals
    • Independent Dialysis Centres
    • Home Dialysis
  9. Global Market Analysis 2020 to 2024 and Forecast 2025 to 2035, By Region
    • North America
    • Latin America
    • East Asia
    • South Asia and Pacific
    • Western Europe
    • Eastern Europe
    • Middle East and Africa
  10. North America Sales Analysis 2020 to 2024 and Forecast 2025 to 2035, By Key Segments and Countries
  11. Latin America Sales Analysis 2020 to 2024 and Forecast 2025 to 2035, By Key Segments and Countries
  12. East Asia Sales Analysis 2020 to 2024 and Forecast 2025 to 2035, By Key Segments and Countries
  13. South Asia & Pacific Sales Analysis 2020 to 2024 and Forecast 2025 to 2035, By Key Segments and Countries
  14. Western Europe Sales Analysis 2020 to 2024 and Forecast 2025 to 2035, By Key Segments and Countries
  15. Eastern Europe Sales Analysis 2020 to 2024 and Forecast 2025 to 2035, By Key Segments and Countries
  16. Middle East and Africa Sales Analysis 2020 to 2024 and Forecast 2025 to 2035, By Key Segments and Countries
  17. Sales Forecast 2025 to 2035 By Product, By Imaging Technology and By End User for 30 Countries
  18. Competition Outlook, including Market Structure Analysis, Company Share Analysis By Key Players, and Competition Dashboard
  19. Company Profile
    • Mindray Medical International Limited
    • General Electric Company
    • Fujifilm Holdings Corporation
    • Canon Inc.
    • Samsung Electronics Co. Ltd.
    • Esaote SpA
    • Hitachi Ltd.
    • Siemens AG
    • IMV Technologies SA
    • DRAMINSKI S.A.
    • Others

List of Tables

  • Table 1: Global Market Value (USD Million) Forecast by Region, 2020 to 2035
  • Table 2: Global Market Volume (Units) Forecast by Region, 2020 to 2035
  • Table 3: Global Market Value (USD Million) Forecast by Product Type, 2020 to 2035
  • Table 4: Global Market Volume (Units) Forecast by Product Type, 2020 to 2035
  • Table 5: Global Market Value (USD Million) Forecast by Imaging Technology, 2020 to 2035
  • Table 6: Global Market Volume (Units) Forecast by Imaging Technology, 2020 to 2035
  • Table 7: Global Market Value (USD Million) Forecast by End User, 2020 to 2035
  • Table 8: Global Market Volume (Units) Forecast by End User, 2020 to 2035
  • Table 9: North America Market Value (USD Million) Forecast by Country, 2020 to 2035
  • Table 10: North America Market Volume (Units) Forecast by Country, 2020 to 2035
  • Table 11: North America Market Value (USD Million) Forecast by Product Type, 2020 to 2035
  • Table 12: North America Market Volume (Units) Forecast by Product Type, 2020 to 2035
  • Table 13: North America Market Value (USD Million) Forecast by Imaging Technology, 2020 to 2035
  • Table 14: North America Market Volume (Units) Forecast by Imaging Technology, 2020 to 2035
  • Table 15: North America Market Value (USD Million) Forecast by End User, 2020 to 2035
  • Table 16: North America Market Volume (Units) Forecast by End User, 2020 to 2035
  • Table 17: Latin America Market Value (USD Million) Forecast by Country, 2020 to 2035
  • Table 18: Latin America Market Volume (Units) Forecast by Country, 2020 to 2035
  • Table 19: Latin America Market Value (USD Million) Forecast by Product Type, 2020 to 2035
  • Table 20: Latin America Market Volume (Units) Forecast by Product Type, 2020 to 2035
  • Table 21: Latin America Market Value (USD Million) Forecast by Imaging Technology, 2020 to 2035
  • Table 22: Latin America Market Volume (Units) Forecast by Imaging Technology, 2020 to 2035
  • Table 23: Latin America Market Value (USD Million) Forecast by End User, 2020 to 2035
  • Table 24: Latin America Market Volume (Units) Forecast by End User, 2020 to 2035
  • Table 25: Western Europe Market Value (USD Million) Forecast by Country, 2020 to 2035
  • Table 26: Western Europe Market Volume (Units) Forecast by Country, 2020 to 2035
  • Table 27: Western Europe Market Value (USD Million) Forecast by Product Type, 2020 to 2035
  • Table 28: Western Europe Market Volume (Units) Forecast by Product Type, 2020 to 2035
  • Table 29: Western Europe Market Value (USD Million) Forecast by Imaging Technology, 2020 to 2035
  • Table 30: Western Europe Market Volume (Units) Forecast by Imaging Technology, 2020 to 2035
  • Table 31: Western Europe Market Value (USD Million) Forecast by End User, 2020 to 2035
  • Table 32: Western Europe Market Volume (Units) Forecast by End User, 2020 to 2035
  • Table 33: Eastern Europe Market Value (USD Million) Forecast by Country, 2020 to 2035
  • Table 34: Eastern Europe Market Volume (Units) Forecast by Country, 2020 to 2035
  • Table 35: Eastern Europe Market Value (USD Million) Forecast by Product Type, 2020 to 2035
  • Table 36: Eastern Europe Market Volume (Units) Forecast by Product Type, 2020 to 2035
  • Table 37: Eastern Europe Market Value (USD Million) Forecast by Imaging Technology, 2020 to 2035
  • Table 38: Eastern Europe Market Volume (Units) Forecast by Imaging Technology, 2020 to 2035
  • Table 39: Eastern Europe Market Value (USD Million) Forecast by End User, 2020 to 2035
  • Table 40: Eastern Europe Market Volume (Units) Forecast by End User, 2020 to 2035
  • Table 41: South Asia and Pacific Market Value (USD Million) Forecast by Country, 2020 to 2035
  • Table 42: South Asia and Pacific Market Volume (Units) Forecast by Country, 2020 to 2035
  • Table 43: South Asia and Pacific Market Value (USD Million) Forecast by Product Type, 2020 to 2035
  • Table 44: South Asia and Pacific Market Volume (Units) Forecast by Product Type, 2020 to 2035
  • Table 45: South Asia and Pacific Market Value (USD Million) Forecast by Imaging Technology, 2020 to 2035
  • Table 46: South Asia and Pacific Market Volume (Units) Forecast by Imaging Technology, 2020 to 2035
  • Table 47: South Asia and Pacific Market Value (USD Million) Forecast by End User, 2020 to 2035
  • Table 48: South Asia and Pacific Market Volume (Units) Forecast by End User, 2020 to 2035
  • Table 49: East Asia Market Value (USD Million) Forecast by Country, 2020 to 2035
  • Table 50: East Asia Market Volume (Units) Forecast by Country, 2020 to 2035
  • Table 51: East Asia Market Value (USD Million) Forecast by Product Type, 2020 to 2035
  • Table 52: East Asia Market Volume (Units) Forecast by Product Type, 2020 to 2035
  • Table 53: East Asia Market Value (USD Million) Forecast by Imaging Technology, 2020 to 2035
  • Table 54: East Asia Market Volume (Units) Forecast by Imaging Technology, 2020 to 2035
  • Table 55: East Asia Market Value (USD Million) Forecast by End User, 2020 to 2035
  • Table 56: East Asia Market Volume (Units) Forecast by End User, 2020 to 2035
  • Table 57: Middle East and Africa Market Value (USD Million) Forecast by Country, 2020 to 2035
  • Table 58: Middle East and Africa Market Volume (Units) Forecast by Country, 2020 to 2035
  • Table 59: Middle East and Africa Market Value (USD Million) Forecast by Product Type, 2020 to 2035
  • Table 60: Middle East and Africa Market Volume (Units) Forecast by Product Type, 2020 to 2035
  • Table 61: Middle East and Africa Market Value (USD Million) Forecast by Imaging Technology, 2020 to 2035
  • Table 62: Middle East and Africa Market Volume (Units) Forecast by Imaging Technology, 2020 to 2035
  • Table 63: Middle East and Africa Market Value (USD Million) Forecast by End User, 2020 to 2035
  • Table 64: Middle East and Africa Market Volume (Units) Forecast by End User, 2020 to 2035

List of Figures

  • Figure 1: Global Market Value (USD Million) by Product Type, 2025 to 2035
  • Figure 2: Global Market Value (USD Million) by Imaging Technology, 2025 to 2035
  • Figure 3: Global Market Value (USD Million) by End User, 2025 to 2035
  • Figure 4: Global Market Value (USD Million) by Region, 2025 to 2035
  • Figure 5: Global Market Value (USD Million) Analysis by Region, 2020 to 2035
  • Figure 6: Global Market Volume (Units) Analysis by Region, 2020 to 2035
  • Figure 7: Global Market Value Share (%) and BPS Analysis by Region, 2025 to 2035
  • Figure 8: Global Market Y-o-Y Growth (%) Projections by Region, 2025 to 2035
  • Figure 9: Global Market Value (USD Million) Analysis by Product Type, 2020 to 2035
  • Figure 10: Global Market Volume (Units) Analysis by Product Type, 2020 to 2035
  • Figure 11: Global Market Value Share (%) and BPS Analysis by Product Type, 2025 to 2035
  • Figure 12: Global Market Y-o-Y Growth (%) Projections by Product Type, 2025 to 2035
  • Figure 13: Global Market Value (USD Million) Analysis by Imaging Technology, 2020 to 2035
  • Figure 14: Global Market Volume (Units) Analysis by Imaging Technology, 2020 to 2035
  • Figure 15: Global Market Value Share (%) and BPS Analysis by Imaging Technology, 2025 to 2035
  • Figure 16: Global Market Y-o-Y Growth (%) Projections by Imaging Technology, 2025 to 2035
  • Figure 17: Global Market Value (USD Million) Analysis by End User, 2020 to 2035
  • Figure 18: Global Market Volume (Units) Analysis by End User, 2020 to 2035
  • Figure 19: Global Market Value Share (%) and BPS Analysis by End User, 2025 to 2035
  • Figure 20: Global Market Y-o-Y Growth (%) Projections by End User, 2025 to 2035
  • Figure 21: Global Market Attractiveness by Product Type, 2025 to 2035
  • Figure 22: Global Market Attractiveness by Imaging Technology, 2025 to 2035
  • Figure 23: Global Market Attractiveness by End User, 2025 to 2035
  • Figure 24: Global Market Attractiveness by Region, 2025 to 2035
  • Figure 25: North America Market Value (USD Million) by Product Type, 2025 to 2035
  • Figure 26: North America Market Value (USD Million) by Imaging Technology, 2025 to 2035
  • Figure 27: North America Market Value (USD Million) by End User, 2025 to 2035
  • Figure 28: North America Market Value (USD Million) by Country, 2025 to 2035
  • Figure 29: North America Market Value (USD Million) Analysis by Country, 2020 to 2035
  • Figure 30: North America Market Volume (Units) Analysis by Country, 2020 to 2035
  • Figure 31: North America Market Value Share (%) and BPS Analysis by Country, 2025 to 2035
  • Figure 32: North America Market Y-o-Y Growth (%) Projections by Country, 2025 to 2035
  • Figure 33: North America Market Value (USD Million) Analysis by Product Type, 2020 to 2035
  • Figure 34: North America Market Volume (Units) Analysis by Product Type, 2020 to 2035
  • Figure 35: North America Market Value Share (%) and BPS Analysis by Product Type, 2025 to 2035
  • Figure 36: North America Market Y-o-Y Growth (%) Projections by Product Type, 2025 to 2035
  • Figure 37: North America Market Value (USD Million) Analysis by Imaging Technology, 2020 to 2035
  • Figure 38: North America Market Volume (Units) Analysis by Imaging Technology, 2020 to 2035
  • Figure 39: North America Market Value Share (%) and BPS Analysis by Imaging Technology, 2025 to 2035
  • Figure 40: North America Market Y-o-Y Growth (%) Projections by Imaging Technology, 2025 to 2035
  • Figure 41: North America Market Value (USD Million) Analysis by End User, 2020 to 2035
  • Figure 42: North America Market Volume (Units) Analysis by End User, 2020 to 2035
  • Figure 43: North America Market Value Share (%) and BPS Analysis by End User, 2025 to 2035
  • Figure 44: North America Market Y-o-Y Growth (%) Projections by End User, 2025 to 2035
  • Figure 45: North America Market Attractiveness by Product Type, 2025 to 2035
  • Figure 46: North America Market Attractiveness by Imaging Technology, 2025 to 2035
  • Figure 47: North America Market Attractiveness by End User, 2025 to 2035
  • Figure 48: North America Market Attractiveness by Country, 2025 to 2035
  • Figure 49: Latin America Market Value (USD Million) by Product Type, 2025 to 2035
  • Figure 50: Latin America Market Value (USD Million) by Imaging Technology, 2025 to 2035
  • Figure 51: Latin America Market Value (USD Million) by End User, 2025 to 2035
  • Figure 52: Latin America Market Value (USD Million) by Country, 2025 to 2035
  • Figure 53: Latin America Market Value (USD Million) Analysis by Country, 2020 to 2035
  • Figure 54: Latin America Market Volume (Units) Analysis by Country, 2020 to 2035
  • Figure 55: Latin America Market Value Share (%) and BPS Analysis by Country, 2025 to 2035
  • Figure 56: Latin America Market Y-o-Y Growth (%) Projections by Country, 2025 to 2035
  • Figure 57: Latin America Market Value (USD Million) Analysis by Product Type, 2020 to 2035
  • Figure 58: Latin America Market Volume (Units) Analysis by Product Type, 2020 to 2035
  • Figure 59: Latin America Market Value Share (%) and BPS Analysis by Product Type, 2025 to 2035
  • Figure 60: Latin America Market Y-o-Y Growth (%) Projections by Product Type, 2025 to 2035
  • Figure 61: Latin America Market Value (USD Million) Analysis by Imaging Technology, 2020 to 2035
  • Figure 62: Latin America Market Volume (Units) Analysis by Imaging Technology, 2020 to 2035
  • Figure 63: Latin America Market Value Share (%) and BPS Analysis by Imaging Technology, 2025 to 2035
  • Figure 64: Latin America Market Y-o-Y Growth (%) Projections by Imaging Technology, 2025 to 2035
  • Figure 65: Latin America Market Value (USD Million) Analysis by End User, 2020 to 2035
  • Figure 66: Latin America Market Volume (Units) Analysis by End User, 2020 to 2035
  • Figure 67: Latin America Market Value Share (%) and BPS Analysis by End User, 2025 to 2035
  • Figure 68: Latin America Market Y-o-Y Growth (%) Projections by End User, 2025 to 2035
  • Figure 69: Latin America Market Attractiveness by Product Type, 2025 to 2035
  • Figure 70: Latin America Market Attractiveness by Imaging Technology, 2025 to 2035
  • Figure 71: Latin America Market Attractiveness by End User, 2025 to 2035
  • Figure 72: Latin America Market Attractiveness by Country, 2025 to 2035
  • Figure 73: Western Europe Market Value (USD Million) by Product Type, 2025 to 2035
  • Figure 74: Western Europe Market Value (USD Million) by Imaging Technology, 2025 to 2035
  • Figure 75: Western Europe Market Value (USD Million) by End User, 2025 to 2035
  • Figure 76: Western Europe Market Value (USD Million) by Country, 2025 to 2035
  • Figure 77: Western Europe Market Value (USD Million) Analysis by Country, 2020 to 2035
  • Figure 78: Western Europe Market Volume (Units) Analysis by Country, 2020 to 2035
  • Figure 79: Western Europe Market Value Share (%) and BPS Analysis by Country, 2025 to 2035
  • Figure 80: Western Europe Market Y-o-Y Growth (%) Projections by Country, 2025 to 2035
  • Figure 81: Western Europe Market Value (USD Million) Analysis by Product Type, 2020 to 2035
  • Figure 82: Western Europe Market Volume (Units) Analysis by Product Type, 2020 to 2035
  • Figure 83: Western Europe Market Value Share (%) and BPS Analysis by Product Type, 2025 to 2035
  • Figure 84: Western Europe Market Y-o-Y Growth (%) Projections by Product Type, 2025 to 2035
  • Figure 85: Western Europe Market Value (USD Million) Analysis by Imaging Technology, 2020 to 2035
  • Figure 86: Western Europe Market Volume (Units) Analysis by Imaging Technology, 2020 to 2035
  • Figure 87: Western Europe Market Value Share (%) and BPS Analysis by Imaging Technology, 2025 to 2035
  • Figure 88: Western Europe Market Y-o-Y Growth (%) Projections by Imaging Technology, 2025 to 2035
  • Figure 89: Western Europe Market Value (USD Million) Analysis by End User, 2020 to 2035
  • Figure 90: Western Europe Market Volume (Units) Analysis by End User, 2020 to 2035
  • Figure 91: Western Europe Market Value Share (%) and BPS Analysis by End User, 2025 to 2035
  • Figure 92: Western Europe Market Y-o-Y Growth (%) Projections by End User, 2025 to 2035
  • Figure 93: Western Europe Market Attractiveness by Product Type, 2025 to 2035
  • Figure 94: Western Europe Market Attractiveness by Imaging Technology, 2025 to 2035
  • Figure 95: Western Europe Market Attractiveness by End User, 2025 to 2035
  • Figure 96: Western Europe Market Attractiveness by Country, 2025 to 2035
  • Figure 97: Eastern Europe Market Value (USD Million) by Product Type, 2025 to 2035
  • Figure 98: Eastern Europe Market Value (USD Million) by Imaging Technology, 2025 to 2035
  • Figure 99: Eastern Europe Market Value (USD Million) by End User, 2025 to 2035
  • Figure 100: Eastern Europe Market Value (USD Million) by Country, 2025 to 2035
  • Figure 101: Eastern Europe Market Value (USD Million) Analysis by Country, 2020 to 2035
  • Figure 102: Eastern Europe Market Volume (Units) Analysis by Country, 2020 to 2035
  • Figure 103: Eastern Europe Market Value Share (%) and BPS Analysis by Country, 2025 to 2035
  • Figure 104: Eastern Europe Market Y-o-Y Growth (%) Projections by Country, 2025 to 2035
  • Figure 105: Eastern Europe Market Value (USD Million) Analysis by Product Type, 2020 to 2035
  • Figure 106: Eastern Europe Market Volume (Units) Analysis by Product Type, 2020 to 2035
  • Figure 107: Eastern Europe Market Value Share (%) and BPS Analysis by Product Type, 2025 to 2035
  • Figure 108: Eastern Europe Market Y-o-Y Growth (%) Projections by Product Type, 2025 to 2035
  • Figure 109: Eastern Europe Market Value (USD Million) Analysis by Imaging Technology, 2020 to 2035
  • Figure 110: Eastern Europe Market Volume (Units) Analysis by Imaging Technology, 2020 to 2035
  • Figure 111: Eastern Europe Market Value Share (%) and BPS Analysis by Imaging Technology, 2025 to 2035
  • Figure 112: Eastern Europe Market Y-o-Y Growth (%) Projections by Imaging Technology, 2025 to 2035
  • Figure 113: Eastern Europe Market Value (USD Million) Analysis by End User, 2020 to 2035
  • Figure 114: Eastern Europe Market Volume (Units) Analysis by End User, 2020 to 2035
  • Figure 115: Eastern Europe Market Value Share (%) and BPS Analysis by End User, 2025 to 2035
  • Figure 116: Eastern Europe Market Y-o-Y Growth (%) Projections by End User, 2025 to 2035
  • Figure 117: Eastern Europe Market Attractiveness by Product Type, 2025 to 2035
  • Figure 118: Eastern Europe Market Attractiveness by Imaging Technology, 2025 to 2035
  • Figure 119: Eastern Europe Market Attractiveness by End User, 2025 to 2035
  • Figure 120: Eastern Europe Market Attractiveness by Country, 2025 to 2035
  • Figure 121: South Asia and Pacific Market Value (USD Million) by Product Type, 2025 to 2035
  • Figure 122: South Asia and Pacific Market Value (USD Million) by Imaging Technology, 2025 to 2035
  • Figure 123: South Asia and Pacific Market Value (USD Million) by End User, 2025 to 2035
  • Figure 124: South Asia and Pacific Market Value (USD Million) by Country, 2025 to 2035
  • Figure 125: South Asia and Pacific Market Value (USD Million) Analysis by Country, 2020 to 2035
  • Figure 126: South Asia and Pacific Market Volume (Units) Analysis by Country, 2020 to 2035
  • Figure 127: South Asia and Pacific Market Value Share (%) and BPS Analysis by Country, 2025 to 2035
  • Figure 128: South Asia and Pacific Market Y-o-Y Growth (%) Projections by Country, 2025 to 2035
  • Figure 129: South Asia and Pacific Market Value (USD Million) Analysis by Product Type, 2020 to 2035
  • Figure 130: South Asia and Pacific Market Volume (Units) Analysis by Product Type, 2020 to 2035
  • Figure 131: South Asia and Pacific Market Value Share (%) and BPS Analysis by Product Type, 2025 to 2035
  • Figure 132: South Asia and Pacific Market Y-o-Y Growth (%) Projections by Product Type, 2025 to 2035
  • Figure 133: South Asia and Pacific Market Value (USD Million) Analysis by Imaging Technology, 2020 to 2035
  • Figure 134: South Asia and Pacific Market Volume (Units) Analysis by Imaging Technology, 2020 to 2035
  • Figure 135: South Asia and Pacific Market Value Share (%) and BPS Analysis by Imaging Technology, 2025 to 2035
  • Figure 136: South Asia and Pacific Market Y-o-Y Growth (%) Projections by Imaging Technology, 2025 to 2035
  • Figure 137: South Asia and Pacific Market Value (USD Million) Analysis by End User, 2020 to 2035
  • Figure 138: South Asia and Pacific Market Volume (Units) Analysis by End User, 2020 to 2035
  • Figure 139: South Asia and Pacific Market Value Share (%) and BPS Analysis by End User, 2025 to 2035
  • Figure 140: South Asia and Pacific Market Y-o-Y Growth (%) Projections by End User, 2025 to 2035
  • Figure 141: South Asia and Pacific Market Attractiveness by Product Type, 2025 to 2035
  • Figure 142: South Asia and Pacific Market Attractiveness by Imaging Technology, 2025 to 2035
  • Figure 143: South Asia and Pacific Market Attractiveness by End User, 2025 to 2035
  • Figure 144: South Asia and Pacific Market Attractiveness by Country, 2025 to 2035
  • Figure 145: East Asia Market Value (USD Million) by Product Type, 2025 to 2035
  • Figure 146: East Asia Market Value (USD Million) by Imaging Technology, 2025 to 2035
  • Figure 147: East Asia Market Value (USD Million) by End User, 2025 to 2035
  • Figure 148: East Asia Market Value (USD Million) by Country, 2025 to 2035
  • Figure 149: East Asia Market Value (USD Million) Analysis by Country, 2020 to 2035
  • Figure 150: East Asia Market Volume (Units) Analysis by Country, 2020 to 2035
  • Figure 151: East Asia Market Value Share (%) and BPS Analysis by Country, 2025 to 2035
  • Figure 152: East Asia Market Y-o-Y Growth (%) Projections by Country, 2025 to 2035
  • Figure 153: East Asia Market Value (USD Million) Analysis by Product Type, 2020 to 2035
  • Figure 154: East Asia Market Volume (Units) Analysis by Product Type, 2020 to 2035
  • Figure 155: East Asia Market Value Share (%) and BPS Analysis by Product Type, 2025 to 2035
  • Figure 156: East Asia Market Y-o-Y Growth (%) Projections by Product Type, 2025 to 2035
  • Figure 157: East Asia Market Value (USD Million) Analysis by Imaging Technology, 2020 to 2035
  • Figure 158: East Asia Market Volume (Units) Analysis by Imaging Technology, 2020 to 2035
  • Figure 159: East Asia Market Value Share (%) and BPS Analysis by Imaging Technology, 2025 to 2035
  • Figure 160: East Asia Market Y-o-Y Growth (%) Projections by Imaging Technology, 2025 to 2035
  • Figure 161: East Asia Market Value (USD Million) Analysis by End User, 2020 to 2035
  • Figure 162: East Asia Market Volume (Units) Analysis by End User, 2020 to 2035
  • Figure 163: East Asia Market Value Share (%) and BPS Analysis by End User, 2025 to 2035
  • Figure 164: East Asia Market Y-o-Y Growth (%) Projections by End User, 2025 to 2035
  • Figure 165: East Asia Market Attractiveness by Product Type, 2025 to 2035
  • Figure 166: East Asia Market Attractiveness by Imaging Technology, 2025 to 2035
  • Figure 167: East Asia Market Attractiveness by End User, 2025 to 2035
  • Figure 168: East Asia Market Attractiveness by Country, 2025 to 2035
  • Figure 169: Middle East and Africa Market Value (USD Million) by Product Type, 2025 to 2035
  • Figure 170: Middle East and Africa Market Value (USD Million) by Imaging Technology, 2025 to 2035
  • Figure 171: Middle East and Africa Market Value (USD Million) by End User, 2025 to 2035
  • Figure 172: Middle East and Africa Market Value (USD Million) by Country, 2025 to 2035
  • Figure 173: Middle East and Africa Market Value (USD Million) Analysis by Country, 2020 to 2035
  • Figure 174: Middle East and Africa Market Volume (Units) Analysis by Country, 2020 to 2035
  • Figure 175: Middle East and Africa Market Value Share (%) and BPS Analysis by Country, 2025 to 2035
  • Figure 176: Middle East and Africa Market Y-o-Y Growth (%) Projections by Country, 2025 to 2035
  • Figure 177: Middle East and Africa Market Value (USD Million) Analysis by Product Type, 2020 to 2035
  • Figure 178: Middle East and Africa Market Volume (Units) Analysis by Product Type, 2020 to 2035
  • Figure 179: Middle East and Africa Market Value Share (%) and BPS Analysis by Product Type, 2025 to 2035
  • Figure 180: Middle East and Africa Market Y-o-Y Growth (%) Projections by Product Type, 2025 to 2035
  • Figure 181: Middle East and Africa Market Value (USD Million) Analysis by Imaging Technology, 2020 to 2035
  • Figure 182: Middle East and Africa Market Volume (Units) Analysis by Imaging Technology, 2020 to 2035
  • Figure 183: Middle East and Africa Market Value Share (%) and BPS Analysis by Imaging Technology, 2025 to 2035
  • Figure 184: Middle East and Africa Market Y-o-Y Growth (%) Projections by Imaging Technology, 2025 to 2035
  • Figure 185: Middle East and Africa Market Value (USD Million) Analysis by End User, 2020 to 2035
  • Figure 186: Middle East and Africa Market Volume (Units) Analysis by End User, 2020 to 2035
  • Figure 187: Middle East and Africa Market Value Share (%) and BPS Analysis by End User, 2025 to 2035
  • Figure 188: Middle East and Africa Market Y-o-Y Growth (%) Projections by End User, 2025 to 2035
  • Figure 189: Middle East and Africa Market Attractiveness by Product Type, 2025 to 2035
  • Figure 190: Middle East and Africa Market Attractiveness by Imaging Technology, 2025 to 2035
  • Figure 191: Middle East and Africa Market Attractiveness by End User, 2025 to 2035
  • Figure 192: Middle East and Africa Market Attractiveness by Country, 2025 to 2035

Frequently Asked Questions

What was the overall size of the veterinary ultrasound scanner market in 2025?

The overall market size for veterinary ultrasound scanner market was USD 213.1 million in 2025.

How big is the veterinary ultrasound scanner market expected in 2035?

The veterinary ultrasound scanner market is expected to reach USD 307.6 million in 2035.

What will drive the demand for veterinary ultrasound scanner market during the forecast period?

The increasing number of varieties of livestock and equine care has raised the need for efficient diagnostic tools are enhancing market penetration the demand for veterinary ultrasound scanner market.

List the top 5 Key players of the veterinary ultrasound scanner market?

The top key players that drives the development of veterinary ultrasound scanner market are Mindray Medical International Limited, General Electric Company, Fujifilm Holdings Corporation, Canon Inc. and Samsung Electronics Co. Ltd.

Which segment in product type is expected to lead in veterinary ultrasound scanner market?

Portable/Hand Held Ultrasound Scanners, is by product type leading segment in veterinary ultrasound scanner market is expected to command significant share over the assessment period.

Explore Similar Insights

Future Market Insights

Veterinary Ultrasound Scanner Market