

- Industry Size (2026)
- USD 10.4 Bn
- Forecast (2036)
- USD 17.3 Bn
- CAGR (2026 to 2036)
- 5.2%
Veterinary Vaccines Market Size, Market Forecast and Outlook By FMI
The veterinary vaccines market was valued at USD 9.9 billion in 2025. The market is set to reach USD 10.4 billion by 2026-end and grow at a CAGR of 5.2% between 2026-2036 to reach USD 17.3 billion by 2036. _Live Attenuated Vaccines will dominate with a 38.0% share, while _Livestock Animals will lead with a 57.0% share.
Summary of the Veterinary Vaccines Market
- Demand and Growth Drivers
- Demand is shaped by industrial modernization programs and equipment upgrade cycles that are expanding adoption across established and emerging markets.
- Growth reflects sustained capital allocation toward process efficiency, compliance readiness, and operational reliability in core end-use industries.
- Regional procurement patterns are shifting toward suppliers that can deliver consistent quality, documented compliance, and reliable supply continuity.
- Product and Segment View
- The leading product segment maintains its dominant position through established procurement channels and broad end-use applicability.
- Secondary segments contribute to demand diversification through specialized applications and regional preference patterns.
- Distribution is concentrated through direct B2B channels, reflecting the industrial procurement structure of the market.
- Geography and Competitive Outlook
- China is expected to lead growth at 7.9% CAGR, supported by industrial scale, policy alignment, and expanding end-use demand.
- India follows at 7.5% CAGR, reflecting sustained investment in production capacity and infrastructure modernization.
- Companies with broad geographic reach, established distribution networks, and regulatory compliance capability are positioned to capture the largest share of incremental demand through 2036.
- Analyst Opinion
- Anurag Sharma, Principal Consultant at FMI says, 'Companies that can improve cost competitiveness while delivering consistent performance across core industrial applications are likely to strengthen their position over the forecast period. The veterinary vaccines market is moving toward a consolidated competitive structure where production scale, compliance readiness, and application depth determine market positioning. Procurement behavior is shifting toward longer-cycle supply agreements that reward operational reliability and documented traceability. Growth through 2036 is expected to concentrate among suppliers that combine production efficiency with regulatory documentation capability, particularly in markets where compliance thresholds are rising.'
- The veterinary vaccines market is evolving from price-led competition toward a value chain structure where technical capability, supply continuity, and compliance depth determine supplier selection.
- Adoption is being supported by regulatory frameworks that are raising minimum performance and documentation standards across key regions.
- Demand diversification across end-use categories is reducing cyclical risk and supporting more stable growth trajectories through the forecast period.
- China at 7.9% CAGR represents the strongest country-level growth opportunity, supported by expanding industrial capacity and favorable policy conditions.
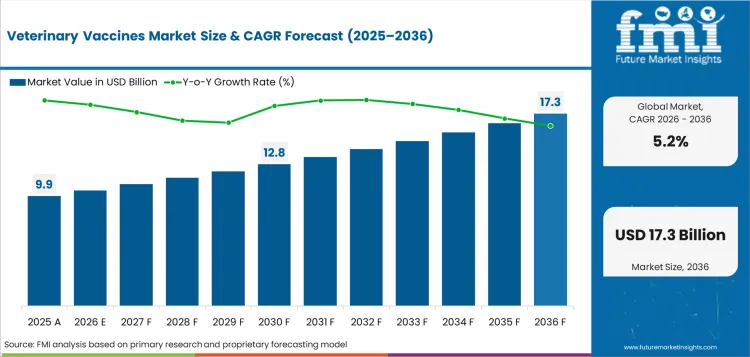
Key Takeaways, Market Size, and Forecast
| Metric | Value |
|---|---|
| Market Size (2025) | USD 9.92 Billion |
| Market Size (2036) | USD 17.33 Billion |
| CAGR (2026–2036) | 5.2% |
| Incremental Opportunity (2026–2036) | USD 6.89 Billion |
| Fastest-Growing Country | China |
| China CAGR | 7.9% |
| 2nd Fastest-Growing Country | India |
| India CAGR | 7.5% |
Veterinary Vaccines Market Definition
The veterinary vaccines market encompasses products and solutions categorized by product, animal, disease indication, route of administration, distribution channel. The market covers commercially traded products across established and emerging applications, serving end users through direct supply, distribution networks, and specialized channels. Revenue sizing reflects transaction-level data from 2026 to 2036 across more than 30 countries.
Veterinary Vaccines Market Inclusions
Market scope encompasses all commercially traded products categorized . The range of revenue sizes is from 2026 to 2036.
Veterinary Vaccines Market Exclusions
The scope does not include products sold as raw materials without processing, components integrated into unrelated equipment categories, or products classified under separate regulatory frameworks not aligned with the defined market taxonomy.
Veterinary Vaccines Market Research Methodology
- Primary Research: FMI analysts conducted structured interviews with manufacturers, distributors, procurement specialists, and end users across key markets to validate demand patterns and competitive positioning.
- Desk Research: Combined data from industry associations, regulatory filings, trade publications, and manufacturer disclosures to establish baseline market metrics.
- Market Sizing and Forecasting: Built through a hybrid bottom-up and top-down methodology starting with verified transaction data, projecting adoption velocity across segments and regions.
- Data Validation: Cross-checked quarterly against global production data, trade statistics, and manufacturer disclosures to ensure consistency.
Why is the Veterinary Vaccines Market Growing?
- Industrial modernization and compliance-driven equipment upgrade cycles are expanding the addressable market across developed as well as emerging economies.
- China grew at 7.9%, reflecting ongoing capital formation in core end-use industries and infrastructure development programs.
Veterinary vaccines market is gaining momentum as industrial operations focus on equipment upgrades, process efficiency and regulatory compliance across key end-use verticals. Increased capital spending on infrastructure improvements and expanding production capabilities are helping to meet demand in both mature markets and high growth economies. “Total cost of ownership, maintenance and compliance readiness are becoming more important factors in equipment selection than the purchase price at time of initial purchase.
The regional demand patterns reflect varying levels of industrial development and regulatory stringency. In North America and Europe, the markets are mature with replacement and upgrade cycles based on compliance needs and operational efficiency goals. In contrast, Asia and Latin America’s high-growth markets are driving demand for new facility buildouts and industrial capacity expansion. Buyers are increasingly looking to reduce operational disruption and maintain continuity of production, so supply chain reliability and after-sales service capability are being seen as key procurement criteria.
Market Segmentation Analysis
- Product segment is dominated by Live Attenuated Vaccines with 38.0% share owing to high efficacy, long-lasting immunity and use in livestock vaccination programs.
- Livestock Animals make up 57.0% of the animal segment due to high vaccination penetration in cattle and poultry production systems.
- Foot and Mouth Disease accounts for 26.0% of disease indication demand, due to government-led immunization campaigns and increasing disease surveillance programs.
- Injection segment is anticipated to account for 61.0% share of the route of administration segment on account of its proven efficacy and standardized veterinary administration practices.
Based on product, animal type, disease indication, route of administration and distribution channel, the veterinary vaccines market is segmented into: Each segment reflects varying disease management needs, regulatory environments, procurement systems and adoption trends which will drive demand throughout the forecast period.
Insights into the Live Attenuated Vaccines Product Segment
Live Attenuated Vaccines are expected to dominate the product segment with 38.0% share in 2026. Demand is supported by their ability to provide strong and durable immune responses with fewer booster requirements compared to alternative vaccine technologies. These vaccines are widely integrated into livestock disease prevention programs where large-scale immunization efficiency is critical.
The segment is projected to maintain steady growth through 2036 as veterinary healthcare systems increasingly prioritize preventive disease management to reduce production losses and improve animal health outcomes. Expanding government vaccination initiatives and rising investments in animal disease surveillance are expected to further strengthen adoption.
Insights into the Livestock Animals Segment
The Livestock Animals market is estimated to reach 57.0% in 2026 in the animal segment. This growth is attributed to increasing commercial farming activities, growing global meat and dairy consumption, and need to minimize economic losses associated with infectious disease outbreaks. Cattle and poultry vaccination programs continue to be a significant volume procurement in both developed and emerging markets.
The segment is projected to experience steady growth as industrialized farming operations incorporate routine vaccination protocols to boost herd productivity, uphold export compliance standards, and safeguard food security. There is also a growing awareness about zoonotic disease prevention that is driving the use of vaccines more broadly across livestock populations.
Insights into the Foot and Mouth Disease Indication Segment
Foot and Mouth Disease is projected to account for 26.0% share of the disease indication segment by the year 2026. The segment is expected to grow due to continuous vaccination campaigns in high livestock density regions and repeated risks of disease outbreak. Governments and international veterinary organizations are investing more in disease control frameworks to reduce the risks of cross-border transmission and protect agricultural productivity.
Demand is projected to increase during the forecast period as more stringent animal health regulations and surveillance programs promote preventive vaccination coverage across cattle and other susceptible livestock species.
Insights into the Injection Route of Administration Segment
In 2026, injection is expected to dominate the route of administration segment with a share of 61.0%. This is mainly due to the fact that injectable vaccines have proven clinical efficacy, deliver the correct dose consistently and are generally accepted by the veterinary community.
The segment is expected to continue to be the leading segment through 2036, as injectable administration will continue to be the preferred route of administration for routine immunization programs in livestock and companion animals. Furthermore, advances in vaccine formulation technologies and improved cold-chain infrastructure are also helping to make injectable veterinary vaccines more scalable and reliable.
Insights into the Veterinary Clinics Distribution Channel Segment
Veterinary Clinics are expected to remain a key distribution channel for veterinary vaccines, thanks to their role in professional vaccine administration, disease diagnosis and animal healthcare consultation. Clinics are increasingly becoming the central places to book preventive care and vaccinations, particularly for companion animals and specialized livestock management services.
The channel is anticipated to benefit from rising pet ownership, expanding veterinary infrastructure and increasing awareness regarding preventive animal healthcare practices. At the same time, organized supply chains and regulatory controls are improving vaccine availability and speed of distribution in local markets.
Veterinary Vaccines Market Drivers, Restraints, and Opportunities
- Driving installed base growth via industrial modernization programs and regulatory compliance requirements and structured equipment upgrade cycles.
- Long procurement cycles and capital intensity create barriers to rapid market entry, favoring established manufacturers with proven service infrastructure.
- New end-use sectors with new applications are emerging and expanding the addressable market beyond traditional categories.
The veterinary vaccines market continues to grow as the demand side requirements change across core applications. Regulatory alignment, end-use diversification, and procurement consolidation toward suppliers that can deliver consistent quality and compliance documentation underpin structural growth. “Cost pressures remain, there are infrastructure gaps in emerging markets and qualification timelines slow new product adoption”.
Compliance-Driven Equipment Upgrades
Regulatory requirements around safety, emissions, and operational standards are converting discretionary equipment maintenance into mandatory upgrade programs. This compliance-driven demand is creating predictable replacement cycles that support sustained market growth independent of new capacity additions.
Capital Intensity and Entry Barriers
Structural barriers to market entry are created by high capital requirements to produce, certify and service. Switching costs are higher for buyers because established manufacturers have the advantage of an installed base, long-term service contracts and proven performance records.
Emerging Application Expansion
The addressable market is expanding outside traditional categories with adjacent industries and new use cases. These emerging use cases are driving incremental demand additive to core application growth and de-cyclicality.
Supply Chain Regionalization
The procurement trends are towards regional suppliers who can reduce lead times and minimize risk of supply disruption. Manufacturers with distributed production footprints and local service capability are gaining a competitive advantage in markets where supply security is a procurement priority.
Analysis of Veterinary Vaccines Market by Key Countries
.webp "Top Country Growth Comparison Veterinary Vaccines Market Cagr (2026 2036)")
| Country | CAGR |
|---|---|
| China | 7.9% |
| India | 7.5% |
| Brazil | 6.5% |
| USA | 6.1% |
| UK | 5.7% |
| Germany | 5% |
Source: FMI analysis based on primary research and proprietary forecasting model
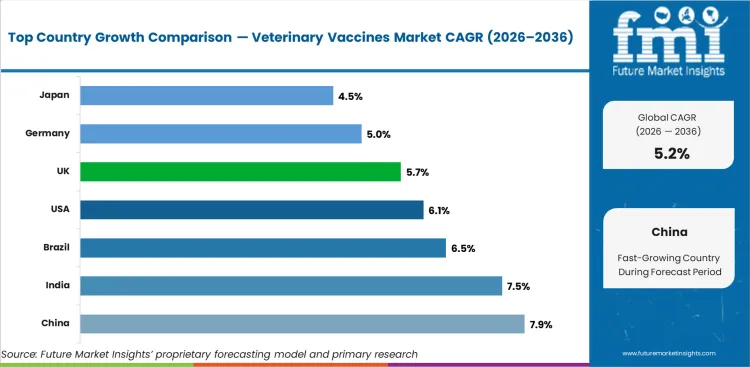
- Strong industrial capacity and policy-supported demand expansion drive China’s growth at 7.9% CAGR through 2036.
- India at 7.5% suggests sustained demand driven by production modernization and rising end-use applications.
- Brazil (6.5%) and USA (6.1%) continue growth on the back of regulatory compliance and infrastructure investment cycles.
The global veterinary vaccines market is projected to grow at a CAGR of 5.2% during the forecast period 2026-2036. The study covers more than 30 countries and the key markets are listed below.
Demand Outlook for Veterinary Vaccines Market in China
China is forecast to grow at 7.9% CAGR through 2036. MARA mandatory vaccination programs for foot-and-mouth disease, highly pathogenic avian influenza, and other notifiable diseases create government-funded demand for procurement. The post-ASF swine herd rebuilding has been accompanied by enormous investments in swine vaccination programs and biosecurity infrastructure.
- MARA mandatory vaccination for FMD, HPAI and other notifiable diseases drives national level government-procurement vaccine demand.
- ASF aftermath swine herd rebuilding spurs investment in broad spectrum swine vaccination protocols including PCV2, PRRS and classical swine fever.
- Local vaccine manufacturers like CAHIC and Yebio are ramping up production capacity to reduce dependency on imports.
Future Outlook for Veterinary Vaccines Market in India
India is expected to grow at 7.5% CAGR till 2036. DAHD National Animal Disease Control Programme for FMD and Brucellosis vaccination covering 500 million livestock creating the world’s largest government veterinary vaccination program. Integrated producers are implementing full vaccination programmes and poultry vaccination coverage is increasing.
- Massive government procurement due to NADCP programme for vaccination against FMD and Brucellosis of 500 million cattle and buffalo
- Full vaccination protocols for Newcastle disease, IBD and Marek's disease driven by Suguna and Venky’s poultry sector integration.
- Urban pet vaccination adoption is increasing as veterinary clinic infrastructure grows in metropolitan areas.
Opportunity Analysis of Veterinary Vaccines Market in USA
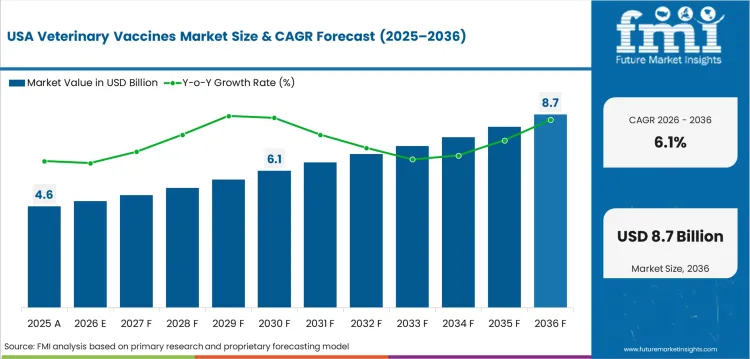
USA is expected to grow at a CAGR of 6.8% till 2036. The US companion animal vaccine market is the largest in the world. Core vaccination protocols for dogs and cats generate predictable demand via visits to veterinary clinics. Market confidence is supported through regulatory oversight of vaccine efficacy and safety standards by USDA-APHIS.
- Annual veterinary clinic visits support predictable demand for core vaccination protocols for companion animals, dogs and cats.
- USDA-APHIS Center for Veterinary Biologics regulatory oversight ensures standards of efficacy and safety for vaccines
- Zoetis and Boehringer Ingelheim mRNA and recombinant vaccine technology platforms are broadening product pipeline innovation.
In-depth Analysis of Veterinary Vaccines Market in Germany
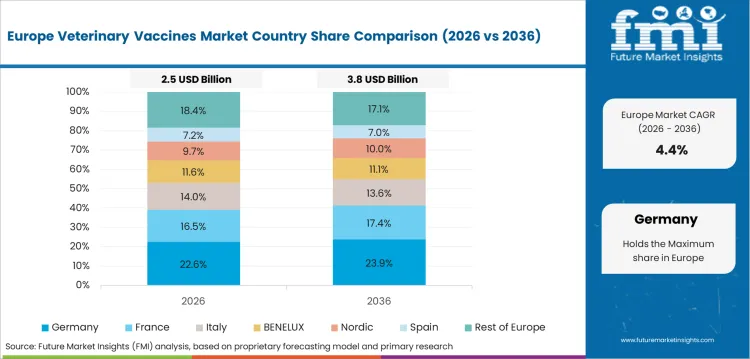
Germany is expected to grow at a CAGR of 6.2% until 2036. Boehringer Ingelheim (headquarters in Ingelheim) and IDT Biologika - German veterinary vaccine R&D with global technology leadership. Germany has one of the highest companion animal vaccination rates in Europe, which is conducive to per-pet vaccination expenditure.
- Ingelheim-based Boehringer Ingelheim Animal Health global headquarters remains a leader in veterinary vaccine R&D and manufacturing.
- IDT Biologika vaccine production at Dessau supplies European and global livestock vaccines from German production.
- Highest rates of companion animal vaccination in Europe keep per pet spend above regional averages.
Sales Analysis of Veterinary Vaccines Market in Brazil
Brazil is forecast to expand at a CAGR of 5.8% through 2036. The large-volume vaccine procurement is created by MAPA mandatory FMD vaccination program across the national cattle herd and the increase of poultry vaccination coverage for export certification. Continued national investment in vaccination is necessary to maintain Brazil’s FMD-free status.
- MAPA’s mandatory FMD vaccination of more than 200 million cattle continues to be the largest livestock vaccine procurement program in Latin America.
- Export certification for poultry to EU and Middle East markets requires Newcastle disease and AI vaccination documentation.
- Rising demand for core vaccination protocols for dogs and cats due to the expansion of companion animal market in urban areas.
Growth Analysis of Veterinary Vaccines Market in UK
UK is projected to grow at 5.4% CAGR through 2036. UK companion animal population exceeding 34 million pets sustains strong vaccination demand through veterinary practice visits. VMD regulatory oversight and post-Brexit regulatory independence create a separate market authorization pathway for veterinary vaccines.
- Companion animal population exceeding 34 million pets sustains strong core vaccination demand through annual veterinary visits.
- VMD regulatory independence post-Brexit creates a separate market authorization pathway for veterinary biological products.
- Livestock vaccination for BVD eradication programs across UK devolved administrations creates structured procurement.
Competitive Landscape and Strategic Positioning
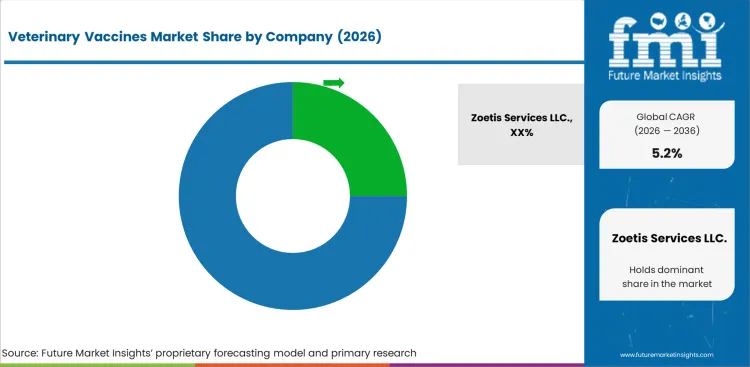
- Zoetis Services LLC. has a competitive advantage in terms of production scale, geographic reach and established relationships with key end users in major markets.
- Merck & Co., Inc. (MSD Animal Health), Bioveta, Inc., and Elanco (Eli Lilly) compete on product breadth, technical capability and regional distribution strength.
- Upstart players are winning in niche applications where technical differentiation and a focus on niche markets provide a competitive edge.
The major factors influencing the competitive landscape of the veterinary vaccines market are production scale, technical capability, geographic coverage and regulatory compliance depth. Market leadership is achieved through consistent quality delivery across multi region operations, coupled with cost competitiveness and supply reliability.
Buyers are consolidating their procurement to fewer, larger suppliers who can meet increasing documentation, traceability and performance validation requirements. Competition is intensifying. Cost optimization, capacity expansion in high-growth regions and investments in application-specific solutions to meet evolving end-user requirements are among strategic priorities for market participants.
Barriers to Entry Capital intensive manufacturing infrastructure Regulatory certification requirements Existing customer relationships Validated performance records across target applications. These structural advantages benefit incumbent players, while providing opportunities for technically differentiated entrants in specialized market segments.
Key Companies in the Veterinary Vaccines Market
Key global companies leading the veterinary vaccines market include:
- Zoetis Services LLC., Merck & Co., Inc. (MSD Animal Health), Bioveta, Inc., Elanco (Eli Lilly) maintain global leadership through production scale, broad product portfolios, and established end-user relationships across multiple regions.
- Ceva, Boehringer Ingelheim International GmbH, Kemin Industries, Inc. have established regional strength through specialized product focus and proximity to key end-use markets.
- HESTER BIOSCIENCES LIMITED, Phibro Animal Health Corporation, Virbac represent emerging competitors with differentiated technology, niche application expertise, or regional manufacturing advantages.
Competitive Benchmarking: Veterinary Vaccines Market
| Company | Product Breadth | Technical Capability | Service Network | Geographic Footprint |
|---|---|---|---|---|
| Zoetis Services LLC. | High | High | Strong | Global |
| Merck & Co., Inc. (MSD Animal Health) | High | High | Strong | Global |
| Bioveta, Inc. | High | High | Strong | Global |
| Elanco (Eli Lilly) | Medium | High | Moderate | Regional |
| Ceva | Medium | Medium | Moderate | Regional |
| Boehringer Ingelheim International GmbH | Medium | Medium | Moderate | Regional |
| Kemin Industries, Inc. | Medium | Medium | Developing | Focused |
| HESTER BIOSCIENCES LIMITED | Medium | Medium | Developing | Focused |
| Phibro Animal Health Corporation | Medium | Medium | Developing | Focused |
| Virbac | Medium | Medium | Developing | Focused |
Source: Future Market Insights competitive analysis, 2026.
Key Developments in Veterinary Vaccines Market
- In 2025, Zoetis Services LLC invested $590 million in a new Georgia facility, expanding its USA manufacturing footprint to enhance production capacity for animal health biologics and vaccine products.
- In 2025, Merck & Co., Inc. (MSD Animal Health) received a positive European regulatory opinion for INNOVAX®-ND-IBD-ILT, a single dose poultry vaccine providing combined protection against four major poultry diseases.
- In 2025, Boehringer Ingelheim International GmbH launched a new range of poultry vaccines, including VAXXITEK® HVT+IBD+H5, a trivalent avian influenza vaccine launched in Egypt and marketed for high-risk poultry markets.
Key Players in the Veterinary Vaccines Market
Major Global Players
- Zoetis Services LLC.
- Merck & Co., Inc. (MSD Animal Health)
- Bioveta, Inc.
- Elanco (Eli Lilly)
- Ceva
- Boehringer Ingelheim International GmbH
- Kemin Industries, Inc.
Emerging Players/Startups
- HESTER BIOSCIENCES LIMITED
- Phibro Animal Health Corporation
- Virbac
- LETI Pharma
- Ourofino
- HIPRA
- Jinyu Biotechnology Co., Ltd.
- Indian Immunologicals Ltd.
- Vaxxinova
- Biogénesis Bagó
Report Scope and Coverage
| Parameter | Details |
|---|---|
| Quantitative Units | USD 10.44 Billion to USD 17.33 Billion, at a CAGR of 5.2% |
| Market Definition | The veterinary vaccines market encompasses products and solutions across established and emerging applications categorized by product, animal, disease indication, route of administration, distribution channel. |
| Regions Covered | North America, Latin America, Europe, East Asia, South Asia and Pacific, Middle East and Africa |
| Countries Covered | China, India, Brazil, USA, UK, Germany, Japan, 30 plus countries |
| Key Companies Profiled | Zoetis Services LLC., Merck & Co., Inc. (MSD Animal Health), Bioveta, Inc., Elanco (Eli Lilly), Ceva, Boehringer Ingelheim International GmbH, Kemin Industries, Inc., HESTER BIOSCIENCES LIMITED, Phibro Animal Health Corporation, Virbac, LETI Pharma, Ourofino |
| Forecast Period | 2026 to 2036 |
| Approach | Hybrid bottom-up and top-down methodology starting with verified transaction data, projecting adoption velocity across segments and regions. |
Segmentation
Veterinary Vaccines Market Segmented by Product:
-
- Live Attenuated Vaccines
- Bacterial Vaccines
- Viral Vaccines
- Inactivated Vaccines
- Killed Bacterial Vaccines
- Killed Viral Vaccines
- Recombinant Vaccines
- Vector Based Vaccines
- Subunit Vaccines
- Toxoid Vaccines
- Clostridial Vaccines
- Tetanus Vaccines
- DNA Vaccines
- Plasmid DNA Vaccines
- Genetic Immunization Vaccines
- Live Attenuated Vaccines
Veterinary Vaccines Market Segmented by Animal:
-
- Livestock Animals
- Cattle
- Poultry
- Companion Animals
- Dogs
- Cats
- Aquaculture Animals
- Fish
- Shr
- Livestock Animals
Veterinary Vaccines Market Segmented by Disease Indication:
-
- Foot and Mouth Disease
- Cattle Vaccination
- Swine Vaccination
- Rabies
- Canine Rabies
- Feline Rabies
- Newcastle Disease
- Poultry Vaccination
- Layer Bird Vaccination
- Brucellosis
- Cattle Brucellosis
- Goat Brucellosis
- Foot and Mouth Disease
Veterinary Vaccines Market Segmented by Route of Administration:
-
- Injectable
- Intramuscular
- Subcutaneous
- Oral
- Feed Based Vaccination
- Water Based Vaccination
- Intranasal
- Spray Vaccination
- Nasal Drops
- Injectable
Veterinary Vaccines Market Segmented by Distribution Channel:
-
- Veterinary Hospitals and Clinics
- Private Clinics
- Animal Hospitals
- Pharmacies
- Retail Veterinary Pharmacies
- Institutional Supply
- Online Sales
- E Commerce Platforms
- Manufacturer Websites
- Distributors
- Regional Suppliers
- Bulk Supply Networks
- Veterinary Hospitals and Clinics
Veterinary Vaccines Market by Region:
- North America
- USA
- Canada
- Mexico
- Latin America
- Brazil
- Chile
- Rest of Latin America
- Western Europe
- Germany
- UK
- Italy
- Spain
- France
- Nordic
- BENELUX
- Rest of Western Europe
- Eastern Europe
- Russia
- Poland
- Hungary
- Balkan & Baltic
- Rest of Eastern Europe
- East Asia
- China
- Japan
- South Korea
- South Asia and Pacific
- India
- ASEAN
- Australia & New Zealand
- Rest of South Asia and Pacific
- Middle East & Africa
- Kingdom of Saudi Arabia
- Other GCC Countries
- Turkiye
- South Africa
- Other African Union
- Rest of Middle East & Africa
Research Sources and Bibliography
- 1. International Organization for Standardization. (2025). Industrial Equipment Standards and Certification Reports. ISO.
- 2. World Bank. (2025). Global Economic Prospects: Infrastructure Investment Data. World Bank.
- 3. United Nations Industrial Development Organization. (2025). Global Manufacturing and Industrial Output Report. UNIDO.
- 4. International Energy Agency. (2025). Global Industrial Energy Efficiency Report. IEA.
- 5. USA Department of Commerce. (2025). International Trade Administration: Industry and Analysis Reports. DOC.
This bibliography is provided for reader reference.
This Report Answers
- Estimating the size of the veterinary vaccines market and revenue projections from 2026 to 2036.
- Segmentation analysis by product, animal, disease indication, route of administration, distribution channel.
- Regional and country-level insights across more than 30 markets.
- Technology and application trend analysis across core end-use categories.
- Competitive landscape assessment and company positioning.
- Investment opportunity identification across high-growth segments and regions.
- Supply chain and distribution channel analysis.
- Delivery of data in PDF and Excel formats.
Frequently Asked Questions
What is the global market demand for Veterinary Vaccines Market in 2026?
In 2026, the global veterinary vaccines market is expected to be worth USD 10.44 billion.
How big will the Veterinary Vaccines Market be in 2036?
By 2036, the veterinary vaccines market is expected to be worth USD 17.33 billion.
How much is demand for Veterinary Vaccines Market expected to grow between 2026 and 2036?
Between 2026 and 2036, the demand for veterinary vaccines market is expected to grow at a CAGR of 5.2%.
Which segment is likely to lead globally by 2026?
The leading segment maintains its dominant position through established demand patterns and procurement scale.
What is causing demand to rise in China?
China is expected to grow at 7.9% CAGR through 2036, supported by industrial capacity expansion, regulatory modernization, and increasing adoption across core applications.
What is causing demand to rise in India?
India is expected to grow at 7.5% CAGR through 2036, reflecting sustained investment in production capacity and expanding end-use demand.
What does this report mean by 'Veterinary Vaccines Market definition'?
The veterinary vaccines market encompasses commercially traded products and solutions categorized by product, animal, disease indication, route of administration, distribution channel, serving end users across established and emerging applications.
How does FMI make the Veterinary Vaccines Market forecast and validate it?
Forecasting models use a hybrid bottom-up and top-down approach, starting with verified transaction data and cross-checking against global production statistics, trade data, and manufacturer disclosures.
Preview the report firsthand - request a free sample
Get SampleGet the brochure for pricing and purchase details.
Get PDFTable of Content
- Executive Summary
- Global Market Outlook
- Demand-side Trends
- Supply-side Trends
- Technology Roadmap Analysis
- Analysis and Recommendations
- Market Overview
- Market Coverage / Taxonomy
- Market Definition / Scope / Limitations
- Research Methodology
- Chapter Orientation
- Analytical Lens and Working Hypotheses
- Market Structure, Signals, and Trend Drivers
- Benchmarking and Cross-market Comparability
- Market Sizing, Forecasting, and Opportunity Mapping
- Research Design and Evidence Framework
- Desk Research Programme (Secondary Evidence)
- Company Annual and Sustainability Reports
- Peer-reviewed Journals and Academic Literature
- Corporate Websites, Product Literature, and Technical Notes
- Earnings Decks and Investor Briefings
- Statutory Filings and Regulatory Disclosures
- Technical White Papers and Standards Notes
- Trade Journals, Industry Magazines, and Analyst Briefs
- Conference Proceedings, Webinars, and Seminar Materials
- Government Statistics Portals and Public Data Releases
- Press Releases and Reputable Media Coverage
- Specialist Newsletters and Curated Briefings
- Sector Databases and Reference Repositories
- FMI Internal Proprietary Databases and Historical Market Datasets
- Subscription Datasets and Paid Sources
- Social Channels, Communities, and Digital Listening Inputs
- Additional Desk Sources
- Expert Input and Fieldwork (Primary Evidence)
- Primary Modes
- Qualitative Interviews and Expert Elicitation
- Quantitative Surveys and Structured Data Capture
- Blended Approach
- Why Primary Evidence is Used
- Field Techniques
- Interviews
- Surveys
- Focus Groups
- Observational and In-context Research
- Social and Community Interactions
- Stakeholder Universe Engaged
- C-suite Leaders
- Board Members
- Presidents and Vice Presidents
- R&D and Innovation Heads
- Technical Specialists
- Domain Subject-matter Experts
- Scientists
- Physicians and Other Healthcare Professionals
- Governance, Ethics, and Data Stewardship
- Research Ethics
- Data Integrity and Handling
- Primary Modes
- Tooling, Models, and Reference Databases
- Desk Research Programme (Secondary Evidence)
- Data Engineering and Model Build
- Data Acquisition and Ingestion
- Cleaning, Normalisation, and Verification
- Synthesis, Triangulation, and Analysis
- Quality Assurance and Audit Trail
- Market Background
- Market Dynamics
- Drivers
- Restraints
- Opportunity
- Trends
- Scenario Forecast
- Demand in Optimistic Scenario
- Demand in Likely Scenario
- Demand in Conservative Scenario
- Opportunity Map Analysis
- Product Life Cycle Analysis
- Supply Chain Analysis
- Investment Feasibility Matrix
- Value Chain Analysis
- PESTLE and Porter’s Analysis
- Regulatory Landscape
- Regional Parent Market Outlook
- Production and Consumption Statistics
- Import and Export Statistics
- Market Dynamics
- Global Market Analysis 2021 to 2025 and Forecast, 2026 to 2036
- Historical Market Size Value (USD Million) Analysis, 2021 to 2025
- Current and Future Market Size Value (USD Million) Projections, 2026 to 2036
- Y-o-Y Growth Trend Analysis
- Absolute $ Opportunity Analysis
- Global Market Pricing Analysis 2021 to 2025 and Forecast 2026 to 2036
- Global Market Analysis 2021 to 2025 and Forecast 2026 to 2036, By Product
- Introduction / Key Findings
- Historical Market Size Value (USD Million) Analysis By Product, 2021 to 2025
- Current and Future Market Size Value (USD Million) Analysis and Forecast By Product, 2026 to 2036
- Live Attenuated Vaccines
- Bacterial Vaccines
- Viral Vaccines
- Inactivated Vaccines
- Killed Bacterial Vaccines
- Killed Viral Vaccines
- Recombinant Vaccines
- Vector Based Vaccines
- Subunit Vaccines
- Toxoid Vaccines
- Live Attenuated Vaccines
- Y-o-Y Growth Trend Analysis By Product, 2021 to 2025
- Absolute $ Opportunity Analysis By Product, 2026 to 2036
- Global Market Analysis 2021 to 2025 and Forecast 2026 to 2036, By Animal
- Introduction / Key Findings
- Historical Market Size Value (USD Million) Analysis By Animal, 2021 to 2025
- Current and Future Market Size Value (USD Million) Analysis and Forecast By Animal, 2026 to 2036
- Livestock Animals
- Cattle
- Poultry
- Companion Animals
- Dogs
- Cats
- Aquaculture Animals
- Fish
- Shr
- Livestock Animals
- Y-o-Y Growth Trend Analysis By Animal, 2021 to 2025
- Absolute $ Opportunity Analysis By Animal, 2026 to 2036
- Global Market Analysis 2021 to 2025 and Forecast 2026 to 2036, By Disease Indication
- Introduction / Key Findings
- Historical Market Size Value (USD Million) Analysis By Disease Indication, 2021 to 2025
- Current and Future Market Size Value (USD Million) Analysis and Forecast By Disease Indication, 2026 to 2036
- Foot and Mouth Disease
- Cattle Vaccination
- Swine Vaccination
- Rabies
- Canine Rabies
- Feline Rabies
- Newcastle Disease
- Poultry Vaccination
- Layer Bird Vaccination
- Brucellosis
- Foot and Mouth Disease
- Y-o-Y Growth Trend Analysis By Disease Indication, 2021 to 2025
- Absolute $ Opportunity Analysis By Disease Indication, 2026 to 2036
- Global Market Analysis 2021 to 2025 and Forecast 2026 to 2036, By Route of Administration
- Introduction / Key Findings
- Historical Market Size Value (USD Million) Analysis By Route of Administration, 2021 to 2025
- Current and Future Market Size Value (USD Million) Analysis and Forecast By Route of Administration, 2026 to 2036
- Injectable
- Intramuscular
- Subcutaneous
- Oral
- Feed Based Vaccination
- Water Based Vaccination
- Intranasal
- Spray Vaccination
- Nasal Drops
- Injectable
- Y-o-Y Growth Trend Analysis By Route of Administration, 2021 to 2025
- Absolute $ Opportunity Analysis By Route of Administration, 2026 to 2036
- Global Market Analysis 2021 to 2025 and Forecast 2026 to 2036, By Distribution Channel
- Introduction / Key Findings
- Historical Market Size Value (USD Million) Analysis By Distribution Channel, 2021 to 2025
- Current and Future Market Size Value (USD Million) Analysis and Forecast By Distribution Channel, 2026 to 2036
- Veterinary Hospitals and Clinics
- Private Clinics
- Animal Hospitals
- Pharmacies
- Retail Veterinary Pharmacies
- Institutional Supply
- Online Sales
- E Commerce Platforms
- Manufacturer Websites
- Distributors
- Veterinary Hospitals and Clinics
- Y-o-Y Growth Trend Analysis By Distribution Channel, 2021 to 2025
- Absolute $ Opportunity Analysis By Distribution Channel, 2026 to 2036
- Global Market Analysis 2021 to 2025 and Forecast 2026 to 2036, By Region
- Introduction
- Historical Market Size Value (USD Million) Analysis By Region, 2021 to 2025
- Current Market Size Value (USD Million) Analysis and Forecast By Region, 2026 to 2036
- North America
- Latin America
- Western Europe
- Eastern Europe
- East Asia
- South Asia and Pacific
- Middle East & Africa
- Market Attractiveness Analysis By Region
- North America Market Analysis 2021 to 2025 and Forecast 2026 to 2036, By Country
- Historical Market Size Value (USD Million) Trend Analysis By Market Taxonomy, 2021 to 2025
- Market Size Value (USD Million) Forecast By Market Taxonomy, 2026 to 2036
- By Country
- USA
- Canada
- Mexico
- By Product
- By Animal
- By Disease Indication
- By Route of Administration
- By Distribution Channel
- By Country
- Market Attractiveness Analysis
- By Country
- By Product
- By Animal
- By Disease Indication
- By Route of Administration
- By Distribution Channel
- Key Takeaways
- Latin America Market Analysis 2021 to 2025 and Forecast 2026 to 2036, By Country
- Historical Market Size Value (USD Million) Trend Analysis By Market Taxonomy, 2021 to 2025
- Market Size Value (USD Million) Forecast By Market Taxonomy, 2026 to 2036
- By Country
- Brazil
- Chile
- Rest of Latin America
- By Product
- By Animal
- By Disease Indication
- By Route of Administration
- By Distribution Channel
- By Country
- Market Attractiveness Analysis
- By Country
- By Product
- By Animal
- By Disease Indication
- By Route of Administration
- By Distribution Channel
- Key Takeaways
- Western Europe Market Analysis 2021 to 2025 and Forecast 2026 to 2036, By Country
- Historical Market Size Value (USD Million) Trend Analysis By Market Taxonomy, 2021 to 2025
- Market Size Value (USD Million) Forecast By Market Taxonomy, 2026 to 2036
- By Country
- Germany
- UK
- Italy
- Spain
- France
- Nordic
- BENELUX
- Rest of Western Europe
- By Product
- By Animal
- By Disease Indication
- By Route of Administration
- By Distribution Channel
- By Country
- Market Attractiveness Analysis
- By Country
- By Product
- By Animal
- By Disease Indication
- By Route of Administration
- By Distribution Channel
- Key Takeaways
- Eastern Europe Market Analysis 2021 to 2025 and Forecast 2026 to 2036, By Country
- Historical Market Size Value (USD Million) Trend Analysis By Market Taxonomy, 2021 to 2025
- Market Size Value (USD Million) Forecast By Market Taxonomy, 2026 to 2036
- By Country
- Russia
- Poland
- Hungary
- Balkan & Baltic
- Rest of Eastern Europe
- By Product
- By Animal
- By Disease Indication
- By Route of Administration
- By Distribution Channel
- By Country
- Market Attractiveness Analysis
- By Country
- By Product
- By Animal
- By Disease Indication
- By Route of Administration
- By Distribution Channel
- Key Takeaways
- East Asia Market Analysis 2021 to 2025 and Forecast 2026 to 2036, By Country
- Historical Market Size Value (USD Million) Trend Analysis By Market Taxonomy, 2021 to 2025
- Market Size Value (USD Million) Forecast By Market Taxonomy, 2026 to 2036
- By Country
- China
- Japan
- South Korea
- By Product
- By Animal
- By Disease Indication
- By Route of Administration
- By Distribution Channel
- By Country
- Market Attractiveness Analysis
- By Country
- By Product
- By Animal
- By Disease Indication
- By Route of Administration
- By Distribution Channel
- Key Takeaways
- South Asia and Pacific Market Analysis 2021 to 2025 and Forecast 2026 to 2036, By Country
- Historical Market Size Value (USD Million) Trend Analysis By Market Taxonomy, 2021 to 2025
- Market Size Value (USD Million) Forecast By Market Taxonomy, 2026 to 2036
- By Country
- India
- ASEAN
- Australia & New Zealand
- Rest of South Asia and Pacific
- By Product
- By Animal
- By Disease Indication
- By Route of Administration
- By Distribution Channel
- By Country
- Market Attractiveness Analysis
- By Country
- By Product
- By Animal
- By Disease Indication
- By Route of Administration
- By Distribution Channel
- Key Takeaways
- Middle East & Africa Market Analysis 2021 to 2025 and Forecast 2026 to 2036, By Country
- Historical Market Size Value (USD Million) Trend Analysis By Market Taxonomy, 2021 to 2025
- Market Size Value (USD Million) Forecast By Market Taxonomy, 2026 to 2036
- By Country
- Kingdom of Saudi Arabia
- Other GCC Countries
- Turkiye
- South Africa
- Other African Union
- Rest of Middle East & Africa
- By Product
- By Animal
- By Disease Indication
- By Route of Administration
- By Distribution Channel
- By Country
- Market Attractiveness Analysis
- By Country
- By Product
- By Animal
- By Disease Indication
- By Route of Administration
- By Distribution Channel
- Key Takeaways
- Key Countries Market Analysis
- USA
- Pricing Analysis
- Market Share Analysis, 2025
- By Product
- By Animal
- By Disease Indication
- By Route of Administration
- By Distribution Channel
- Canada
- Pricing Analysis
- Market Share Analysis, 2025
- By Product
- By Animal
- By Disease Indication
- By Route of Administration
- By Distribution Channel
- Mexico
- Pricing Analysis
- Market Share Analysis, 2025
- By Product
- By Animal
- By Disease Indication
- By Route of Administration
- By Distribution Channel
- Brazil
- Pricing Analysis
- Market Share Analysis, 2025
- By Product
- By Animal
- By Disease Indication
- By Route of Administration
- By Distribution Channel
- Chile
- Pricing Analysis
- Market Share Analysis, 2025
- By Product
- By Animal
- By Disease Indication
- By Route of Administration
- By Distribution Channel
- Germany
- Pricing Analysis
- Market Share Analysis, 2025
- By Product
- By Animal
- By Disease Indication
- By Route of Administration
- By Distribution Channel
- UK
- Pricing Analysis
- Market Share Analysis, 2025
- By Product
- By Animal
- By Disease Indication
- By Route of Administration
- By Distribution Channel
- Italy
- Pricing Analysis
- Market Share Analysis, 2025
- By Product
- By Animal
- By Disease Indication
- By Route of Administration
- By Distribution Channel
- Spain
- Pricing Analysis
- Market Share Analysis, 2025
- By Product
- By Animal
- By Disease Indication
- By Route of Administration
- By Distribution Channel
- France
- Pricing Analysis
- Market Share Analysis, 2025
- By Product
- By Animal
- By Disease Indication
- By Route of Administration
- By Distribution Channel
- India
- Pricing Analysis
- Market Share Analysis, 2025
- By Product
- By Animal
- By Disease Indication
- By Route of Administration
- By Distribution Channel
- ASEAN
- Pricing Analysis
- Market Share Analysis, 2025
- By Product
- By Animal
- By Disease Indication
- By Route of Administration
- By Distribution Channel
- Australia & New Zealand
- Pricing Analysis
- Market Share Analysis, 2025
- By Product
- By Animal
- By Disease Indication
- By Route of Administration
- By Distribution Channel
- China
- Pricing Analysis
- Market Share Analysis, 2025
- By Product
- By Animal
- By Disease Indication
- By Route of Administration
- By Distribution Channel
- Japan
- Pricing Analysis
- Market Share Analysis, 2025
- By Product
- By Animal
- By Disease Indication
- By Route of Administration
- By Distribution Channel
- South Korea
- Pricing Analysis
- Market Share Analysis, 2025
- By Product
- By Animal
- By Disease Indication
- By Route of Administration
- By Distribution Channel
- Russia
- Pricing Analysis
- Market Share Analysis, 2025
- By Product
- By Animal
- By Disease Indication
- By Route of Administration
- By Distribution Channel
- Poland
- Pricing Analysis
- Market Share Analysis, 2025
- By Product
- By Animal
- By Disease Indication
- By Route of Administration
- By Distribution Channel
- Hungary
- Pricing Analysis
- Market Share Analysis, 2025
- By Product
- By Animal
- By Disease Indication
- By Route of Administration
- By Distribution Channel
- Kingdom of Saudi Arabia
- Pricing Analysis
- Market Share Analysis, 2025
- By Product
- By Animal
- By Disease Indication
- By Route of Administration
- By Distribution Channel
- Turkiye
- Pricing Analysis
- Market Share Analysis, 2025
- By Product
- By Animal
- By Disease Indication
- By Route of Administration
- By Distribution Channel
- South Africa
- Pricing Analysis
- Market Share Analysis, 2025
- By Product
- By Animal
- By Disease Indication
- By Route of Administration
- By Distribution Channel
- USA
- Market Structure Analysis
- Competition Dashboard
- Competition Benchmarking
- Market Share Analysis of Top Players
- By Regional
- By Product
- By Animal
- By Disease Indication
- By Route of Administration
- By Distribution Channel
- Competition Analysis
- Competition Deep Dive
- Zoetis Services LLC.
- Overview
- Product Portfolio
- Profitability by Market Segments (Product/Age /Sales Channel/Region)
- Sales Footprint
- Strategy Overview
- Marketing Strategy
- Product Strategy
- Channel Strategy
- Merck & Co., Inc. (MSD Animal Health)
- Bioveta, Inc.
- Elanco (Eli Lilly)
- Ceva
- Boehringer Ingelheim International GmbH
- Kemin Industries, Inc.
- HESTER BIOSCIENCES LIMITED
- Phibro Animal Health Corporation
- Virbac
- LETI Pharma
- Ourofino
- HIPRA
- Jinyu Biotechnology Co., Ltd.
- Indian Immunologicals Ltd.
- Vaxxinova
- Biogénesis Bagó
- Zoetis Services LLC.
- Competition Deep Dive
- Assumptions & Acronyms Used


