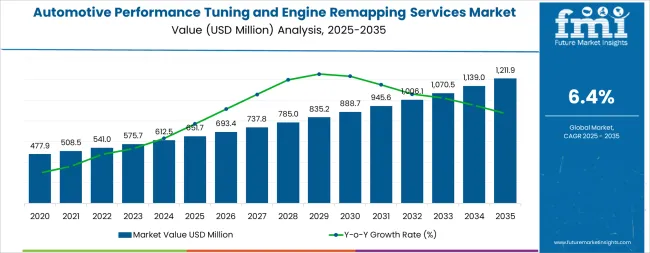
The automotive performance tuning and engine remapping services market is anticipated to experience steady growth from 2025 to 2035, with a CAGR of 6.4%. Market value is expected to rise from USD 651.7 million in 2025 to USD 1,208.1 million in 2035. The growth pattern suggests moderate peaks and troughs, reflecting periods of increased demand aligned with automotive sales cycles, new model launches, and seasonal upgrades. Demand is influenced by consumer interest in enhancing engine efficiency, improving performance output, and optimizing fuel consumption. Service providers are likely to expand offerings with advanced software solutions and tailored remapping packages, contributing to periodic surges in market activity.
From 2025 to 2030, the market may show modest peaks corresponding to periods of higher vehicle sales and promotions in aftermarket services, followed by brief slowdowns as seasonal demand stabilizes. The troughs are expected to remain shallow, reflecting consistent baseline demand from both passenger and commercial vehicle segments. Between 2030 and 2035, peaks may become slightly more pronounced as technological advancements in engine control systems and increased adoption of performance tuning services drive stronger interest. Despite these fluctuations, the overall trajectory maintains a steady upward trend, with troughs gradually rising over time. The pattern indicates reliable long-term growth, where incremental peaks and troughs demonstrate natural market cycles without major volatility, ensuring sustained expansion over the ten-year period.
The automotive performance tuning and engine remapping services market is primarily divided into two parent segments: Original Equipment Manufacturers (OEMs) and the aftermarket sector. The OEM segment holds a dominant share, accounting for approximately 70% of the market. This dominance is driven by established partnerships with automakers, ensuring a steady demand for performance tuning and remapping services during vehicle production. The aftermarket segment, comprising about 30% of the market, caters to consumers seeking customization and enhanced performance for their vehicles. This sector's growth is fueled by the increasing popularity of vehicle modifications and the demand for personalized driving experiences.
Recent trends in the automotive performance tuning and engine remapping services market indicate a shift towards advanced technologies and eco-performance solutions. Stage 1 tuning, which focuses on optimizing existing engine parameters, is gaining popularity due to its accessibility and compliance advantages. There is a growing demand for hybrid vehicle performance tuning, driven by the need for improved fuel efficiency and reduced emissions. These developments reflect the industry's adaptation to technological advancements and changing consumer preferences, emphasizing performance, sustainability, and regulatory compliance.
| Metric | Value |
|---|---|
| Market Value (2025) | USD 651.7 million |
| Market Forecast (2035) | USD 1,208.1 million |
| Growth Rate | 6.4% CAGR |
| Leading Vehicle Type | Passenger Vehicles |
| Fastest Growing Segment | Hybrid Vehicles (7.2% CAGR) |
The market demonstrates strong fundamentals with Passenger Vehicles capturing dominant demand through widespread performance enhancement adoption and growing enthusiast community engagement. Hybrid vehicle tuning drives the fastest growth trajectory, supported by increasing hybrid vehicle sales and owner demands for optimized performance-efficiency balance. Geographic expansion remains concentrated in developed automotive markets with established tuning cultures, while emerging economies show accelerating adoption rates driven by rising disposable incomes and growing automotive enthusiast communities.
Market expansion rests on three fundamental shifts driving adoption across the automotive aftermarket and performance sectors.
The growth faces headwinds from warranty concerns that vary across manufacturers regarding aftermarket modifications and tuning service protocols, which may limit adoption flexibility among new vehicle owners concerned about manufacturer warranty coverage. Regulatory restrictions also persist regarding emission compliance and vehicle modification legality that may reduce market opportunities in jurisdictions with strict automotive modification regulations. Technical complexity increases with advanced powertrains requiring specialized knowledge and equipment that limit service provider capabilities.
The automotive performance tuning and engine remapping services market represents a transformative growth opportunity, expanding from USD 651.7 million in 2025 to USD 1.21 billion by 2035 at a 6.4% CAGR. As vehicle owners worldwide prioritize performance optimization, fuel efficiency enhancement, and driving experience personalization, tuning services have evolved from niche modifications to mainstream aftermarket offerings, enabling power gains, torque improvements, and customized driving characteristics across gasoline, diesel, hybrid, and emerging electric vehicle platforms.
The convergence of vehicle connectivity advancement, increasing consumer awareness of ECU tuning benefits, aftermarket technology maturation, and regulatory acceptance of compliant performance modifications creates unprecedented adoption momentum. Advanced remapping solutions offering verified performance gains, emission compliance maintenance, and reversible modifications will capture premium market positioning, while geographic expansion into emerging automotive markets and scalable mobile tuning services will drive volume leadership. Digital platform integration and remote tuning capabilities provide structural support.
Leading with strong market presence through widespread adoption among automotive enthusiasts, daily driver optimization seekers, and performance-oriented vehicle owners, passenger vehicle tuning enables comprehensive performance enhancement across diverse vehicle segments from economy cars to luxury sports vehicles. Advanced offerings including multi-stage tuning programs, customizable performance maps, and data logging capabilities command premium pricing while delivering measurable power and torque improvements. Expected revenue pool: USD 680-750 million.
Dominating growth trajectory with 7.2% CAGR, hybrid vehicle applications drive fastest expansion through specialized tuning for hybrid powertrains, optimized electric-combustion coordination, and enhanced efficiency-performance balance. Specialized services for plug-in hybrid optimization, hybrid battery management enhancement, and regenerative braking tuning that improve both performance and fuel economy capture significant premiums from environmentally-conscious performance enthusiasts and efficiency-seeking fleet operators. Opportunity: USD 180-220 million.
The United States (6.9% CAGR) leads regional growth through large automotive enthusiast community, extensive performance shop network, and strong tuning culture across muscle cars, trucks, and import performance segments. Strategic positioning enabling compliance with EPA regulations, state-specific emission requirements, and cost-effective solutions tailored for American vehicle preferences capture expanding demand. Geographic expansion upside: USD 280-340 million.
European Union markets (6.0% CAGR including Germany and Italy) represent substantial opportunity through established tuning tradition, diesel performance optimization demand, and luxury vehicle enhancement focus. Advanced remapping for European performance brands, TDI optimization expertise, and compliance with Euro emission standards create differentiated value propositions with premium pricing potential. Revenue opportunity: USD 240-290 million.
Technology advancement drives demand for mobile tuning services, cloud-based ECU remapping, and remote flash programming capabilities. Advanced solutions supporting at-home tuning installations, over-the-air updates, and smartphone-controlled performance adjustments expand addressable markets beyond traditional performance shop limitations. Technology advancement pool: USD 150-190 million.
Growing demand for commercial vehicle tuning enabling fuel efficiency optimization, payload performance enhancement, and fleet cost reduction. Solutions supporting truck and van remapping, delivery vehicle optimization, and commercial fleet management integration create new market opportunities with B2B pricing models. Commercial segment opportunity: USD 120-160 million.
Emerging electric vehicle tuning services addressing performance optimization, range enhancement, and charging efficiency improvement. EV-specific offerings supporting motor controller optimization, battery thermal management tuning, and regenerative braking customization expand addressable markets with next-generation premium positioning. EV tuning pool: USD 80-120 million.
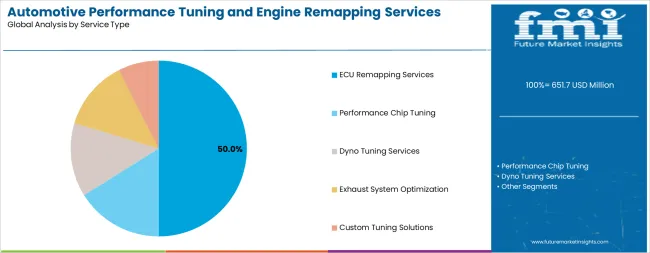
The market segments by service type into ECU Remapping Services, Performance Chip Tuning, Dyno Tuning Services, Exhaust System Optimization, and Custom Tuning Solutions, representing the evolution from basic chip modifications to comprehensive engine management optimization approaches.
Vehicle type segmentation divides the market into Passenger Vehicles, Light Commercial Vehicles, Heavy Commercial Vehicles, and Motorcycles, reflecting distinct requirements for consumer performance enhancement, fleet optimization, commercial efficiency improvement, and motorsport applications.
Fuel type segmentation encompasses Gasoline, Diesel, Hybrid, and Electric Vehicle categories, addressing the diverse powertrain landscape and specialized tuning requirements across different propulsion technologies.
Geographic distribution covers North America, Europe, Asia Pacific, Latin America, and Middle East & Africa, with developed markets leading adoption while emerging economies show accelerating growth patterns driven by rising automotive enthusiasm and disposable income growth.
The segmentation structure reveals technology progression from traditional mechanical chip tuning toward sophisticated digital ECU remapping and cloud-based optimization platforms, while application diversity spans from individual enthusiast modifications to commercial fleet efficiency programs requiring data-driven performance management.
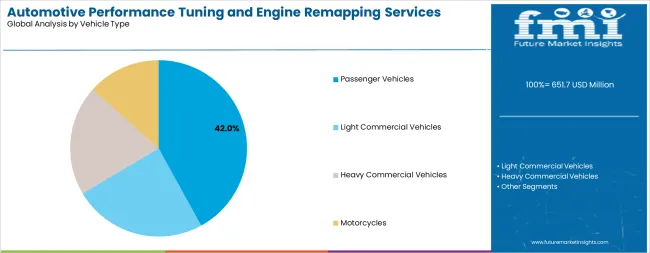
Market Position: Passenger Vehicles command the leading position in the Automotive Performance Tuning and Engine Remapping Services market through widespread adoption among automotive enthusiasts, performance-seeking daily drivers, and vehicle personalization advocates who seek enhanced driving experiences, improved acceleration, and customized performance characteristics without extensive mechanical modifications.
Value Drivers: The segment benefits from large addressable market of passenger car owners globally, growing awareness of ECU tuning benefits through online communities and social media influence, and relatively straightforward tuning processes for common passenger vehicle platforms. Passenger vehicle tuning services enable power gains ranging from 15-40% depending on vehicle type and modification scope, delivering compelling value propositions at moderate cost compared to hardware upgrades.
Competitive Advantages: Passenger vehicle tuning differentiates through established tuning maps for popular vehicle models, proven performance gains with documented customer results, and minimal impact on daily drivability when professionally executed. Service providers benefit from economies of scale serving high-volume vehicle platforms and established tuning protocols for mainstream automotive brands.
Market Context: Hybrid vehicle tuning represents the fastest-growing segment in the Automotive Performance Tuning and Engine Remapping Services market with 7.2% CAGR due to rapidly increasing hybrid vehicle sales worldwide and growing owner awareness that hybrid powertrains offer unique optimization opportunities balancing performance enhancement with efficiency improvement through specialized ECU remapping approaches.
Appeal Factors: Hybrid vehicle owners prioritize tuning solutions that optimize electric motor-combustion engine coordination, enhance hybrid system efficiency, and improve power delivery characteristics while maintaining or improving fuel economy. The segment benefits from hybrid technology maturation and sophisticated engine management systems that offer extensive optimization parameters for experienced tuning professionals.
Growth Drivers: Global hybrid vehicle sales growth creates expanding customer base for specialized tuning services. Manufacturers' conservative factory tuning calibrations leave significant optimization potential that aftermarket tuning services can unlock. Growing environmental consciousness drives demand for performance solutions that maintain or improve efficiency metrics alongside power enhancements.
Market Challenges: Limited tuning expertise for hybrid powertrains among traditional performance shops may restrict service availability. Complex hybrid systems require specialized diagnostic equipment and training investments that create barriers to market entry.
Growth Accelerators: Vehicle performance optimization drives primary adoption as ECU remapping services provide cost-effective power and torque improvements that enhance driving experience without expensive mechanical modifications, supporting automotive enthusiast pursuits and daily driver improvement missions that require accessible performance enhancement. The demand for fuel efficiency improvement accelerates market expansion as tuning services increasingly focus on optimizing engine efficiency alongside performance gains, minimizing fuel consumption while maintaining or improving power delivery characteristics. Social media influence and online communities create sustained awareness of tuning benefits through documented results, video demonstrations, and enthusiast testimonials that normalize performance modifications across mainstream vehicle owners.
Growth Inhibitors: Warranty concerns vary across manufacturers and dealers regarding aftermarket ECU modifications and potential warranty denial, which may limit adoption flexibility among new vehicle owners and lease customers concerned about manufacturer support. Regulatory compliance challenges persist regarding emission standards and vehicle modification legality in jurisdictions with strict automotive regulations, potentially limiting market opportunities and requiring compliant tuning strategies. Technical expertise requirements increase with modern powertrain complexity, creating service quality variability between professional tuning shops and limiting DIY market accessibility.
Market Evolution Patterns: Adoption accelerates in automotive enthusiast segments and performance vehicle categories where tuning delivers measurable benefits, with geographic concentration in markets with established tuning cultures transitioning toward mainstream acceptance in emerging automotive markets driven by social media exposure and growing middle-class vehicle ownership. Technology development focuses on remote tuning capabilities, mobile service delivery, and cloud-based tuning platforms that optimize accessibility and convenience. Market dynamics shift toward hybrid and electric vehicle tuning as powertrain electrification accelerates, requiring specialized knowledge and equipment investments from service providers.
The automotive performance tuning and engine remapping services market demonstrates varied regional dynamics with Growth Leaders including the United States (6.9% CAGR) driving expansion through large automotive enthusiast community and established performance culture. Steady Performers encompass Germany, Italy (6.1% and 6.0% CAGR) benefiting from strong tuning tradition and diesel performance focus. Emerging Markets feature South Korea (5.7% CAGR), United Kingdom (5.4% CAGR), and Japan (5.1% CAGR), where specialized automotive applications and growing enthusiast communities support consistent growth patterns.
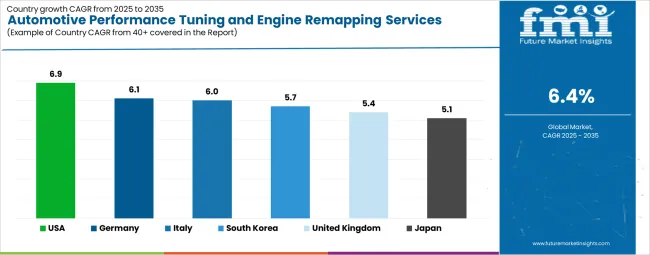
| Country/Region | CAGR (2025-2035) |
|---|---|
| United States | 6.9% |
| Germany | 6.1% |
| Italy | 6.0% |
| South Korea | 5.7% |
| United Kingdom | 5.4% |
| Japan | 5.1% |
Regional synthesis reveals North American markets leading growth through large vehicle ownership base and performance-oriented automotive culture, while European countries maintain strong presence supported by established tuning industry and diesel optimization demand. Asian markets show moderate growth driven by rising automotive enthusiasm and increasing disposable incomes supporting aftermarket spending.
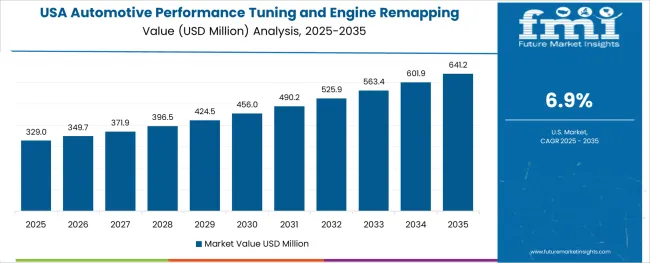
The United States establishes market leadership through the world's largest automotive enthusiast community and deeply rooted performance modification culture spanning muscle car heritage, import tuner scene, and truck performance segments. The country's 6.9% CAGR through 2035 reflects strong consumer demand for vehicle personalization and performance enhancement across diverse vehicle categories from domestic V8 platforms to turbocharged imports and diesel trucks. Growth concentrates in major metropolitan areas and automotive enthusiast hubs including Southern California, Texas, Florida, and the Northeast corridor, where performance shops and mobile tuning services showcase advanced ECU remapping capabilities that appeal to enthusiasts seeking competitive advantages and daily drivers wanting improved performance.
American tuning companies are deploying sophisticated remapping solutions that combine dyno-verified performance gains with EPA-compliant calibrations, particularly important in markets with emission testing requirements. Distribution channels through performance shops, dealership aftermarket departments, and direct-to-consumer platforms expand market access, while growing social media presence and influencer marketing drive adoption across younger demographic segments.
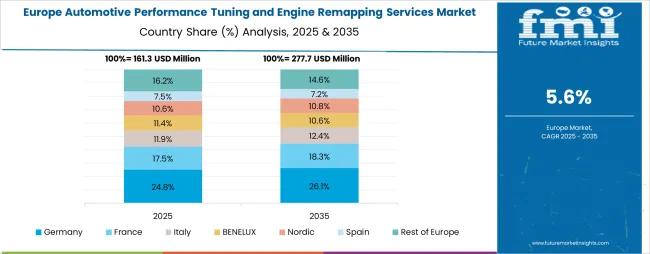
In Munich, Stuttgart, and across German automotive regions, performance tuning shops and specialized ECU remapping centers are implementing advanced optimization services for European performance vehicles, luxury brands, and diesel powertrains, driven by Germany's established tuning culture and engineering excellence. The market is projected to demonstrate a 6.1% CAGR through 2035, supported by strong domestic automotive industry presence and German consumer preference for vehicle optimization that enhances both performance and efficiency characteristics. German tuning specialists are adopting advanced remapping technologies that provide sophisticated power delivery optimization, diesel economy enhancement, and luxury vehicle performance improvements, particularly appealing in markets where Audi, BMW, Mercedes-Benz, Porsche, and Volkswagen vehicles dominate performance modification segments.
Market expansion benefits from established tuning industry infrastructure and strong cultural acceptance of performance modifications as legitimate automotive enhancements rather than questionable alterations. Technology adoption follows patterns established in motorsport heritage, where performance optimization and engineering precision drive service quality standards and customer expectations.
Italy's market demonstrates 6.0% CAGR through 2035, distinguished by strong automotive passion culture, exotic performance vehicle concentration, and established tuning tradition focused on Italian sports car brands and modified compact vehicles. Performance shops in Milan, Turin, and throughout automotive regions showcase specialized tuning capabilities for Ferrari, Lamborghini, Maserati, Alfa Romeo, and Fiat performance applications.
Market dynamics reflect Italian automotive enthusiasm and preference for driving dynamics optimization. Growing integration of modern tuning technologies with traditional Italian performance modification culture creates demand for sophisticated ECU remapping services that enhance power delivery characteristics while maintaining brand-specific driving feel and characteristics.
South Korea's advanced automotive market demonstrates sophisticated tuning deployment with documented performance effectiveness in domestic performance vehicles and import platforms through integration with Korean automotive technology and growing enthusiast community. The country leverages technology adoption capabilities and automotive manufacturing expertise to maintain a 5.7% CAGR through 2035. Major cities including Seoul, Busan, and Incheon showcase advanced tuning installations where ECU remapping integrates with vehicle modification culture spanning Korean performance platforms like Hyundai N and Kia sports models alongside imported performance vehicles.
Korean tuning specialists prioritize technology integration and performance verification through comprehensive dyno testing and data logging, creating demand for proven remapping services with documented results and performance guarantees. The market benefits from young demographic adoption of automotive modification culture influenced by international tuning trends and social media exposure.
In London, Manchester, Birmingham, and throughout British automotive regions, UK tuning specialists and ECU remapping centers are implementing advanced optimization services to enhance vehicle performance and support enthusiast modification culture that aligns with UK automotive traditions and motorsport heritage. The UK market is expected to demonstrate sustained growth with a 5.4% CAGR through 2035, driven by strong modified car culture and vehicle personalization trends that emphasize performance enhancement alongside visual modifications. British performance shops are prioritizing ECU remapping services that provide measurable power gains while maintaining MOT compliance and vehicle reliability, particularly important in markets where modified vehicles face regulatory scrutiny and insurance considerations.
Market expansion benefits from established UK tuning industry and strong online presence of British tuning companies serving domestic and international markets. The regulatory framework requires careful tuning approaches that balance performance gains with emission compliance and insurance disclosure requirements.
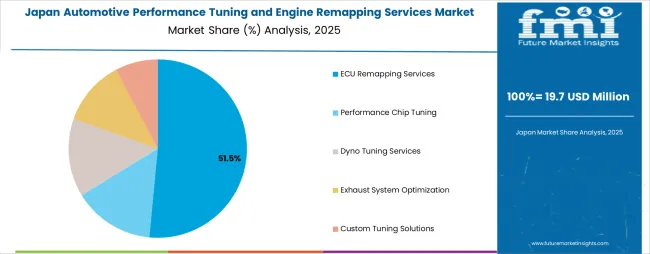
Japan demonstrates steady market development with a 5.1% CAGR through 2035, distinguished by automotive enthusiasts' preference for high-quality tuning services that integrate seamlessly with Japanese vehicle platforms and provide reliable long-term performance in specialized automotive applications. The market prioritizes advanced features, including precision fuel mapping, boost control optimization, and integration with comprehensive vehicle data systems that reflect Japanese automotive expectations for technological sophistication and modification excellence.
Japanese tuning specialists leverage decades of performance modification heritage from JDM (Japanese Domestic Market) tuning culture, creating demand for expert-level ECU remapping that enhances turbocharged engine performance, naturally aspirated engine efficiency, and hybrid powertrain optimization across Toyota, Honda, Nissan, Subaru, and Mazda platforms.
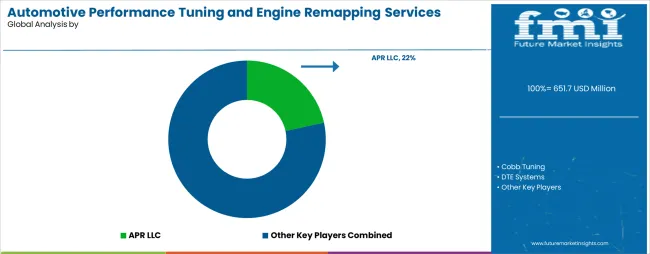
The automotive performance tuning and engine remapping services market operates with moderate fragmentation, featuring approximately 200+ meaningful participants globally, where leading companies control roughly 35-42% of the global market share through established brand recognition, extensive vehicle platform support, and proven performance results. Competition emphasizes dyno-verified performance gains, customer satisfaction track records, and vehicle-specific tuning expertise rather than price-based rivalry.
Market Leaders encompass APR LLC, Cobb Tuning, DTE Systems, Revo Technik, and RaceChip, which maintain competitive advantages through extensive vehicle platform databases, proven tuning solutions for popular performance vehicles, and established distribution networks spanning performance shops, online direct sales, and dealer partnerships. These companies leverage decades of tuning experience and ongoing development investments to create optimized ECU maps with verified power gains and extensive customer testimonials supporting market positioning.
Technology Challengers include companies competing through specialized platform focus, innovative tuning delivery methods, and mobile service approaches that appeal to customers seeking convenient optimization solutions and niche vehicle expertise. These companies differentiate through rapid new vehicle platform support, aggressive performance claims, and competitive pricing strategies targeting budget-conscious enthusiasts.
Regional Specialists feature companies focusing on specific geographic markets and vehicle brand specialization, including German luxury vehicle tuning experts, American muscle car specialists, and Japanese import platform experts. Market dynamics favor participants that combine proven performance results with excellent customer service, comprehensive warranty programs, and emission-compliant tuning strategies. Competitive pressure intensifies as vehicle connectivity enables remote tuning capabilities and over-the-air update delivery models. Traditional performance shop services face disruption from mobile tuning providers and direct-to-consumer tuning solutions reducing traditional distribution channel dependencies.
| Quantitative Units | USD 651.7 million (2025) |
|---|---|
| Service Type | ECU Remapping Services, Performance Chip Tuning, Dyno Tuning Services, Exhaust System Optimization, Custom Tuning Solutions |
| Vehicle Type | Passenger Vehicles, Light Commercial Vehicles, Heavy Commercial Vehicles, Motorcycles |
| Fuel Type | Gasoline, Diesel, Hybrid, Electric |
| End User | Individual Vehicle Owners, Performance Shops, Dealerships, Fleet Operators |
| Regions Covered | North America, Europe, Asia Pacific, Latin America, Middle East & Africa |
| Countries Covered | United States, Germany, Italy, United Kingdom, Japan, South Korea, and 20+ additional countries |
| Key Companies Profiled | APR LLC, Cobb Tuning, DTE Systems, Revo Technik, RaceChip, Unitronic, EcuTek Technologies, Dinan Engineering, and others |
| Additional Attributes | Dollar sales by service type, vehicle type, and fuel type categories, regional adoption trends across North America, Europe, and Asia Pacific, competitive landscape with tuning specialists and performance aftermarket providers, customer preferences for power gains and reliability balance, integration with vehicle diagnostic systems and performance monitoring, innovations in remote tuning delivery and cloud-based ECU optimization, and development of emission-compliant performance solutions with reversible modifications. |
How big is the automotive performance tuning and engine remapping services market in 2025? The global automotive performance tuning and engine remapping services market is valued at USD 651.7 million in 2025.
What will be the size of the automotive performance tuning and engine remapping services market in 2035?
The size of the automotive performance tuning and engine remapping services market is projected to reach USD 1,208.1 million by 2035.
How much will the automotive performance tuning and engine remapping services market grow between 2025 and 2035?
The automotive performance tuning and engine remapping services market is expected to grow at a 6.4% CAGR between 2025 and 2035.
What are the key service type segments in the automotive performance tuning and engine remapping services market?
The key service type segments include ECU remapping services, performance chip tuning, dyno tuning services, exhaust system optimization, and custom tuning solutions.
Which vehicle type segment is expected to contribute a significant share to the market in 2025? Passenger Vehicles are expected to command the dominant share in the automotive performance tuning and engine remapping services market with strong growth at 6.6% CAGR.
The global automotive performance tuning and engine remapping services market is estimated to be valued at USD 651.7 million in 2025.
The market size for the automotive performance tuning and engine remapping services market is projected to reach USD 1,211.9 million by 2035.
The automotive performance tuning and engine remapping services market is expected to grow at a 6.4% CAGR between 2025 and 2035.
The key product types in automotive performance tuning and engine remapping services market are ecu remapping services, performance chip tuning, dyno tuning services, exhaust system optimization and custom tuning solutions.
In terms of vehicle type, passenger vehicles segment to command 42.0% share in the automotive performance tuning and engine remapping services market in 2025.


Full Research Suite comprises of:
Market outlook & trends analysis
Interviews & case studies
Strategic recommendations
Vendor profiles & capabilities analysis
5-year forecasts
8 regions and 60+ country-level data splits
Market segment data splits
12 months of continuous data updates
DELIVERED AS:
PDF EXCEL ONLINE
Automotive Green Tires Market Size and Share Forecast Outlook 2025 to 2035
Automotive E-Tailing Market Size and Share Forecast Outlook 2025 to 2035
Automotive Interior Market Forecast Outlook 2025 to 2035
Automotive Key Market Size and Share Forecast Outlook 2025 to 2035
Automotive Appearance Chemical Market Forecast and Outlook 2025 to 2035
Automotive Seating Market Forecast and Outlook 2025 to 2035
Automotive Domain Control Module Market Forecast and Outlook 2025 to 2035
Automotive Remote Diagnostic Market Forecast and Outlook 2025 to 2035
Automotive-grade Inertial Navigation System Market Size and Share Forecast Outlook 2025 to 2035
Automotive Thin IGBT Module Market Size and Share Forecast Outlook 2025 to 2035
Automotive Hydrogen Leak Detection Sensors Market Size and Share Forecast Outlook 2025 to 2035
Automotive Hybrid IGBTs Market Size and Share Forecast Outlook 2025 to 2035
Automotive Exhaust Extraction Hose Reels Market Size and Share Forecast Outlook 2025 to 2035
Automotive Electroplating Service Market Size and Share Forecast Outlook 2025 to 2035
Automotive Manufacturing Equipment Market Size and Share Forecast Outlook 2025 to 2035
Automotive Pressure Sensor Market Size and Share Forecast Outlook 2025 to 2035
Automotive Vacuum Brake Booster Market Size and Share Forecast Outlook 2025 to 2035
Automotive Smart Antenna Market Size and Share Forecast Outlook 2025 to 2035
Automotive Actuator Market Size and Share Forecast Outlook 2025 to 2035
Automotive Exhaust Manifold Market Size and Share Forecast Outlook 2025 to 2035

Thank you!
You will receive an email from our Business Development Manager. Please be sure to check your SPAM/JUNK folder too.
Chat With
MaRIA