Industrial Valve Market Forecast and Outlook 2025 to 2035

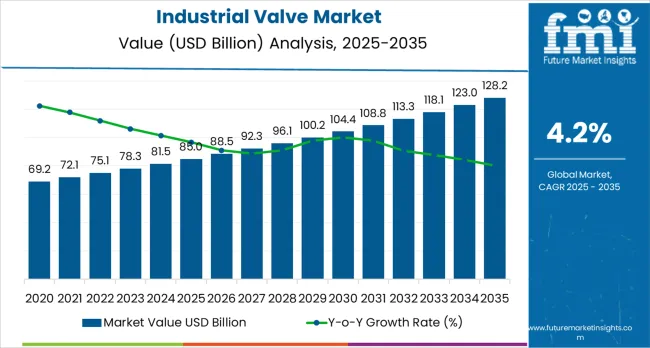
The global industrial valve market is valued at USD 84.97 billion in 2025 and is poised to expand to USD 128.22 billion by 2035, which shows a steady CAGR of 4.2% during the forecast period. The market's growth trajectory is shaped by increasing deployment across critical industries such as oil and gas, power generation, water and wastewater treatment, and chemical processing.

Additionally, stricter environmental regulations and a global push toward automation and smart industrial systems are prompting the adoption of advanced, sensor-enabled valves. The market is further supported by aging infrastructure in developed countries, which is fueling demand for valve replacement and modernization.

The market has been witnessing substantial technological advancements, leading to the adoption of smart and automated valve systems. These next-generation valves are integrated with artificial intelligence (AI) and the Industrial Internet of Things (IIoT), enabling real-time condition monitoring, predictive maintenance, and energy-efficient operations.

Such features are becoming crucial in industries aiming to reduce downtime and operational risks while complying with strict environmental and safety regulations. Geopolitical developments, the global decarbonization agenda, and reshoring trends in manufacturing have further influenced purchasing decisions, especially in developed markets like North America and Europe, where the emphasis is on replacing aging infrastructure with high-performance, durable valve solutions.

Attribute Details
Market Size in 2025 USD 84.97 billion
Market Size in 2035 USD 128.22 billion
CAGR (2025 to 2035) 4.2%

The market's steady expansion is further supported by the increasing demand for reliable flow control solutions in emerging applications such as renewable energy, hydrogen infrastructure, and advanced manufacturing processes. India's proactive policy initiatives and clean energy targets are playing a vital role in driving new installations and upgrades in the region.

Moreover, end-use industries are seeking valves capable of withstanding extreme pressures, temperatures, and corrosive environments, thereby fueling the demand for high-grade materials such as cast steel and advanced alloys. These trends are expected to sustain the market’s momentum over the coming few years.

Industrial Valve Market Analyzed by Top Investment Segments

The global industrial valve market is segmented by valve type, material, end-use industry, function, and region. By valve type, the market includes gate valves, check valves, ball valves, butterfly valves, plug valves, globe valves, safety relief valves, and other customized valves (nuclear power plants, cryogenic systems, semiconductor manufacturing, and extreme high-pressure).

Based on valve material, the market is categorized into cast steel, carbon steel, stainless steel, bronze, and other alloys (Hastelloy, Inconel, Monel, and titanium). In terms of end-use industry, the market covers the oil & gas industry, chemical industry, water & wastewater treatment industry, power plants industry, paper & pulp industry, and other industries (pharmaceuticals, food and beverage processing, mining, marine, textiles, and HVAC systems).

By function, the market is divided into manual and automatic valves. Regionally, the market analysis includes North America, Latin America, Western Europe, Eastern Europe, South Asia and Pacific, East Asia, and Middle East, and Africa.

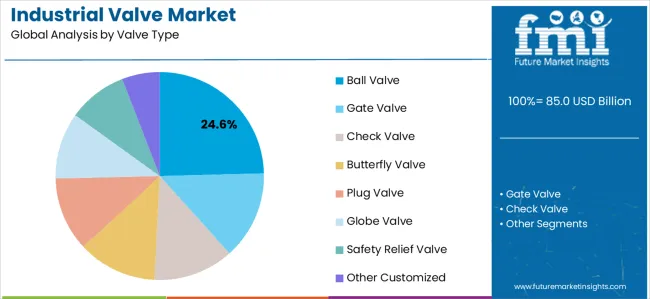
By Valve Type, Ball Valve Segment Accounts for Over 24.6% Market Share

In the global industrial valve market, ball valves hold the largest market share of 24.6% as of 2025, establishing themselves as the most preferred valve type across various industries. Their popularity stems from their exceptional versatility, ability to provide tight shutoff, and minimal pressure drop, which makes them suitable for demanding applications in oil & gas, chemical processing, power generation, and water treatment sectors.

Ball valves are specifically valued for their robust sealing performance, which ensures leak-proof operation even under high pressure and extreme temperatures. This reliability has made them indispensable in critical process control systems where safety and efficiency are paramount.

The segment's growth is further propelled by rising investments in midstream oil & gas pipeline infrastructure and expanding water treatment projects worldwide. Emerging markets such as India and Southeast Asia are particularly boosting demand, driven by rapid industrialization and urban development.

Furthermore, the integration of ball valves with smart technologies, such as sensors and IIoT-enabled systems, is transforming their functionality by enabling real-time monitoring, predictive maintenance, and enhanced process automation. These advancements are strongly aligned with global Industry 4.0 initiatives, ensuring that ball valves remain a vital component in modern industrial setups. Their combination of mechanical simplicity and digital adaptability supports their sustained growth outlook through 2035.

Valve Type  Share (2025) 
Ball valve 24.6% 

Growing Demand for Stainless Steel Due to Durability

Stainless steel valves are expected to record the highest CAGR of 4.8% between 2025 and 2035, fueled by their exceptional corrosion resistance, durability, and ability to maintain structural integrity in harsh operating environments. Their adoption is rising in industries such as pharmaceuticals, food processing, and chemicals, where hygiene, purity, and chemical stability are critical. These valves are favored for processes involving aggressive fluids or extreme temperatures, ensuring long service life and minimal maintenance.

Cast steel valves segment is driven by their robustness and cost-efficiency. They are widely utilized in high-pressure pipelines, power plants, and heavy industrial machinery, where strength and reliability are essential. Carbon steel valves remain a popular choice for general industrial applications, including water treatment, due to their balanced mechanical performance and economic pricing.

However, their usage is limited in highly corrosive environments, where material degradation risks are higher. Bronze valves cater to specialized markets such as marine and low-pressure systems, valued for their saltwater corrosion resistance and ease of machining, but they account for a smaller portion of the market. Other alloys like titanium and Hastelloy are gaining traction in nuclear, aerospace, and petrochemical sectors, but face restricted adoption due to their high production costs.

Valve Material  CAGR (2025 to 2035) 
Stainless Steel 4.8% 

Industrial Valve Gaining Demand in Water & Wastewater Treatment

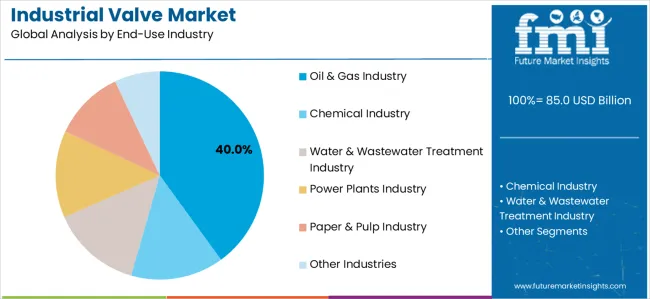
The water & wastewater treatment industry is projected to witness the highest CAGR of 4.9% from 2025 to 2035, driven by increasing investments in municipal water infrastructure, industrial effluent treatment, and desalination projects worldwide. Growing urbanization, stricter environmental regulations, and the need for sustainable water management are propelling the demand for advanced valve solutions in this sector to ensure reliable flow control and contamination prevention.

The oil & gas industry remains the largest end-use sector for industrial valves, supported by continuous exploration activities, pipeline expansions, and refinery upgrades across key regions like North America and the Middle East. Despite energy transition trends, the need for robust flow control systems in upstream and midstream operations sustains steady valve demand. The chemical industry also represents a significant market, relying on valves that can withstand corrosive fluids and extreme processing conditions to maintain operational safety and efficiency.

In power plants, especially nuclear and thermal facilities, high-performance valves are essential for maintaining pressure and temperature control, ensuring safety, and process stability. The paper & pulp industry uses specialized valves to handle abrasive and fibrous slurries efficiently. Other industries, including pharmaceuticals, food processing, and mining, collectively drive additional demand for customized valve solutions tailored to unique process requirements.

End Use Industry CAGR (2025 to 2035) 
Water & Wastewater Treatment Industry 4.9% 

Growing Automation to Increase Sales of Automatic Valves

Automatic valves are projected to register the highest CAGR of 4.7% between 2025 and 2035, fueled by the global industrial shift toward automation, smart manufacturing, and Industry 4.0 practices. These valves play a critical role in enabling real-time process control, remote operation, and predictive maintenance, which collectively improve operational safety, efficiency, and reduce downtime in complex industrial environments.

Industries such as oil & gas, chemical processing, power generation, and advanced manufacturing are increasingly adopting automatic valves to manage large-scale systems with minimal human intervention, ensuring accurate and reliable flow regulation even under challenging operating conditions.

Meanwhile, manual valves continue to maintain a significant presence in the market, favored for their cost-effectiveness and simplicity in operation. These valves are extensively used in basic industrial processes, water distribution networks, wastewater treatment plants, and low-pressure systems where operational complexity is limited and the need for automation is minimal.

Manual valves offer lower upfront costs and are easy to install and maintain, making them ideal for applications where budget constraints or operational simplicity are prioritized. However, their market growth is comparatively moderate, as industries gradually prefer automated systems for improved process optimization. Despite this trend, manual valves are expected to remain relevant in applications where automation does not justify the additional investment.

Function CAGR (2025 to 2035) 
Automatic 4.7% 

Industrial Valve Market Analysis by Top Countries

United States

In 2025, the industrial valve market in the United States is valued at approximately USD 14.2 billion, growing at a projected CAGR of 3.3% through 2035. The market is driven by large-scale replacement demand in aging oil and gas infrastructure, as well as strong adoption of smart valves across wastewater, energy, and chemical sectors.

Nuclear retrofits and LNG export terminals are significant volume drivers. Automation mandates in industrial zones and EPA regulations are accelerating the shift to automatic and corrosion-resistant valves. USA-based firms remain leaders in engineered solutions, while imports cater to standardized applications across utilities and municipal projects.

China

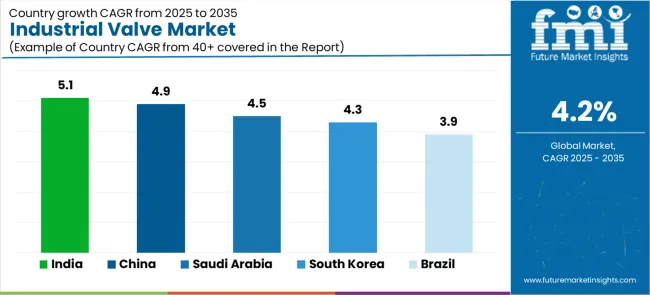
China commands an estimated USD 13.5 billion in industrial valve sales in 2025, with a projected CAGR of 4.9% over the next decade. Despite a cooling property market, ongoing investments in power generation, hydrogen, and chemicals are sustaining demand. The country leads globally in unit volume, driven by vast manufacturing clusters and infrastructure-led stimulus.

Domestic firms dominate the price-sensitive segment, while joint ventures and R&D centers aim to upgrade product quality. Demand for high-precision valves is rising in aerospace, electronics, and ultra-pure water applications. China's decarbonization efforts are pushing the adoption of advanced valve technologies in renewable energy projects.

India

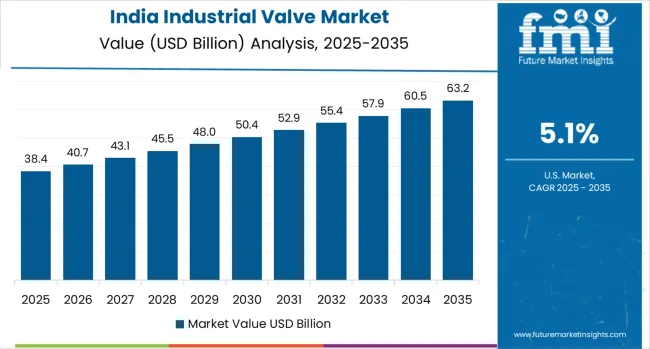
India’s industrial valve market is forecast to reach USD 9.1 billion in 2025, with the highest projected CAGR of 5.1% among major economies. Robust growth is underpinned by infrastructure expansions in oil refining, water management, and smart cities.

Government-led programs such as Gati Shakti and the Hydrogen Mission are driving procurement of valves across sectors. Domestic production is scaling up under the Make in India initiative, reducing import dependency. Key end-users include power plants, pharmaceuticals, and chemicals, with rapid urbanization accelerating municipal valve installations. Export opportunities are also growing as Indian manufacturers improve technical standards and gain traction in emerging markets.

Industrial Valve Market Country Wise Analysis

Germany

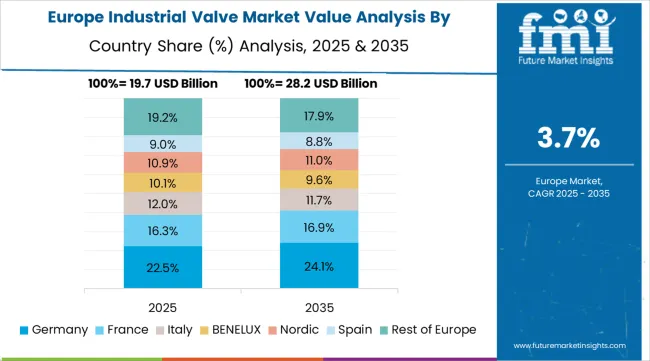
Germany is expected to generate USD 6.7 billion in industrial valve revenue in 2025, expanding at a CAGR of 3.7% through 2035. The country is a center of precision engineering, with valves playing a critical role in automotive manufacturing, chemical plants, and advanced HVAC systems.

Stringent environmental standards drive the use of automated and corrosion-resistant materials, especially in wastewater and emissions control systems. High-value segments such as pharmaceuticals and semiconductors rely on stainless steel and specialty alloy valves. Germany’s industrial sector prioritizes durability and lifecycle cost, fostering demand for engineered and customized valve solutions with compliance to EU safety norms.

Japan

Japan’s industrial valve market is projected at USD 5.8 billion in 2025, growing steadily at a CAGR of 3.6% through 2035. The market is driven by aging infrastructure across utilities, nuclear energy facilities, and manufacturing plants. With a high concentration of electronics and pharmaceutical firms, demand for stainless steel and precision control valves is robust. Local manufacturers emphasize quality, compact design, and seismic reliability.

Japan’s hydrogen and clean ammonia initiatives are also expanding the addressable market for advanced valve systems. Smart automation, remote monitoring, and space-saving actuators are widely adopted, particularly in urban and vertical plant settings.

South Korea

South Korea’s industrial valve market is valued at USD 4.3 billion in 2025, with a forecasted CAGR of 4.3% through 2035. Power generation-especially nuclear and LNG-based systems-remains a major demand driver. South Korean firms prioritize high-performance valves that can handle thermal extremes and corrosive media, especially in petrochemicals, shipbuilding, and semiconductors.

Smart city initiatives and clean hydrogen projects are further boosting demand for advanced, automated flow control systems. Domestic manufacturers are expanding exports, leveraging Korea’s global reputation for engineering quality. Government incentives for digital transformation in manufacturing plants are increasing investments in predictive maintenance and smart valve systems.

Brazil

Brazil’s industrial valve market is projected at USD 3.6 billion in 2025 and will grow at a CAGR of 3.9% through 2035. Oil and gas-especially offshore pre-salt fields-drive a large share of demand, along with pulp and paper, mining, and municipal water projects.

Currency fluctuations and import dependency pose pricing challenges, but domestic players are gaining ground through localized production and strong aftermarket support. Government sanitation projects and energy sector privatization are expected to sustain volume growth. As infrastructure spending recovers, demand for automated and corrosion-resistant valves is rising in wastewater treatment and remote pipeline monitoring applications.

Saudi Arabia

Saudi Arabia’s industrial valve market is estimated at USD 3.2 billion in 2025, expanding at a CAGR of 4.5% by 2035. The market is fueled by massive investments in oil and gas, desalination, and giga-projects like NEOM. Refinery modernization and capacity additions under Vision 2030 are major drivers of valve procurement.

The Kingdom is also ramping up renewable energy and green hydrogen capacity, creating new use cases for high-integrity valves. Corrosion-resistant materials are in high demand due to harsh operating conditions. Localization mandates are promoting joint ventures with global OEMs, shifting production closer to end-use sectors.

Canada

Canada’s industrial valve market is expected to reach USD 3.0 billion in 2025, growing at a moderate CAGR of 3.4% over the next decade. The oil sands and midstream pipeline projects in Alberta continue to dominate valve consumption. Water treatment upgrades across provinces and investments in LNG export facilities are strengthening demand for high-durability valves.

Arctic and remote-area installations require valves with enhanced thermal resistance and automation for unmanned operations. Municipal infrastructure replacement and clean-tech investments are also boosting orders for low-emission and energy-efficient valve systems. Domestic production is limited, but USA and Asian imports fill most procurement pipelines.

United Kingdom

The industrial valve market in the United Kingdom is projected to hit USD 2.8 billion in 2025, growing at a CAGR of 3.2% through 2035. Water utilities, pharmaceuticals, and the energy transition sector are the primary demand sources. With offshore wind and hydrogen storage gaining momentum, the UK is seeing higher demand for precision and safety-critical valves.

Stringent OFWAT and HSE regulations also enforce upgrades across municipal water networks and industrial steam systems. British manufacturers focus on premium segments, while imports from Europe and Asia cater to broader utility needs. The post-Brexit regulatory divergence has marginally impacted supply chain continuity and compliance costs.

Industrial Valve Market Players Share and Strategy Analysis

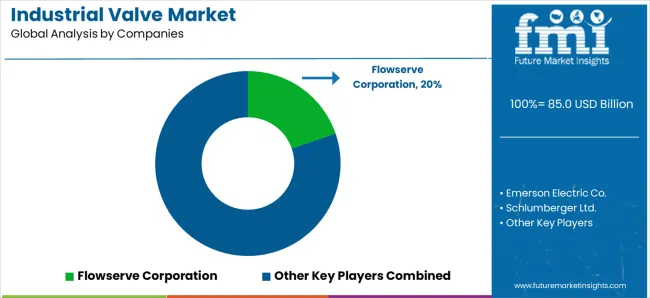
The global industrial valve market remains highly fragmented, but a handful of major players command a disproportionately large share of the high-performance and engineered valve segments. Flowserve Corporation, Emerson Electric, and Schlumberger Limited are the dominant Tier 1 players, collectively accounting for an estimated 18-22% of the global market in 2025.

Flowserve leads in after-market services and custom control valves, particularly in oil & gas and power applications. Emerson is a leader in smart valve solutions through its Fisher and ASCO product lines, driven by strong presence in North America and strategic acquisitions like Pentair Valves. Schlumberger, while better known for its oilfield services, continues to grow its valve footprint in upstream oil and LNG through its Cameron division.

Tier 2 players such as KSB SE, KITZ Corporation, CIRCOR International, and Alfa Laval hold strong regional or vertical footholds, especially in chemicals, water, and pharmaceuticals. These firms typically have 1.5% to 3.5% individual market share and differentiate via product specialization, regulatory certifications, and regional service networks.

For instance, KSB is widely respected in Europe for energy-efficient pumps and valves in municipal water systems, while KITZ dominates stainless steel valves in Japan and Southeast Asia. Many of these companies are aggressively investing in digitally enabled valve systems, targeting predictive maintenance, remote monitoring, and plug-and-play IoT compatibility as a means to move up the value chain and secure long-term service contracts.

Strategically, the industry is undergoing a shift from product-centric to solution-centric offerings. Players are bundling valves with diagnostics software, actuators, and edge computing systems to become indispensable parts of the automation ecosystem. Mergers and acquisitions remain common, especially to gain access to high-growth regions (India, Southeast Asia, and MENA) or niche applications (hydrogen-ready valves, cryogenics, biopharma).

Notably, Chinese and Indian manufacturers are beginning to eat into the commodity segment, supplying mid-quality valves at 20-30% lower price points. However, their global market share remains limited by lower acceptance in mission-critical applications. Moving forward, companies with vertically integrated production, IP in material science, and recurring revenue from MRO contracts are best positioned to consolidate market power.

Report Scope For Industrial Valve Market

Attribute Details
Market Size (2025) USD 84.97 Billion
Market Size (2035) USD 128.22 Billion
CAGR (2025 to 2035) 4.2%
Base Year 2024
Historical Coverage 2019 to 2023
Forecast Coverage 2025 to 2035
Units of Measurement Revenue-based (USD Billion)
By Valve Type Gate (Parallel, Wedge), Check (Dual Plate, Swing, Piston Lift, etc.), Ball (Trunnion, Floating, Threaded), Butterfly (High-Performance, Lined), Plug (Lubricated, Non-lubricated, Lined), Globe (Tee, Angle, Wye), Safety Relief (Spring Loaded, Pilot Operated), Others
By Material Cast Steel, Carbon Steel, Stainless Steel, Bronze, Other Alloys
By Function Manual, Automatic
By End-Use Industry Oil & Gas, Chemical, Water & Wastewater, Power, Paper & Pulp, Others
By Region North America, Latin America, Western Europe, Eastern Europe, South Asia & Pacific, East Asia, Middle East & Africa
Key Countries Covered United States, China, India, Germany, Japan, South Korea, Brazil, Saudi Arabia, Canada, United Kingdom
Top Companies Profiled Flowserve Corporation, Emerson Electric Co., Schlumberger Ltd., KSB SE, KITZ Corporation, Alfa Laval, CIRCOR International, Neway Valves, AVK Group
Competitive Metrics Market Share by Company, Strategic Initiatives, Product Innovation, M&A Activity
Key Trends Tracked IoT -Enabled Valve Adoption, Industry 4.0 Integration, Smart Infrastructure, Hydrogen & Renewables Valve Demand
Data Sources Industry Interviews, Public Financial Disclosures, Regulatory Databases, Government Infrastructure Projects, OEM Installations, Secondary Research (non-commercial)

Key Segments

By Valve Type:

  • Gate Valve
    • Parallel
    • Wedge
  • Check Valve
    • Dual Plate
    • Piston Lift
    • Spring Loaded Disk
    • Swing Check
    • Tilting Check
    • Y Pattern
    • T Pattern
  • Ball Valve
    • Trunnion
    • Floating
    • Threaded Series
  • Butterfly Valve
    • High Performance
    • Lined
  • Plug Valve
    • Lined
    • Lubricated
    • Non-Lubricated
  • Globe Valve
    • Tee
    • Angle
    • Wye
  • Safety Relief Valve
    • Spring Loaded
    • Pilot Operated
  • Other Customized

By Valve Material:

  • Cast Steel
  • Carbon Steel
  • Stainless Steel
  • Bronze
  • Other Alloys

By End-Use Industry:

  • Oil & Gas Industry
  • Chemical Industry
  • Water & Wastewater Treatment Industry
  • Power Plants Industry
  • Paper & Pulp Industry
  • Other Industries

By Function:

  • Manual
  • Automatic

By Region:

  • North America
  • Latin America
  • Western Europe
  • Eastern Europe
  • South Asia and Pacific
  • East Asia
  • Middle East and Africa

Table of Content

  1. Executive Summary
  2. Market Overview
  3. Market Background
  4. Global Market Analysis 2020 to 2024 and Forecast, 2025 to 2035
  5. Global Market Analysis 2020 to 2024 and Forecast 2025 to 2035, By Valve Type
    • Gate Valve
      • Parallel
      • Wedge
    • Check Valve
      • Dual Plate
      • Piston Lift
      • Spring Loaded Disk
      • Swing Check
      • Tilting Check
      • Y Pattern
      • T Pattern
    • Ball Valve
      • Trunnion
      • Floating
      • Threaded Series
    • Butterfly Valve
      • High Performance
      • Lined
    • Plug Valve
      • Lined
      • Lubricated
      • Non-Lubricated
    • Globe Valve
      • Tee
      • Angle
      • Wye
    • Safety Relief Valve
      • Spring Loaded
      • Pilot Operated
    • Other Customized
  6. Global Market Analysis 2020 to 2024 and Forecast 2025 to 2035, By Valve Material
    • Cast Steel
    • Carbon Steel
    • Stainless Steel
    • Bronze
    • Other Alloys
  7. Global Market Analysis 2020 to 2024 and Forecast 2025 to 2035, By End-Use Industry
    • Oil & Gas Industry
    • Chemical Industry
    • Water & Wastewater Treatment Industry
    • Power Plants Industry
    • Paper & Pulp Industry
    • Other Industries
  8. Global Market Analysis 2020 to 2024 and Forecast 2025 to 2035, By Function
    • Manual
    • Automatic
  9. Global Market Analysis 2020 to 2024 and Forecast 2025 to 2035, By Region
    • North America
    • Latin America
    • Western Europe
    • Eastern Europe
    • South Asia and Pacific
    • East Asia
    • Middle East and Africa
  10. North America Market Analysis 2020 to 2024 and Forecast 2025 to 2035, By Country
  11. Latin America Market Analysis 2020 to 2024 and Forecast 2025 to 2035, By Country
  12. Western Europe Market Analysis 2020 to 2024 and Forecast 2025 to 2035, By Country
  13. Eastern Europe Market Analysis 2020 to 2024 and Forecast 2025 to 2035, By Country
  14. South Asia and Pacific Market Analysis 2020 to 2024 and Forecast 2025 to 2035, By Country
  15. East Asia Market Analysis 2020 to 2024 and Forecast 2025 to 2035, By Country
  16. Middle East and Africa Market Analysis 2020 to 2024 and Forecast 2025 to 2035, By Country
  17. Key Countries Market Analysis
  18. Market Structure Analysis
  19. Competition Analysis
    • GE Company
    • Emerson
    • Flowserve Corporation
    • Schlumberger Limited
    • TechnipFMC Plc
    • KSB SE & Co. KGaA
    • KITZ Corporation
    • Alfa Laval Corporate AB
    • Curtiss-Wright Corp.
    • CIRCOR International, Inc.
    • Oilwell Varco, Inc.
  20. Assumptions & Acronyms Used
  21. Research Methodology

List of Tables

Table 1: Global Market Value (US$ Million) Forecast by Region, 2019 to 2034

Table 2: Global Market Volume (Units) Forecast by Region, 2019 to 2034

Table 3: Global Market Value (US$ Million) Forecast by Valve Type, 2019 to 2034

Table 4: Global Market Volume (Units) Forecast by Valve Type, 2019 to 2034

Table 5: Global Market Value (US$ Million) Forecast by Valve Material, 2019 to 2034

Table 6: Global Market Volume (Units) Forecast by Valve Material, 2019 to 2034

Table 7: Global Market Value (US$ Million) Forecast by End-Use Industry, 2019 to 2034

Table 8: Global Market Volume (Units) Forecast by End-Use Industry, 2019 to 2034

Table 9: Global Market Value (US$ Million) Forecast by Function, 2019 to 2034

Table 10: Global Market Volume (Units) Forecast by Function, 2019 to 2034

Table 11: North America Market Value (US$ Million) Forecast by Country, 2019 to 2034

Table 12: North America Market Volume (Units) Forecast by Country, 2019 to 2034

Table 13: North America Market Value (US$ Million) Forecast by Valve Type, 2019 to 2034

Table 14: North America Market Volume (Units) Forecast by Valve Type, 2019 to 2034

Table 15: North America Market Value (US$ Million) Forecast by Valve Material, 2019 to 2034

Table 16: North America Market Volume (Units) Forecast by Valve Material, 2019 to 2034

Table 17: North America Market Value (US$ Million) Forecast by End-Use Industry, 2019 to 2034

Table 18: North America Market Volume (Units) Forecast by End-Use Industry, 2019 to 2034

Table 19: North America Market Value (US$ Million) Forecast by Function, 2019 to 2034

Table 20: North America Market Volume (Units) Forecast by Function, 2019 to 2034

Table 21: Latin America Market Value (US$ Million) Forecast by Country, 2019 to 2034

Table 22: Latin America Market Volume (Units) Forecast by Country, 2019 to 2034

Table 23: Latin America Market Value (US$ Million) Forecast by Valve Type, 2019 to 2034

Table 24: Latin America Market Volume (Units) Forecast by Valve Type, 2019 to 2034

Table 25: Latin America Market Value (US$ Million) Forecast by Valve Material, 2019 to 2034

Table 26: Latin America Market Volume (Units) Forecast by Valve Material, 2019 to 2034

Table 27: Latin America Market Value (US$ Million) Forecast by End-Use Industry, 2019 to 2034

Table 28: Latin America Market Volume (Units) Forecast by End-Use Industry, 2019 to 2034

Table 29: Latin America Market Value (US$ Million) Forecast by Function, 2019 to 2034

Table 30: Latin America Market Volume (Units) Forecast by Function, 2019 to 2034

Table 31: Western Europe Market Value (US$ Million) Forecast by Country, 2019 to 2034

Table 32: Western Europe Market Volume (Units) Forecast by Country, 2019 to 2034

Table 33: Western Europe Market Value (US$ Million) Forecast by Valve Type, 2019 to 2034

Table 34: Western Europe Market Volume (Units) Forecast by Valve Type, 2019 to 2034

Table 35: Western Europe Market Value (US$ Million) Forecast by Valve Material, 2019 to 2034

Table 36: Western Europe Market Volume (Units) Forecast by Valve Material, 2019 to 2034

Table 37: Western Europe Market Value (US$ Million) Forecast by End-Use Industry, 2019 to 2034

Table 38: Western Europe Market Volume (Units) Forecast by End-Use Industry, 2019 to 2034

Table 39: Western Europe Market Value (US$ Million) Forecast by Function, 2019 to 2034

Table 40: Western Europe Market Volume (Units) Forecast by Function, 2019 to 2034

Table 41: Eastern Europe Market Value (US$ Million) Forecast by Country, 2019 to 2034

Table 42: Eastern Europe Market Volume (Units) Forecast by Country, 2019 to 2034

Table 43: Eastern Europe Market Value (US$ Million) Forecast by Valve Type, 2019 to 2034

Table 44: Eastern Europe Market Volume (Units) Forecast by Valve Type, 2019 to 2034

Table 45: Eastern Europe Market Value (US$ Million) Forecast by Valve Material, 2019 to 2034

Table 46: Eastern Europe Market Volume (Units) Forecast by Valve Material, 2019 to 2034

Table 47: Eastern Europe Market Value (US$ Million) Forecast by End-Use Industry, 2019 to 2034

Table 48: Eastern Europe Market Volume (Units) Forecast by End-Use Industry, 2019 to 2034

Table 49: Eastern Europe Market Value (US$ Million) Forecast by Function, 2019 to 2034

Table 50: Eastern Europe Market Volume (Units) Forecast by Function, 2019 to 2034

Table 51: South Asia and Pacific Market Value (US$ Million) Forecast by Country, 2019 to 2034

Table 52: South Asia and Pacific Market Volume (Units) Forecast by Country, 2019 to 2034

Table 53: South Asia and Pacific Market Value (US$ Million) Forecast by Valve Type, 2019 to 2034

Table 54: South Asia and Pacific Market Volume (Units) Forecast by Valve Type, 2019 to 2034

Table 55: South Asia and Pacific Market Value (US$ Million) Forecast by Valve Material, 2019 to 2034

Table 56: South Asia and Pacific Market Volume (Units) Forecast by Valve Material, 2019 to 2034

Table 57: South Asia and Pacific Market Value (US$ Million) Forecast by End-Use Industry, 2019 to 2034

Table 58: South Asia and Pacific Market Volume (Units) Forecast by End-Use Industry, 2019 to 2034

Table 59: South Asia and Pacific Market Value (US$ Million) Forecast by Function, 2019 to 2034

Table 60: South Asia and Pacific Market Volume (Units) Forecast by Function, 2019 to 2034

Table 61: East Asia Market Value (US$ Million) Forecast by Country, 2019 to 2034

Table 62: East Asia Market Volume (Units) Forecast by Country, 2019 to 2034

Table 63: East Asia Market Value (US$ Million) Forecast by Valve Type, 2019 to 2034

Table 64: East Asia Market Volume (Units) Forecast by Valve Type, 2019 to 2034

Table 65: East Asia Market Value (US$ Million) Forecast by Valve Material, 2019 to 2034

Table 66: East Asia Market Volume (Units) Forecast by Valve Material, 2019 to 2034

Table 67: East Asia Market Value (US$ Million) Forecast by End-Use Industry, 2019 to 2034

Table 68: East Asia Market Volume (Units) Forecast by End-Use Industry, 2019 to 2034

Table 69: East Asia Market Value (US$ Million) Forecast by Function, 2019 to 2034

Table 70: East Asia Market Volume (Units) Forecast by Function, 2019 to 2034

Table 71: Middle East and Africa Market Value (US$ Million) Forecast by Country, 2019 to 2034

Table 72: Middle East and Africa Market Volume (Units) Forecast by Country, 2019 to 2034

Table 73: Middle East and Africa Market Value (US$ Million) Forecast by Valve Type, 2019 to 2034

Table 74: Middle East and Africa Market Volume (Units) Forecast by Valve Type, 2019 to 2034

Table 75: Middle East and Africa Market Value (US$ Million) Forecast by Valve Material, 2019 to 2034

Table 76: Middle East and Africa Market Volume (Units) Forecast by Valve Material, 2019 to 2034

Table 77: Middle East and Africa Market Value (US$ Million) Forecast by End-Use Industry, 2019 to 2034

Table 78: Middle East and Africa Market Volume (Units) Forecast by End-Use Industry, 2019 to 2034

Table 79: Middle East and Africa Market Value (US$ Million) Forecast by Function, 2019 to 2034

Table 80: Middle East and Africa Market Volume (Units) Forecast by Function, 2019 to 2034

List of Figures

Figure 1: Global Market Value (US$ Million) by Valve Type, 2024 to 2034

Figure 2: Global Market Value (US$ Million) by Valve Material, 2024 to 2034

Figure 3: Global Market Value (US$ Million) by End-Use Industry, 2024 to 2034

Figure 4: Global Market Value (US$ Million) by Function, 2024 to 2034

Figure 5: Global Market Value (US$ Million) by Region, 2024 to 2034

Figure 6: Global Market Value (US$ Million) Analysis by Region, 2019 to 2034

Figure 7: Global Market Volume (Units) Analysis by Region, 2019 to 2034

Figure 8: Global Market Value Share (%) and BPS Analysis by Region, 2024 to 2034

Figure 9: Global Market Y-o-Y Growth (%) Projections by Region, 2024 to 2034

Figure 10: Global Market Value (US$ Million) Analysis by Valve Type, 2019 to 2034

Figure 11: Global Market Volume (Units) Analysis by Valve Type, 2019 to 2034

Figure 12: Global Market Value Share (%) and BPS Analysis by Valve Type, 2024 to 2034

Figure 13: Global Market Y-o-Y Growth (%) Projections by Valve Type, 2024 to 2034

Figure 14: Global Market Value (US$ Million) Analysis by Valve Material, 2019 to 2034

Figure 15: Global Market Volume (Units) Analysis by Valve Material, 2019 to 2034

Figure 16: Global Market Value Share (%) and BPS Analysis by Valve Material, 2024 to 2034

Figure 17: Global Market Y-o-Y Growth (%) Projections by Valve Material, 2024 to 2034

Figure 18: Global Market Value (US$ Million) Analysis by End-Use Industry, 2019 to 2034

Figure 19: Global Market Volume (Units) Analysis by End-Use Industry, 2019 to 2034

Figure 20: Global Market Value Share (%) and BPS Analysis by End-Use Industry, 2024 to 2034

Figure 21: Global Market Y-o-Y Growth (%) Projections by End-Use Industry, 2024 to 2034

Figure 22: Global Market Value (US$ Million) Analysis by Function, 2019 to 2034

Figure 23: Global Market Volume (Units) Analysis by Function, 2019 to 2034

Figure 24: Global Market Value Share (%) and BPS Analysis by Function, 2024 to 2034

Figure 25: Global Market Y-o-Y Growth (%) Projections by Function, 2024 to 2034

Figure 26: Global Market Attractiveness by Valve Type, 2024 to 2034

Figure 27: Global Market Attractiveness by Valve Material, 2024 to 2034

Figure 28: Global Market Attractiveness by End-Use Industry, 2024 to 2034

Figure 29: Global Market Attractiveness by Function, 2024 to 2034

Figure 30: Global Market Attractiveness by Region, 2024 to 2034

Figure 31: North America Market Value (US$ Million) by Valve Type, 2024 to 2034

Figure 32: North America Market Value (US$ Million) by Valve Material, 2024 to 2034

Figure 33: North America Market Value (US$ Million) by End-Use Industry, 2024 to 2034

Figure 34: North America Market Value (US$ Million) by Function, 2024 to 2034

Figure 35: North America Market Value (US$ Million) by Country, 2024 to 2034

Figure 36: North America Market Value (US$ Million) Analysis by Country, 2019 to 2034

Figure 37: North America Market Volume (Units) Analysis by Country, 2019 to 2034

Figure 38: North America Market Value Share (%) and BPS Analysis by Country, 2024 to 2034

Figure 39: North America Market Y-o-Y Growth (%) Projections by Country, 2024 to 2034

Figure 40: North America Market Value (US$ Million) Analysis by Valve Type, 2019 to 2034

Figure 41: North America Market Volume (Units) Analysis by Valve Type, 2019 to 2034

Figure 42: North America Market Value Share (%) and BPS Analysis by Valve Type, 2024 to 2034

Figure 43: North America Market Y-o-Y Growth (%) Projections by Valve Type, 2024 to 2034

Figure 44: North America Market Value (US$ Million) Analysis by Valve Material, 2019 to 2034

Figure 45: North America Market Volume (Units) Analysis by Valve Material, 2019 to 2034

Figure 46: North America Market Value Share (%) and BPS Analysis by Valve Material, 2024 to 2034

Figure 47: North America Market Y-o-Y Growth (%) Projections by Valve Material, 2024 to 2034

Figure 48: North America Market Value (US$ Million) Analysis by End-Use Industry, 2019 to 2034

Figure 49: North America Market Volume (Units) Analysis by End-Use Industry, 2019 to 2034

Figure 50: North America Market Value Share (%) and BPS Analysis by End-Use Industry, 2024 to 2034

Figure 51: North America Market Y-o-Y Growth (%) Projections by End-Use Industry, 2024 to 2034

Figure 52: North America Market Value (US$ Million) Analysis by Function, 2019 to 2034

Figure 53: North America Market Volume (Units) Analysis by Function, 2019 to 2034

Figure 54: North America Market Value Share (%) and BPS Analysis by Function, 2024 to 2034

Figure 55: North America Market Y-o-Y Growth (%) Projections by Function, 2024 to 2034

Figure 56: North America Market Attractiveness by Valve Type, 2024 to 2034

Figure 57: North America Market Attractiveness by Valve Material, 2024 to 2034

Figure 58: North America Market Attractiveness by End-Use Industry, 2024 to 2034

Figure 59: North America Market Attractiveness by Function, 2024 to 2034

Figure 60: North America Market Attractiveness by Country, 2024 to 2034

Figure 61: Latin America Market Value (US$ Million) by Valve Type, 2024 to 2034

Figure 62: Latin America Market Value (US$ Million) by Valve Material, 2024 to 2034

Figure 63: Latin America Market Value (US$ Million) by End-Use Industry, 2024 to 2034

Figure 64: Latin America Market Value (US$ Million) by Function, 2024 to 2034

Figure 65: Latin America Market Value (US$ Million) by Country, 2024 to 2034

Figure 66: Latin America Market Value (US$ Million) Analysis by Country, 2019 to 2034

Figure 67: Latin America Market Volume (Units) Analysis by Country, 2019 to 2034

Figure 68: Latin America Market Value Share (%) and BPS Analysis by Country, 2024 to 2034

Figure 69: Latin America Market Y-o-Y Growth (%) Projections by Country, 2024 to 2034

Figure 70: Latin America Market Value (US$ Million) Analysis by Valve Type, 2019 to 2034

Figure 71: Latin America Market Volume (Units) Analysis by Valve Type, 2019 to 2034

Figure 72: Latin America Market Value Share (%) and BPS Analysis by Valve Type, 2024 to 2034

Figure 73: Latin America Market Y-o-Y Growth (%) Projections by Valve Type, 2024 to 2034

Figure 74: Latin America Market Value (US$ Million) Analysis by Valve Material, 2019 to 2034

Figure 75: Latin America Market Volume (Units) Analysis by Valve Material, 2019 to 2034

Figure 76: Latin America Market Value Share (%) and BPS Analysis by Valve Material, 2024 to 2034

Figure 77: Latin America Market Y-o-Y Growth (%) Projections by Valve Material, 2024 to 2034

Figure 78: Latin America Market Value (US$ Million) Analysis by End-Use Industry, 2019 to 2034

Figure 79: Latin America Market Volume (Units) Analysis by End-Use Industry, 2019 to 2034

Figure 80: Latin America Market Value Share (%) and BPS Analysis by End-Use Industry, 2024 to 2034

Figure 81: Latin America Market Y-o-Y Growth (%) Projections by End-Use Industry, 2024 to 2034

Figure 82: Latin America Market Value (US$ Million) Analysis by Function, 2019 to 2034

Figure 83: Latin America Market Volume (Units) Analysis by Function, 2019 to 2034

Figure 84: Latin America Market Value Share (%) and BPS Analysis by Function, 2024 to 2034

Figure 85: Latin America Market Y-o-Y Growth (%) Projections by Function, 2024 to 2034

Figure 86: Latin America Market Attractiveness by Valve Type, 2024 to 2034

Figure 87: Latin America Market Attractiveness by Valve Material, 2024 to 2034

Figure 88: Latin America Market Attractiveness by End-Use Industry, 2024 to 2034

Figure 89: Latin America Market Attractiveness by Function, 2024 to 2034

Figure 90: Latin America Market Attractiveness by Country, 2024 to 2034

Figure 91: Western Europe Market Value (US$ Million) by Valve Type, 2024 to 2034

Figure 92: Western Europe Market Value (US$ Million) by Valve Material, 2024 to 2034

Figure 93: Western Europe Market Value (US$ Million) by End-Use Industry, 2024 to 2034

Figure 94: Western Europe Market Value (US$ Million) by Function, 2024 to 2034

Figure 95: Western Europe Market Value (US$ Million) by Country, 2024 to 2034

Figure 96: Western Europe Market Value (US$ Million) Analysis by Country, 2019 to 2034

Figure 97: Western Europe Market Volume (Units) Analysis by Country, 2019 to 2034

Figure 98: Western Europe Market Value Share (%) and BPS Analysis by Country, 2024 to 2034

Figure 99: Western Europe Market Y-o-Y Growth (%) Projections by Country, 2024 to 2034

Figure 100: Western Europe Market Value (US$ Million) Analysis by Valve Type, 2019 to 2034

Figure 101: Western Europe Market Volume (Units) Analysis by Valve Type, 2019 to 2034

Figure 102: Western Europe Market Value Share (%) and BPS Analysis by Valve Type, 2024 to 2034

Figure 103: Western Europe Market Y-o-Y Growth (%) Projections by Valve Type, 2024 to 2034

Figure 104: Western Europe Market Value (US$ Million) Analysis by Valve Material, 2019 to 2034

Figure 105: Western Europe Market Volume (Units) Analysis by Valve Material, 2019 to 2034

Figure 106: Western Europe Market Value Share (%) and BPS Analysis by Valve Material, 2024 to 2034

Figure 107: Western Europe Market Y-o-Y Growth (%) Projections by Valve Material, 2024 to 2034

Figure 108: Western Europe Market Value (US$ Million) Analysis by End-Use Industry, 2019 to 2034

Figure 109: Western Europe Market Volume (Units) Analysis by End-Use Industry, 2019 to 2034

Figure 110: Western Europe Market Value Share (%) and BPS Analysis by End-Use Industry, 2024 to 2034

Figure 111: Western Europe Market Y-o-Y Growth (%) Projections by End-Use Industry, 2024 to 2034

Figure 112: Western Europe Market Value (US$ Million) Analysis by Function, 2019 to 2034

Figure 113: Western Europe Market Volume (Units) Analysis by Function, 2019 to 2034

Figure 114: Western Europe Market Value Share (%) and BPS Analysis by Function, 2024 to 2034

Figure 115: Western Europe Market Y-o-Y Growth (%) Projections by Function, 2024 to 2034

Figure 116: Western Europe Market Attractiveness by Valve Type, 2024 to 2034

Figure 117: Western Europe Market Attractiveness by Valve Material, 2024 to 2034

Figure 118: Western Europe Market Attractiveness by End-Use Industry, 2024 to 2034

Figure 119: Western Europe Market Attractiveness by Function, 2024 to 2034

Figure 120: Western Europe Market Attractiveness by Country, 2024 to 2034

Figure 121: Eastern Europe Market Value (US$ Million) by Valve Type, 2024 to 2034

Figure 122: Eastern Europe Market Value (US$ Million) by Valve Material, 2024 to 2034

Figure 123: Eastern Europe Market Value (US$ Million) by End-Use Industry, 2024 to 2034

Figure 124: Eastern Europe Market Value (US$ Million) by Function, 2024 to 2034

Figure 125: Eastern Europe Market Value (US$ Million) by Country, 2024 to 2034

Figure 126: Eastern Europe Market Value (US$ Million) Analysis by Country, 2019 to 2034

Figure 127: Eastern Europe Market Volume (Units) Analysis by Country, 2019 to 2034

Figure 128: Eastern Europe Market Value Share (%) and BPS Analysis by Country, 2024 to 2034

Figure 129: Eastern Europe Market Y-o-Y Growth (%) Projections by Country, 2024 to 2034

Figure 130: Eastern Europe Market Value (US$ Million) Analysis by Valve Type, 2019 to 2034

Figure 131: Eastern Europe Market Volume (Units) Analysis by Valve Type, 2019 to 2034

Figure 132: Eastern Europe Market Value Share (%) and BPS Analysis by Valve Type, 2024 to 2034

Figure 133: Eastern Europe Market Y-o-Y Growth (%) Projections by Valve Type, 2024 to 2034

Figure 134: Eastern Europe Market Value (US$ Million) Analysis by Valve Material, 2019 to 2034

Figure 135: Eastern Europe Market Volume (Units) Analysis by Valve Material, 2019 to 2034

Figure 136: Eastern Europe Market Value Share (%) and BPS Analysis by Valve Material, 2024 to 2034

Figure 137: Eastern Europe Market Y-o-Y Growth (%) Projections by Valve Material, 2024 to 2034

Figure 138: Eastern Europe Market Value (US$ Million) Analysis by End-Use Industry, 2019 to 2034

Figure 139: Eastern Europe Market Volume (Units) Analysis by End-Use Industry, 2019 to 2034

Figure 140: Eastern Europe Market Value Share (%) and BPS Analysis by End-Use Industry, 2024 to 2034

Figure 141: Eastern Europe Market Y-o-Y Growth (%) Projections by End-Use Industry, 2024 to 2034

Figure 142: Eastern Europe Market Value (US$ Million) Analysis by Function, 2019 to 2034

Figure 143: Eastern Europe Market Volume (Units) Analysis by Function, 2019 to 2034

Figure 144: Eastern Europe Market Value Share (%) and BPS Analysis by Function, 2024 to 2034

Figure 145: Eastern Europe Market Y-o-Y Growth (%) Projections by Function, 2024 to 2034

Figure 146: Eastern Europe Market Attractiveness by Valve Type, 2024 to 2034

Figure 147: Eastern Europe Market Attractiveness by Valve Material, 2024 to 2034

Figure 148: Eastern Europe Market Attractiveness by End-Use Industry, 2024 to 2034

Figure 149: Eastern Europe Market Attractiveness by Function, 2024 to 2034

Figure 150: Eastern Europe Market Attractiveness by Country, 2024 to 2034

Figure 151: South Asia and Pacific Market Value (US$ Million) by Valve Type, 2024 to 2034

Figure 152: South Asia and Pacific Market Value (US$ Million) by Valve Material, 2024 to 2034

Figure 153: South Asia and Pacific Market Value (US$ Million) by End-Use Industry, 2024 to 2034

Figure 154: South Asia and Pacific Market Value (US$ Million) by Function, 2024 to 2034

Figure 155: South Asia and Pacific Market Value (US$ Million) by Country, 2024 to 2034

Figure 156: South Asia and Pacific Market Value (US$ Million) Analysis by Country, 2019 to 2034

Figure 157: South Asia and Pacific Market Volume (Units) Analysis by Country, 2019 to 2034

Figure 158: South Asia and Pacific Market Value Share (%) and BPS Analysis by Country, 2024 to 2034

Figure 159: South Asia and Pacific Market Y-o-Y Growth (%) Projections by Country, 2024 to 2034

Figure 160: South Asia and Pacific Market Value (US$ Million) Analysis by Valve Type, 2019 to 2034

Figure 161: South Asia and Pacific Market Volume (Units) Analysis by Valve Type, 2019 to 2034

Figure 162: South Asia and Pacific Market Value Share (%) and BPS Analysis by Valve Type, 2024 to 2034

Figure 163: South Asia and Pacific Market Y-o-Y Growth (%) Projections by Valve Type, 2024 to 2034

Figure 164: South Asia and Pacific Market Value (US$ Million) Analysis by Valve Material, 2019 to 2034

Figure 165: South Asia and Pacific Market Volume (Units) Analysis by Valve Material, 2019 to 2034

Figure 166: South Asia and Pacific Market Value Share (%) and BPS Analysis by Valve Material, 2024 to 2034

Figure 167: South Asia and Pacific Market Y-o-Y Growth (%) Projections by Valve Material, 2024 to 2034

Figure 168: South Asia and Pacific Market Value (US$ Million) Analysis by End-Use Industry, 2019 to 2034

Figure 169: South Asia and Pacific Market Volume (Units) Analysis by End-Use Industry, 2019 to 2034

Figure 170: South Asia and Pacific Market Value Share (%) and BPS Analysis by End-Use Industry, 2024 to 2034

Figure 171: South Asia and Pacific Market Y-o-Y Growth (%) Projections by End-Use Industry, 2024 to 2034

Figure 172: South Asia and Pacific Market Value (US$ Million) Analysis by Function, 2019 to 2034

Figure 173: South Asia and Pacific Market Volume (Units) Analysis by Function, 2019 to 2034

Figure 174: South Asia and Pacific Market Value Share (%) and BPS Analysis by Function, 2024 to 2034

Figure 175: South Asia and Pacific Market Y-o-Y Growth (%) Projections by Function, 2024 to 2034

Figure 176: South Asia and Pacific Market Attractiveness by Valve Type, 2024 to 2034

Figure 177: South Asia and Pacific Market Attractiveness by Valve Material, 2024 to 2034

Figure 178: South Asia and Pacific Market Attractiveness by End-Use Industry, 2024 to 2034

Figure 179: South Asia and Pacific Market Attractiveness by Function, 2024 to 2034

Figure 180: South Asia and Pacific Market Attractiveness by Country, 2024 to 2034

Figure 181: East Asia Market Value (US$ Million) by Valve Type, 2024 to 2034

Figure 182: East Asia Market Value (US$ Million) by Valve Material, 2024 to 2034

Figure 183: East Asia Market Value (US$ Million) by End-Use Industry, 2024 to 2034

Figure 184: East Asia Market Value (US$ Million) by Function, 2024 to 2034

Figure 185: East Asia Market Value (US$ Million) by Country, 2024 to 2034

Figure 186: East Asia Market Value (US$ Million) Analysis by Country, 2019 to 2034

Figure 187: East Asia Market Volume (Units) Analysis by Country, 2019 to 2034

Figure 188: East Asia Market Value Share (%) and BPS Analysis by Country, 2024 to 2034

Figure 189: East Asia Market Y-o-Y Growth (%) Projections by Country, 2024 to 2034

Figure 190: East Asia Market Value (US$ Million) Analysis by Valve Type, 2019 to 2034

Figure 191: East Asia Market Volume (Units) Analysis by Valve Type, 2019 to 2034

Figure 192: East Asia Market Value Share (%) and BPS Analysis by Valve Type, 2024 to 2034

Figure 193: East Asia Market Y-o-Y Growth (%) Projections by Valve Type, 2024 to 2034

Figure 194: East Asia Market Value (US$ Million) Analysis by Valve Material, 2019 to 2034

Figure 195: East Asia Market Volume (Units) Analysis by Valve Material, 2019 to 2034

Figure 196: East Asia Market Value Share (%) and BPS Analysis by Valve Material, 2024 to 2034

Figure 197: East Asia Market Y-o-Y Growth (%) Projections by Valve Material, 2024 to 2034

Figure 198: East Asia Market Value (US$ Million) Analysis by End-Use Industry, 2019 to 2034

Figure 199: East Asia Market Volume (Units) Analysis by End-Use Industry, 2019 to 2034

Figure 200: East Asia Market Value Share (%) and BPS Analysis by End-Use Industry, 2024 to 2034

Figure 201: East Asia Market Y-o-Y Growth (%) Projections by End-Use Industry, 2024 to 2034

Figure 202: East Asia Market Value (US$ Million) Analysis by Function, 2019 to 2034

Figure 203: East Asia Market Volume (Units) Analysis by Function, 2019 to 2034

Figure 204: East Asia Market Value Share (%) and BPS Analysis by Function, 2024 to 2034

Figure 205: East Asia Market Y-o-Y Growth (%) Projections by Function, 2024 to 2034

Figure 206: East Asia Market Attractiveness by Valve Type, 2024 to 2034

Figure 207: East Asia Market Attractiveness by Valve Material, 2024 to 2034

Figure 208: East Asia Market Attractiveness by End-Use Industry, 2024 to 2034

Figure 209: East Asia Market Attractiveness by Function, 2024 to 2034

Figure 210: East Asia Market Attractiveness by Country, 2024 to 2034

Figure 211: Middle East and Africa Market Value (US$ Million) by Valve Type, 2024 to 2034

Figure 212: Middle East and Africa Market Value (US$ Million) by Valve Material, 2024 to 2034

Figure 213: Middle East and Africa Market Value (US$ Million) by End-Use Industry, 2024 to 2034

Figure 214: Middle East and Africa Market Value (US$ Million) by Function, 2024 to 2034

Figure 215: Middle East and Africa Market Value (US$ Million) by Country, 2024 to 2034

Figure 216: Middle East and Africa Market Value (US$ Million) Analysis by Country, 2019 to 2034

Figure 217: Middle East and Africa Market Volume (Units) Analysis by Country, 2019 to 2034

Figure 218: Middle East and Africa Market Value Share (%) and BPS Analysis by Country, 2024 to 2034

Figure 219: Middle East and Africa Market Y-o-Y Growth (%) Projections by Country, 2024 to 2034

Figure 220: Middle East and Africa Market Value (US$ Million) Analysis by Valve Type, 2019 to 2034

Figure 221: Middle East and Africa Market Volume (Units) Analysis by Valve Type, 2019 to 2034

Figure 222: Middle East and Africa Market Value Share (%) and BPS Analysis by Valve Type, 2024 to 2034

Figure 223: Middle East and Africa Market Y-o-Y Growth (%) Projections by Valve Type, 2024 to 2034

Figure 224: Middle East and Africa Market Value (US$ Million) Analysis by Valve Material, 2019 to 2034

Figure 225: Middle East and Africa Market Volume (Units) Analysis by Valve Material, 2019 to 2034

Figure 226: Middle East and Africa Market Value Share (%) and BPS Analysis by Valve Material, 2024 to 2034

Figure 227: Middle East and Africa Market Y-o-Y Growth (%) Projections by Valve Material, 2024 to 2034

Figure 228: Middle East and Africa Market Value (US$ Million) Analysis by End-Use Industry, 2019 to 2034

Figure 229: Middle East and Africa Market Volume (Units) Analysis by End-Use Industry, 2019 to 2034

Figure 230: Middle East and Africa Market Value Share (%) and BPS Analysis by End-Use Industry, 2024 to 2034

Figure 231: Middle East and Africa Market Y-o-Y Growth (%) Projections by End-Use Industry, 2024 to 2034

Figure 232: Middle East and Africa Market Value (US$ Million) Analysis by Function, 2019 to 2034

Figure 233: Middle East and Africa Market Volume (Units) Analysis by Function, 2019 to 2034

Figure 234: Middle East and Africa Market Value Share (%) and BPS Analysis by Function, 2024 to 2034

Figure 235: Middle East and Africa Market Y-o-Y Growth (%) Projections by Function, 2024 to 2034

Figure 236: Middle East and Africa Market Attractiveness by Valve Type, 2024 to 2034

Figure 237: Middle East and Africa Market Attractiveness by Valve Material, 2024 to 2034

Figure 238: Middle East and Africa Market Attractiveness by End-Use Industry, 2024 to 2034

Figure 239: Middle East and Africa Market Attractiveness by Function, 2024 to 2034

Figure 240: Middle East and Africa Market Attractiveness by Country, 2024 to 2034

Frequently Asked Questions

What is the current size of the global industrial valve market?

As of 2025, the global industrial valve market is valued at approximately USD 84.97 billion, driven by strong demand from energy, water treatment, and manufacturing sectors worldwide.

What is the growth forecast for the industrial valve industry?

The industrial valve market is expected to grow at a compound annual growth rate (CAGR) of 4.2% from 2025 to 2035, reaching USD 128.22 billion by the end of the forecast period.

Which valve type holds the largest market share?

Ball valves hold the largest market share in 2025, accounting for 24.6% of global revenue, due to their versatility, tight shut-off capability, and widespread use in oil & gas and water sectors.

Which material dominates the industrial valve market?

Cast steel remains the dominant material type in 2025, capturing 35.3% of the market, thanks to its durability in high-pressure and high-temperature applications across critical industries.

Which region is experiencing the fastest growth in valve demand?

South Asia and Pacific, led by India, is the fastest-growing region for industrial valves, with India alone projected to grow at a CAGR of 5.1% between 2025 and 2035 due to massive infrastructure investment.South Asia and Pacific, led by India, is the fastest-growing region for industrial valves, with India alone projected to grow at a CAGR of 5.1% between 2025 and 2035 due to massive infrastructure investment.

Explore Similar Insights

Future Market Insights

Industrial Valve Market