Pre-mixed/RTD Alcoholic Drink Market Forecast and Outlook 2025 to 2035

The RTD alcoholic drink market is estimated to be valued at USD 37.2 billion in 2025. It is projected to reach USD 59.5 billion by 2035, registering a compound annual growth rate (CAGR) of 4.8% over the forecast period. The market is projected to add an absolute dollar opportunity of USD 22.3 billion over the forecast period.

Quick Stats for Pre-mixed/RTD Alcoholic Drink Market

  • Pre-mixed/RTD Alcoholic Drink Market Value (2025): USD 37.2 billion
  • Pre-mixed/RTD Alcoholic Drink Market Forecast Value (2035): USD 59.5 billion
  • Pre-mixed/RTD Alcoholic Drink Market Forecast CAGR: 4.8%
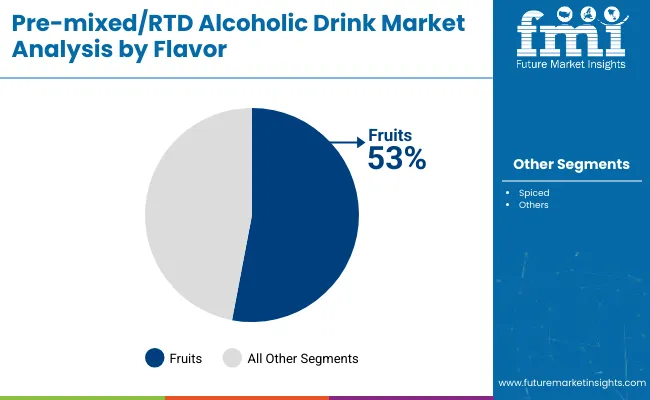
  • Leading Segment by Flavor in Pre-mixed/RTD Alcoholic Drink Market (2025): Fruits (53% market share)
  • Key Growth Regions in Pre-mixed/RTD Alcoholic Drink Market: North America, Europe, Asia Pacific
  • Top Players in Pre-mixed/RTD Alcoholic Drink Market: Diageo plc, Asahi Breweries Ltd., Suntory Holdings Limited, Halewood International Limited, The Brown-Forman Corporation, Bacardi Limited, Mike's Hard Lemonade Co., Pernod Ricard SA, Anheuser-Busch InBev SA/NV

Pre Mixed Rtd Alcoholic Drinks Market

Metric Value
Estimated Size (2025E) USD 37.2 billion
Projected Value (2035F) USD 59.5 billion
CAGR (2025 to 2035) 4.8%

This reflects a 1.60 times growth at a compound annual growth rate of 4.8%. The market's evolution is expected to be shaped by rising demand for convenience beverages, increasing adoption of fruit-based flavors, and growing preference for ready-to-consume alcoholic cocktails, particularly where lifestyle convenience and social drinking experiences are prioritized.
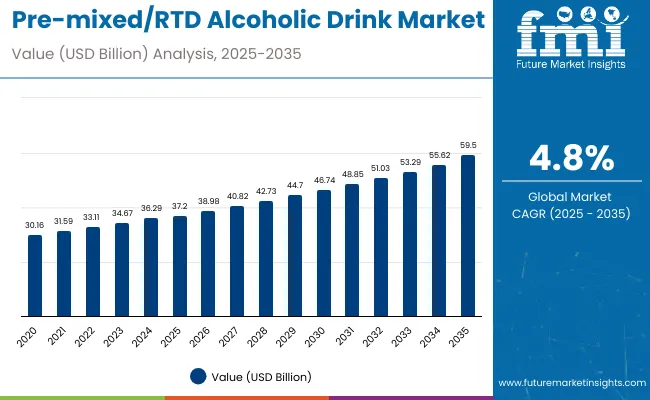
By 2030, the market is likely to reach USD 48.2 billion, accounting for USD 11.0 billion in incremental value over the first half of the decade. The remaining USD 11.3 billion is expected during the second half, suggesting a moderately back-loaded growth pattern. Product innovation in spirit-based cocktails and premium fruit-flavored variants is gaining traction due to RTD beverages' convenience factor and evolving consumer preferences for experiential drinking occasions.

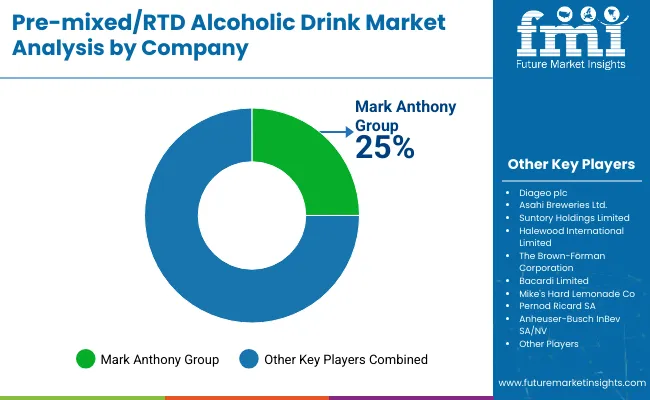
Companies such as Mark Anthony Group and Suntory Holdings Limited are advancing their competitive positions through investment in flavor innovation, premium positioning, and strategic market expansion. Health-conscious drinking trends and convenience-focused lifestyle changes are supporting expansion into traditional retail, specialty stores, and emerging online channels. Market performance will remain anchored in flavor diversity, distribution excellence, and brand authenticity benchmarks.

The market holds a significant and growing share across its parent markets. Within the broader alcoholic beverages market, it accounts for 8.5% due to its convenience positioning and lifestyle appeal. In the premium beverage segment, it commands a 12.3% share, supported by rising consumer preference for craft-style experiences.

It contributes nearly 15.7% to the convenience beverage market and 9.8% to the social drinking occasions category. In the flavored alcoholic beverages segment, RTD products hold around 18.2% share, driven by fruit-based innovation and seasonal offerings. Across the portable alcoholic drinks market, its share is close to 34.6%, owing to its ready-to-consume format and outdoor consumption suitability.

The market is undergoing a strategic transformation driven by rising demand for convenient, premium, and diverse flavor experiences in alcoholic beverages. Advanced production technologies using spirit blending, natural flavor integration, and innovative packaging solutions have enhanced taste profiles, shelf stability, and consumer appeal, making RTD products viable alternatives to traditional mixed drinks.

Manufacturers are introducing specialized formulations, including low-alcohol variants and exotic flavor combinations tailored for specific demographic segments, expanding their role beyond basic convenience beverages. Strategic collaborations between beverage companies and flavor houses have accelerated innovation in product development and market penetration. Clean-label positioning and premium ingredient transparency have widened consumer acceptance across diverse demographics, reshaping traditional drinking patterns and forcing conventional beverage suppliers to diversify their portfolios.

Why is the Pre-mixed/RTD Alcoholic Drink Market Growing?

RTD alcoholic beverages' exceptional convenience factor, consistent quality, and diverse flavor profiles make them attractive options for consumers seeking hassle-free drinking experiences without compromising on taste or social appeal. The ready-to-consume format appeals to busy lifestyles, outdoor activities, and social occasions where traditional cocktail preparation is impractical.

Growing awareness of premium drinking experiences, craft beverage trends, and experiential consumption is further propelling adoption, especially in social gatherings, outdoor events, and casual dining sectors. Rising disposable incomes, expanding retail distribution channels, and manufacturer investments in flavor innovation are also enhancing product accessibility and market penetration.

As convenience trends accelerate across demographics and premium positioning becomes critical, the market outlook remains favorable. With consumers prioritizing convenience, flavor variety, and consistent quality, RTD alcoholic beverages are well-positioned to expand across various consumption occasions and demographic segments.

Segmental Analysis

The market is segmented by product type, flavor, packaging, distribution channel, and region. By product type, the market is divided into rum, whiskey, vodka, wine, and others. Based on flavor, the market is categorized into fruits, spiced, and others. By packaging, the market is segmented into cans, bottles, and others. Based on distribution channel, the market is classified intohyper markets and supermarkets, departmental stores, specialty stores, and online retailers. Regionally, it covers North America, Latin America, Europe, East Asia, South Asia & Pacific, the Middle East & Africa.
By Flavor, Fruits Segment Accounts for 53% of the Market Share

Pre Mixed Rtd Alcoholic Drinks Market By Flavor

The fruits segment holds a dominant position with 53% of the market share in the flavor category, owing to its broad consumer appeal, refreshing taste profile, and versatility across different consumption occasions. Fruit-flavored RTD beverages are widely preferred across demographic segments due to their approachable taste, lower perceived alcohol intensity, and association with healthier, more natural ingredients.

The segment enables manufacturers and consumers to deliver diverse taste experiences while maintaining mass market appeal and seasonal adaptability. As demand for natural flavors, lighter alcoholic beverages, and refreshing experiences grows, fruit-flavored variants continue to gain preference in both casual and premium drinking occasions.

Manufacturers are investing in natural fruit extracts, exotic flavor combinations, and seasonal limited editions to enhance taste authenticity, market differentiation, and consumer engagement. The segment is poised to expand further as global consumer preferences favor natural, refreshing, and approachable alcoholic beverages.
By Distribution Channel, Hyper/Supermarket Stores Segment Accounts for 45% of the Market Share

Pre Mixed Rtd Alcoholic Drinks Market By Distribution Channel

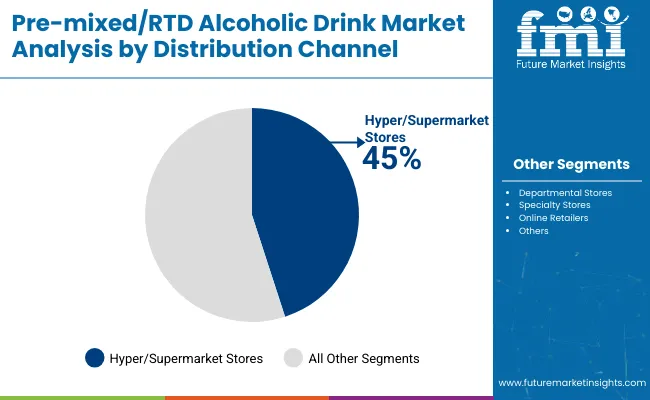
Hyper/supermarket stores remain the core distribution channel with 45% of the market share in 2025, as these outlets provide convenience shopping, competitive pricing, and extensive product variety that appeals to mainstream consumers. The channel's dominance supports impulse purchases, promotional activities, and regular household shopping integration.

RTD alcoholic beverages benefit from prominent shelf placement, promotional campaigns, and bulk purchasing options available in hypermarket environments. This makes the channel indispensable for volume sales and brand visibility in competitive retail environments.

Ongoing expansion of organized retail, promotional support from manufacturers, and consumer preference for one-stop shopping are key trends driving the sustained relevance of hypermarkets and supermarkets in RTD beverage distribution.

What are the Drivers, Restraints, and Key Trends of the Pre-mixed/RTD Alcoholic Drink Market?

In 2024, global RTD alcoholic drink consumption grew by 12% year-on-year, with North America taking a 35% share. Applications include social drinking, outdoor activities, and casual dining enhancement. Manufacturers are introducing specialized formulations and premium positioning that deliver superior convenience and consistent quality experiences. Fruit-flavored formulations now support natural ingredient positioning. Convenience-focused consumption trends and lifestyle preferences support consumer confidence. Technology providers increasingly supply ready-to-drink solutions with integrated flavor profiles to reduce preparation complexity.

Premium Convenience Positioning Accelerates Pre-mixed/RTD Demand

Food service operators and retailers are choosing RTD alcoholic beverages to achieve superior convenience, consistent quality, and diverse flavor options that meet consumer demands for hassle-free drinking experiences. In taste testing, premium RTD cocktails deliver up to 85% satisfaction rates compared to home-mixed alternatives at 65-70%.

Products formulated with natural ingredients maintain flavor consistency throughout extended shelf life cycles. In ready-to-serve formats, premium RTD beverages help reduce preparation time while maintaining taste quality by up to 75%. RTD applications are now being deployed for outdoor events and casual dining, increasing adoption in sectors demanding convenient beverage solutions. These advantages help explain why RTD adoption rates in food service rose 22% in 2024 across North America and Europe.

Regulatory Constraints, Competition and Distribution Complexity Limit Growth

Market expansion faces constraints due to alcohol regulations, intense competition from traditional beverages, and complex distribution requirements across different markets. Regulatory compliance costs can vary from USD 50,000 to USD 200,000, depending on market entry requirements and licensing procedures, impacting pricing and leading to delayed market entry of up to 12 months in new jurisdictions.

Multi-state distribution complexity and age verification requirements add 4 to 6 weeks to product launch cycles. Specialized storage conditions and alcohol handling regulations extend distribution costs by 15-20% compared to non-alcoholic beverages. Limited availability of licensed distributors restricts scalable expansion, especially for premium positioning projects. These constraints make RTD market entry challenging in regulated markets despite growing consumer interest and commercial opportunity.
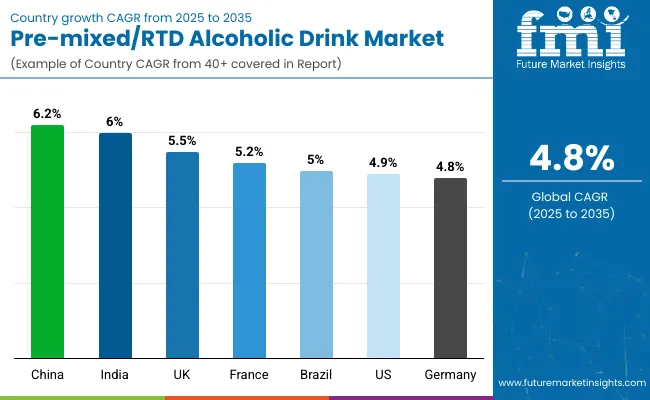
Pre-mixed/RTD Alcoholic Drink Market Analysis by Top Countries

Country Wise Analysis Of Pre Mixed Rtd Alcoholic Drinks Market

Countries CAGR (2025 to 2035)
China 6.2%
India 6.0%
UK 5.5%
France 5.2%
Brazil 5.0%
USA 4.9%
Germany 4.8%

In the Pre-mixed/RTD alcoholic drink market, China leads with the highest projected CAGR of 6.2% from 2025 to 2035, driven by rapid urbanization and growing acceptance of Western drinking culture. India follows with a CAGR of 6.0%, supported by rising disposable incomes and an expanding middle class. The UK shows strong growth at 5.5%, benefiting from established pub culture and convenience preferences. France demonstrates steady expansion at 5.2%, supported by premiumization trends and lifestyle changes. Brazil, the USA, and Germany show moderate growth at 5.0%, 4.9%, and 4.8% respectively, reflecting mature market dynamics with consistent consumer adoption patterns.

The report covers an in-depth analysis of 40+ countries; seven top-performing OECD countries are highlighted below.

Market Expansion in the Pre-mixed/RTD Alcoholic Drink Market in China

Revenue from RTD alcoholic beverages in China is projected to grow at a CAGR of 6.2% from 2025 to 2035, significantly exceeding the global average. Growth is fueled by urbanization, rising disposable incomes, and increasing adoption of Western lifestyle patterns across major cities, including Beijing, Shanghai, and Shenzhen. Chinese consumers are increasingly embracing convenient alcoholic beverages as social drinking occasions expand and convenience becomes paramount. E-commerce platforms and premium retail channels are driving market penetration.

  • Rapid innovation in tea-infused and low-alcohol RTD categories
  • Expansion of cross-border collaborations with international alcohol brands
  • Rising penetration of digital-first marketing strategies targeting Gen Z consumers

Market Development in the Pre-mixed/RTD Alcoholic Drink Market in India

The demand for RTD alcoholic beverages in India is projected to expand at a CAGR of 6.0% from 2025 to 2035, above the global average. Growth is concentrated in metropolitan areas including Mumbai, Delhi, and Bangalore, where rising disposable incomes and Western lifestyle adoption are driving consumption. Urban millennials and Gen Z consumers are increasingly seeking convenient, premium alcoholic beverages for social occasions and home entertainment. Regulatory challenges and taxation policies remain market constraints, but gradual liberalization supports long-term growth.

  • Increasing introduction of fruit-based cocktail RTDs tailored to Indian palates
  • Expansion of international RTD brands through partnerships with Indian breweries
  • Rising demand for ready-to-serve cans in home delivery alcohol segments

Market Growth in the Pre-mixed/RTD Alcoholic Drink Market in the United Kingdom

The RTD alcoholic drink market in the UK is expected to grow at a CAGR of 5.5% from 2025 to 2035, above the global average. Growth is driven by strong consumer preference for convenience beverages, established pub culture, and increasing outdoor consumption occasions across England, Scotland, and Wales. The market benefits from well-developed retail infrastructure, a favorable regulatory environment, and consumer openness to flavor innovation. Premium positioning and craft-style RTD offerings are gaining particular traction among younger demographics.

  • Expansion of gin- and vodka-based RTDs as pub-to-home alternatives
  • Increasing retail space allocation for premium single-serve cocktails
  • Strategic brand collaborations with music and sports events for visibility

France Pre-mixed/RTD Alcoholic Drink Market Analysis

Revenue from RTD alcoholic beverages in France is projected to rise at a CAGR of 5.2% from 2025 to 2035, supported by premiumization trends and evolving social drinking patterns. Urban markets like Paris, Lyon, and Marseille are experiencing growth in premium RTD cocktails and artisanal offerings that appeal to sophisticated consumers. The market benefits from strong appreciation for quality beverages and willingness to pay premium prices for convenient, well-crafted products. Traditional wine culture is gradually embracing RTD alternatives, particularly among younger consumers.

  • Growth of wine-inspired RTDs designed for younger audiences
  • Increasing visibility of artisanal RTDs in specialty retail channels
  • Premium RTD launches positioned as “aperitif alternatives” in metropolitan areas

Market Development in the Pre-mixed/RTD Alcoholic Drink Market in Brazil

Sales of RTD alcoholic beverages in Brazil are projected to flourish at a CAGR of 5.0% from 2025 to 2035, matching regional averages. Growth is concentrated in urban consumption expansion and social occasion integration in São Paulo, Rio de Janeiro, and Brasília regions. RTD adoption is shifting from limited availability toward mainstream retail presence and diverse flavor offerings. Local production capabilities and competitive pricing support commercial deployment strategies. Domestic partnerships between international brands and local distributors have strengthened market access and consumer education initiatives.

  • Expanding role of flavored cachaça-based RTDs in mainstream retail
  • Increasing investments in localized marketing campaigns targeting young adults
  • Growth of convenience store penetration as a key sales channel

Growth Leadership in the Pre-mixed/RTD Alcoholic Drink Market in the United States

The RTD alcoholic drink market in the USA is anticipated to expand at a CAGR of 4.9% from 2025 to 2035, maintaining steady growth. Expansion is centered on innovation-driven segments and premium positioning in California, Texas, and Florida regions. Advanced production technologies and regulatory compliance are being deployed for craft-style RTDs, hard seltzers, and premium cocktail applications. FDA regulations and state-level distribution requirements support systematic market development across diverse consumer segments.

  • Growing popularity of functional RTDs incorporating botanicals and adaptogens
  • Increased participation of craft breweries in RTD product diversification
  • Accelerating role of direct-to-consumer sales channels in urban areas

Germany Pre-mixed/RTD Alcoholic Drink Market Analysis

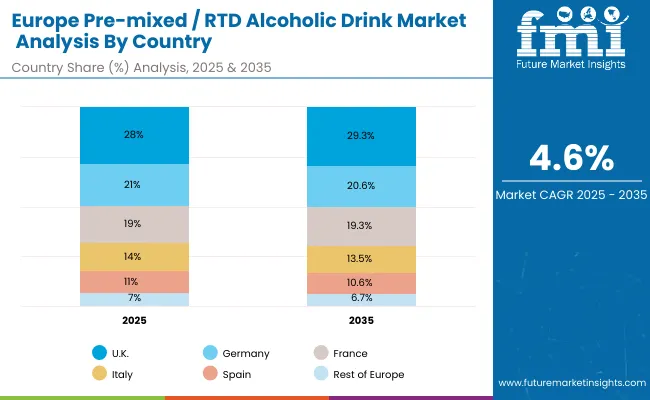
The demand for RTD alcoholic beverages in Germany is expected to increase at a CAGR of 4.8% from 2025 to 2035, matching the global average. Demand is driven by convenience trends and premium beverage adoption in Berlin, Munich, and Hamburg markets. Health-conscious consumers and premium beverage manufacturers are increasingly adopting RTD products for lifestyle positioning and convenience applications. However, traditional beer culture and established beverage preferences moderate adoption rates compared to other European markets.
  • Expansion of low-calorie and gluten-free RTD offerings
  • Growing role of RTD exports to nearby European countries
  • Increasing collaborations between breweries and global spirits companies

Competitive Landscape of the Pre-mixed/RTD Alcoholic Drink Market

Pre Mixed Rtd Alcoholic Drinks Market By Company

The market is moderately consolidated, featuring a mix of global beverage companies, specialty RTD producers, and regional brands with varying degrees of production capability, distribution expertise, and brand positioning strength. Mark Anthony Group leads the global market with a 25% share, driven by the success of White Claw and Mike's Hard Lemonade brands across North American and international markets. Their strength lies in comprehensive distribution networks, brand marketing excellence, and continuous flavor innovation capabilities.

Suntory Holdings Limited maintains a strong position through premium positioning, international expansion strategies, and high-quality product formulations targeting discerning consumers and export markets. Diageo plc leverages its extensive spirits portfolio to create premium RTD extensions of established brands. At the same time, Anheuser-Busch InBev utilizes its global distribution network and brewing expertise for scalable RTD production.

Asahi Breweries, Ltd. focuses on Asian market leadership and innovative product development, emphasizing quality and authentic flavor experiences tailored to regional preferences.

Entry barriers remain significant, driven by challenges in regulatory compliance, distribution network establishment, and brand-building requirements across multiple consumer segments. Competitiveness increasingly depends on flavor innovation capabilities, distribution excellence, and marketing effectiveness for diverse demographic and occasion-based consumption environments.

Scope of Report

Items Value
Quantitative Units (2025) USD 37.2 billion
Product Type Rum, Whiskey, Vodka, Wine, Others
Flavor Fruits, Spiced, Others
Packaging Cans, Bottles, Others
Distribution Channel Hyper/Supermarket Stores, Departmental Stores, Specialty Stores, Online Retailers
Regions Covered North America, Latin America, Europe, East Asia, South Asia & Pacific, Middle East & Africa
Countries Covered United States, Canada, United Kingdom, Germany, France, China, Japan, South Korea, Brazil, Australia, India and 40+ Countries
Key Companies Profiled Diageo plc, Asahi Breweries Ltd., Suntory Holdings Limited, Halewood International Limited, The Brown-Forman Corporation, Bacardi Limited, Mike's Hard Lemonade Co, Pernod Ricard SA, Anheuser-Busch InBev SA/NV
Additional Attributes Dollar sales by product type and packaging, regional consumption trends, competitive landscape, adoption of ready-to-drink and pre-mixed formulations, integration with distribution channels, innovations in flavor profiles and low-alcohol variants

Key Segments

By Product Type:

  • High Strength Premix
  • Malt Based
  • Spirit Based
  • Wine Based
  • Hard seltzer
  • Other Alcoholic RTDs

By Distribution Channel:

  • Store Based
  • Mass Merchandisers
  • Online Retail
  • Bars, Pubs, and Clubs
  • Fine Dining Restaurants
  • Others

By Region:

  • North America
  • Latin America
  • Europe
  • South Asia
  • East Asia
  • Oceania
  • The Middle East and Africa (MEA)

Table of Content

  1. Executive Summary
    • Global Market Outlook
    • Demand-side Trends
    • Supply-side Trends
    • Technology Roadmap Analysis
    • Analysis and Recommendations
  2. Market Overview
    • Market Coverage / Taxonomy
    • Market Definition / Scope / Limitations
  3. Market Background
    • Market Dynamics
      • Drivers
      • Restraints
      • Opportunity
      • Trends
    • Scenario Forecast
      • Demand in Optimistic Scenario
      • Demand in Likely Scenario
      • Demand in Conservative Scenario
    • Opportunity Map Analysis
    • Product Life Cycle Analysis
    • Supply Chain Analysis
      • Supply Side Participants and their Roles
        • Producers
        • Mid-Level Participants (Traders/ Agents/ Brokers)
        • Wholesalers and Distributors
      • Value Added and Value Created at Node in the Supply Chain
      • List of Raw Material Suppliers
      • List of Existing and Potential Buyer’s
    • Investment Feasibility Matrix
    • Value Chain Analysis
      • Profit Margin Analysis
      • Wholesalers and Distributors
      • Retailers
    • PESTLE and Porter’s Analysis
    • Regulatory Landscape
      • By Key Regions
      • By Key Countries
    • Regional Parent Market Outlook
    • Production and Consumption Statistics
    • Import and Export Statistics
  4. Global Market Analysis 2020 to 2024 and Forecast, 2025 to 2035
    • Historical Market Size Value (USD Billion) & Volume (Kilotons) Analysis, 2020 to 2024
    • Current and Future Market Size Value (USD Billion) & Volume (Kilotons) Projections, 2025 to 2035
      • Y-o-Y Growth Trend Analysis
      • Absolute $ Opportunity Analysis
  5. Global Market Pricing Analysis 2020 to 2024 and Forecast 2025 to 2035
  6. Global Market Analysis 2020 to 2024 and Forecast 2025 to 2035, By Product Type
    • Introduction / Key Findings
    • Historical Market Size Value (USD Billion) & Volume (Kilotons) Analysis By Product Type, 2020 to 2024
    • Current and Future Market Size Value (USD Billion) & Volume (Kilotons) Analysis and Forecast By Product Type, 2025 to 2035
      • Rum
      • Whiskey
      • Vodka
      • Wine
      • Others
    • Y-o-Y Growth Trend Analysis By Product Type, 2020 to 2024
    • Absolute $ Opportunity Analysis By Product Type, 2025 to 2035
  7. Global Market Analysis 2020 to 2024 and Forecast 2025 to 2035, By Flavor
    • Introduction / Key Findings
    • Historical Market Size Value (USD Billion) & Volume (Kilotons) Analysis By Flavor, 2020 to 2024
    • Current and Future Market Size Value (USD Billion) & Volume (Kilotons) Analysis and Forecast By Flavor, 2025 to 2035
      • Fruits
      • Spiced
      • Others
    • Y-o-Y Growth Trend Analysis By Flavor, 2020 to 2024
    • Absolute $ Opportunity Analysis By Flavor, 2025 to 2035
  8. Global Market Analysis 2020 to 2024 and Forecast 2025 to 2035, By Packaging
    • Introduction / Key Findings
    • Historical Market Size Value (USD Billion) & Volume (Kilotons) Analysis By Packaging, 2020 to 2024
    • Current and Future Market Size Value (USD Billion) & Volume (Kilotons) Analysis and Forecast By Packaging, 2025 to 2035
      • Cans
      • Bottles
      • Others
    • Y-o-Y Growth Trend Analysis By Packaging, 2020 to 2024
    • Absolute $ Opportunity Analysis By Packaging, 2025 to 2035
  9. Global Market Analysis 2020 to 2024 and Forecast 2025 to 2035, By Distribution Channel
    • Introduction / Key Findings
    • Historical Market Size Value (USD Billion) & Volume (Kilotons) Analysis By Distribution Channel, 2020 to 2024
    • Current and Future Market Size Value (USD Billion) & Volume (Kilotons) Analysis and Forecast By Distribution Channel, 2025 to 2035
      • Hyper/Supermarket Stores
      • Departmental Stores
      • Specialty Stores
      • Online Retailers
    • Y-o-Y Growth Trend Analysis By Distribution Channel, 2020 to 2024
    • Absolute $ Opportunity Analysis By Distribution Channel, 2025 to 2035
  10. Global Market Analysis 2020 to 2024 and Forecast 2025 to 2035, By Region
    • Introduction
    • Historical Market Size Value (USD Billion) & Volume (Kilotons) Analysis By Region, 2020 to 2024
    • Current Market Size Value (USD Billion) & Volume (Kilotons) Analysis and Forecast By Region, 2025 to 2035
      • North America
      • Latin America
      • Western Europe
      • Eastern Europe
      • East Asia
      • South Asia & Pacific
      • Middle East and Africa
    • Market Attractiveness Analysis By Region
  11. North America Market Analysis 2020 to 2024 and Forecast 2025 to 2035, By Country
    • Historical Market Size Value (USD Billion) & Volume (Kilotons) Trend Analysis By Market Taxonomy, 2020 to 2024
    • Market Size Value (USD Billion) & Volume (Kilotons) Forecast By Market Taxonomy, 2025 to 2035
      • By Country
        • USA
        • Canada
        • Mexico
      • By Product Type
      • By Flavor
      • By Packaging
      • By Distribution Channel
    • Market Attractiveness Analysis
      • By Country
      • By Product Type
      • By Flavor
      • By Packaging
      • By Distribution Channel
    • Key Takeaways
  12. Latin America Market Analysis 2020 to 2024 and Forecast 2025 to 2035, By Country
    • Historical Market Size Value (USD Billion) & Volume (Kilotons) Trend Analysis By Market Taxonomy, 2020 to 2024
    • Market Size Value (USD Billion) & Volume (Kilotons) Forecast By Market Taxonomy, 2025 to 2035
      • By Country
        • Brazil
        • Argentina
        • Rest of LATAM
      • By Product Type
      • By Flavor
      • By Packaging
      • By Distribution Channel
    • Market Attractiveness Analysis
      • By Country
      • By Product Type
      • By Flavor
      • By Packaging
      • By Distribution Channel
    • Key Takeaways
  13. Western Europe Market Analysis 2020 to 2024 and Forecast 2025 to 2035, By Country
    • Historical Market Size Value (USD Billion) & Volume (Kilotons) Trend Analysis By Market Taxonomy, 2020 to 2024
    • Market Size Value (USD Billion) & Volume (Kilotons) Forecast By Market Taxonomy, 2025 to 2035
      • By Country
        • Germany
        • Italy
        • France
        • UK
        • Spain
        • BENELUX
        • Nordic
        • Rest of W.Europe
      • By Product Type
      • By Flavor
      • By Packaging
      • By Distribution Channel
    • Market Attractiveness Analysis
      • By Country
      • By Product Type
      • By Flavor
      • By Packaging
      • By Distribution Channel
    • Key Takeaways
  14. Eastern Europe Market Analysis 2020 to 2024 and Forecast 2025 to 2035, By Country
    • Historical Market Size Value (USD Billion) & Volume (Kilotons) Trend Analysis By Market Taxonomy, 2020 to 2024
    • Market Size Value (USD Billion) & Volume (Kilotons) Forecast By Market Taxonomy, 2025 to 2035
      • By Country
        • Russia
        • Hungary
        • Poland
        • Balkan & Baltics
        • Rest of E. Europe
      • By Product Type
      • By Flavor
      • By Packaging
      • By Distribution Channel
    • Market Attractiveness Analysis
      • By Country
      • By Product Type
      • By Flavor
      • By Packaging
      • By Distribution Channel
    • Key Takeaways
  15. East Asia Market Analysis 2020 to 2024 and Forecast 2025 to 2035, By Country
    • Historical Market Size Value (USD Billion) & Volume (Kilotons) Trend Analysis By Market Taxonomy, 2020 to 2024
    • Market Size Value (USD Billion) & Volume (Kilotons) Forecast By Market Taxonomy, 2025 to 2035
      • By Country
        • China
        • Japan
        • South Korea
      • By Product Type
      • By Flavor
      • By Packaging
      • By Distribution Channel
    • Market Attractiveness Analysis
      • By Country
      • By Product Type
      • By Flavor
      • By Packaging
      • By Distribution Channel
    • Key Takeaways
  16. South Asia & Pacific Market Analysis 2020 to 2024 and Forecast 2025 to 2035, By Country
    • Historical Market Size Value (USD Billion) & Volume (Kilotons) Trend Analysis By Market Taxonomy, 2020 to 2024
    • Market Size Value (USD Billion) & Volume (Kilotons) Forecast By Market Taxonomy, 2025 to 2035
      • By Country
        • India
        • Australia & New Zealand
        • ASEAN
        • Rest of SAP
      • By Product Type
      • By Flavor
      • By Packaging
      • By Distribution Channel
    • Market Attractiveness Analysis
      • By Country
      • By Product Type
      • By Flavor
      • By Packaging
      • By Distribution Channel
    • Key Takeaways
  17. Middle East and Africa Market Analysis 2020 to 2024 and Forecast 2025 to 2035, By Country
    • Historical Market Size Value (USD Billion) & Volume (Kilotons) Trend Analysis By Market Taxonomy, 2020 to 2024
    • Market Size Value (USD Billion) & Volume (Kilotons) Forecast By Market Taxonomy, 2025 to 2035
      • By Country
        • GCC Countries
        • Northern Africa
        • South Africa
        • Turkiye
        • Rest of MEA
      • By Product Type
      • By Flavor
      • By Packaging
      • By Distribution Channel
    • Market Attractiveness Analysis
      • By Country
      • By Product Type
      • By Flavor
      • By Packaging
      • By Distribution Channel
    • Key Takeaways
  18. Key Countries Market Analysis
    • USA
      • Pricing Analysis
      • Market Share Analysis, 2024
        • By Product Type
        • By Flavor
        • By Packaging
        • By Distribution Channel
    • Canada
      • Pricing Analysis
      • Market Share Analysis, 2024
        • By Product Type
        • By Flavor
        • By Packaging
        • By Distribution Channel
    • Brazil
      • Pricing Analysis
      • Market Share Analysis, 2024
        • By Product Type
        • By Flavor
        • By Packaging
        • By Distribution Channel
    • Mexico
      • Pricing Analysis
      • Market Share Analysis, 2024
        • By Product Type
        • By Flavor
        • By Packaging
        • By Distribution Channel
    • Argentina
      • Pricing Analysis
      • Market Share Analysis, 2024
        • By Product Type
        • By Flavor
        • By Packaging
        • By Distribution Channel
  19. Market Structure Analysis
    • Competition Dashboard
    • Competition Benchmarking
    • Market Share Analysis of Top Players
      • By Regional
      • By Product Type
      • By Flavor
      • By Packaging
      • By Distribution Channel
  20. Competition Analysis
    • Competition Deep Dive
      • Diageo plc
        • Overview
        • Product Portfolio
        • Profitability by Market Segments (Product/Age /Sales Channel/Region)
        • Sales Footprint
        • Strategy Overview
          • Marketing Strategy
          • Product Strategy
          • Channel Strategy
      • Asahi Breweries Ltd.
        • Overview
        • Product Portfolio
        • Profitability by Market Segments (Product/Age /Sales Channel/Region)
        • Sales Footprint
        • Strategy Overview
          • Marketing Strategy
          • Product Strategy
          • Channel Strategy
      • Suntory Holdings Ltd.
        • Overview
        • Product Portfolio
        • Profitability by Market Segments (Product/Age /Sales Channel/Region)
        • Sales Footprint
        • Strategy Overview
          • Marketing Strategy
          • Product Strategy
          • Channel Strategy
      • Halewood International Ltd.
        • Overview
        • Product Portfolio
        • Profitability by Market Segments (Product/Age /Sales Channel/Region)
        • Sales Footprint
        • Strategy Overview
          • Marketing Strategy
          • Product Strategy
          • Channel Strategy
      • The Brown-Forman Corporation
        • Overview
        • Product Portfolio
        • Profitability by Market Segments (Product/Age /Sales Channel/Region)
        • Sales Footprint
        • Strategy Overview
          • Marketing Strategy
          • Product Strategy
          • Channel Strategy
      • Bacardi Limited
        • Overview
        • Product Portfolio
        • Profitability by Market Segments (Product/Age /Sales Channel/Region)
        • Sales Footprint
        • Strategy Overview
          • Marketing Strategy
          • Product Strategy
          • Channel Strategy
      • Mike's Hard Lemonade Co
        • Overview
        • Product Portfolio
        • Profitability by Market Segments (Product/Age /Sales Channel/Region)
        • Sales Footprint
        • Strategy Overview
          • Marketing Strategy
          • Product Strategy
          • Channel Strategy
      • Pernod Ricard SA
        • Overview
        • Product Portfolio
        • Profitability by Market Segments (Product/Age /Sales Channel/Region)
        • Sales Footprint
        • Strategy Overview
          • Marketing Strategy
          • Product Strategy
          • Channel Strategy
      • Anheuser-Busch InBev SA/NV
        • Overview
        • Product Portfolio
        • Profitability by Market Segments (Product/Age /Sales Channel/Region)
        • Sales Footprint
        • Strategy Overview
          • Marketing Strategy
          • Product Strategy
          • Channel Strategy
  21. Assumptions & Acronyms Used
  22. Research Methodology

List of Tables

  • Table 1: Global Market Value (USD Billion) Forecast by Region, 2020-2035
  • Table 2: Global Market Volume (Kilotons) Forecast by Region, 2020-2035
  • Table 3: Global Market Value (USD Billion) Forecast by Product Type, 2020-2035
  • Table 4: Global Market Volume (Kilotons) Forecast by Product Type, 2020-2035
  • Table 5: Global Market Value (USD Billion) Forecast by Flavor, 2020-2035
  • Table 6: Global Market Volume (Kilotons) Forecast by Flavor, 2020-2035
  • Table 7: Global Market Value (USD Billion) Forecast by Packaging, 2020-2035
  • Table 8: Global Market Volume (Kilotons) Forecast by Packaging, 2020-2035
  • Table 9: Global Market Value (USD Billion) Forecast by Distribution Channel, 2020-2035
  • Table 10: Global Market Volume (Kilotons) Forecast by Distribution Channel, 2020-2035
  • Table 11: North America Market Value (USD Billion) Forecast by Country, 2020-2035
  • Table 12: North America Market Volume (Kilotons) Forecast by Country, 2020-2035
  • Table 13: North America Market Value (USD Billion) Forecast by Product Type, 2020-2035
  • Table 14: North America Market Volume (Kilotons) Forecast by Product Type, 2020-2035
  • Table 15: North America Market Value (USD Billion) Forecast by Flavor, 2020-2035
  • Table 16: North America Market Volume (Kilotons) Forecast by Flavor, 2020-2035
  • Table 17: North America Market Value (USD Billion) Forecast by Packaging, 2020-2035
  • Table 18: North America Market Volume (Kilotons) Forecast by Packaging, 2020-2035
  • Table 19: North America Market Value (USD Billion) Forecast by Distribution Channel, 2020-2035
  • Table 20: North America Market Volume (Kilotons) Forecast by Distribution Channel, 2020-2035
  • Table 21: Latin America Market Value (USD Billion) Forecast by Country, 2020-2035
  • Table 22: Latin America Market Volume (Kilotons) Forecast by Country, 2020-2035
  • Table 23: Latin America Market Value (USD Billion) Forecast by Product Type, 2020-2035
  • Table 24: Latin America Market Volume (Kilotons) Forecast by Product Type, 2020-2035
  • Table 25: Latin America Market Value (USD Billion) Forecast by Flavor, 2020-2035
  • Table 26: Latin America Market Volume (Kilotons) Forecast by Flavor, 2020-2035
  • Table 27: Latin America Market Value (USD Billion) Forecast by Packaging, 2020-2035
  • Table 28: Latin America Market Volume (Kilotons) Forecast by Packaging, 2020-2035
  • Table 29: Latin America Market Value (USD Billion) Forecast by Distribution Channel, 2020-2035
  • Table 30: Latin America Market Volume (Kilotons) Forecast by Distribution Channel, 2020-2035
  • Table 31: Western Europe Market Value (USD Billion) Forecast by Country, 2020-2035
  • Table 32: Western Europe Market Volume (Kilotons) Forecast by Country, 2020-2035
  • Table 33: Western Europe Market Value (USD Billion) Forecast by Product Type, 2020-2035
  • Table 34: Western Europe Market Volume (Kilotons) Forecast by Product Type, 2020-2035
  • Table 35: Western Europe Market Value (USD Billion) Forecast by Flavor, 2020-2035
  • Table 36: Western Europe Market Volume (Kilotons) Forecast by Flavor, 2020-2035
  • Table 37: Western Europe Market Value (USD Billion) Forecast by Packaging, 2020-2035
  • Table 38: Western Europe Market Volume (Kilotons) Forecast by Packaging, 2020-2035
  • Table 39: Western Europe Market Value (USD Billion) Forecast by Distribution Channel, 2020-2035
  • Table 40: Western Europe Market Volume (Kilotons) Forecast by Distribution Channel, 2020-2035
  • Table 41: Eastern Europe Market Value (USD Billion) Forecast by Country, 2020-2035
  • Table 42: Eastern Europe Market Volume (Kilotons) Forecast by Country, 2020-2035
  • Table 43: Eastern Europe Market Value (USD Billion) Forecast by Product Type, 2020-2035
  • Table 44: Eastern Europe Market Volume (Kilotons) Forecast by Product Type, 2020-2035
  • Table 45: Eastern Europe Market Value (USD Billion) Forecast by Flavor, 2020-2035
  • Table 46: Eastern Europe Market Volume (Kilotons) Forecast by Flavor, 2020-2035
  • Table 47: Eastern Europe Market Value (USD Billion) Forecast by Packaging, 2020-2035
  • Table 48: Eastern Europe Market Volume (Kilotons) Forecast by Packaging, 2020-2035
  • Table 49: Eastern Europe Market Value (USD Billion) Forecast by Distribution Channel, 2020-2035
  • Table 50: Eastern Europe Market Volume (Kilotons) Forecast by Distribution Channel, 2020-2035
  • Table 51: East Asia Market Value (USD Billion) Forecast by Country, 2020-2035
  • Table 52: East Asia Market Volume (Kilotons) Forecast by Country, 2020-2035
  • Table 53: East Asia Market Value (USD Billion) Forecast by Product Type, 2020-2035
  • Table 54: East Asia Market Volume (Kilotons) Forecast by Product Type, 2020-2035
  • Table 55: East Asia Market Value (USD Billion) Forecast by Flavor, 2020-2035
  • Table 56: East Asia Market Volume (Kilotons) Forecast by Flavor, 2020-2035
  • Table 57: East Asia Market Value (USD Billion) Forecast by Packaging, 2020-2035
  • Table 58: East Asia Market Volume (Kilotons) Forecast by Packaging, 2020-2035
  • Table 59: East Asia Market Value (USD Billion) Forecast by Distribution Channel, 2020-2035
  • Table 60: East Asia Market Volume (Kilotons) Forecast by Distribution Channel, 2020-2035
  • Table 61: South Asia & Pacific Market Value (USD Billion) Forecast by Country, 2020-2035
  • Table 62: South Asia & Pacific Market Volume (Kilotons) Forecast by Country, 2020-2035
  • Table 63: South Asia & Pacific Market Value (USD Billion) Forecast by Product Type, 2020-2035
  • Table 64: South Asia & Pacific Market Volume (Kilotons) Forecast by Product Type, 2020-2035
  • Table 65: South Asia & Pacific Market Value (USD Billion) Forecast by Flavor, 2020-2035
  • Table 66: South Asia & Pacific Market Volume (Kilotons) Forecast by Flavor, 2020-2035
  • Table 67: South Asia & Pacific Market Value (USD Billion) Forecast by Packaging, 2020-2035
  • Table 68: South Asia & Pacific Market Volume (Kilotons) Forecast by Packaging, 2020-2035
  • Table 69: South Asia & Pacific Market Value (USD Billion) Forecast by Distribution Channel, 2020-2035
  • Table 70: South Asia & Pacific Market Volume (Kilotons) Forecast by Distribution Channel, 2020-2035
  • Table 71: Middle East and Africa Market Value (USD Billion) Forecast by Country, 2020-2035
  • Table 72: Middle East and Africa Market Volume (Kilotons) Forecast by Country, 2020-2035
  • Table 73: Middle East and Africa Market Value (USD Billion) Forecast by Product Type, 2020-2035
  • Table 74: Middle East and Africa Market Volume (Kilotons) Forecast by Product Type, 2020-2035
  • Table 75: Middle East and Africa Market Value (USD Billion) Forecast by Flavor, 2020-2035
  • Table 76: Middle East and Africa Market Volume (Kilotons) Forecast by Flavor, 2020-2035
  • Table 77: Middle East and Africa Market Value (USD Billion) Forecast by Packaging, 2020-2035
  • Table 78: Middle East and Africa Market Volume (Kilotons) Forecast by Packaging, 2020-2035
  • Table 79: Middle East and Africa Market Value (USD Billion) Forecast by Distribution Channel, 2020-2035
  • Table 80: Middle East and Africa Market Volume (Kilotons) Forecast by Distribution Channel, 2020-2035

List of Figures

  • Figure 1: Global Market Volume (Kilotons) Forecast 2020-2035
  • Figure 2: Global Market Pricing Analysis
  • Figure 3: Global Market Value (USD Billion) Forecast 2020-2035
  • Figure 4: Global Market Value Share and BPS Analysis by Product Type, 2025 and 2035
  • Figure 5: Global Market Y-o-Y Growth Comparison by Product Type, 2025-2035
  • Figure 6: Global Market Attractiveness Analysis by Product Type
  • Figure 7: Global Market Value Share and BPS Analysis by Flavor, 2025 and 2035
  • Figure 8: Global Market Y-o-Y Growth Comparison by Flavor, 2025-2035
  • Figure 9: Global Market Attractiveness Analysis by Flavor
  • Figure 10: Global Market Value Share and BPS Analysis by Packaging, 2025 and 2035
  • Figure 11: Global Market Y-o-Y Growth Comparison by Packaging, 2025-2035
  • Figure 12: Global Market Attractiveness Analysis by Packaging
  • Figure 13: Global Market Value Share and BPS Analysis by Distribution Channel, 2025 and 2035
  • Figure 14: Global Market Y-o-Y Growth Comparison by Distribution Channel, 2025-2035
  • Figure 15: Global Market Attractiveness Analysis by Distribution Channel
  • Figure 16: Global Market Value (USD Billion) Share and BPS Analysis by Region, 2025 and 2035
  • Figure 17: Global Market Y-o-Y Growth Comparison by Region, 2025-2035
  • Figure 18: Global Market Attractiveness Analysis by Region
  • Figure 19: North America Market Incremental $ Opportunity, 2025-2035
  • Figure 20: Latin America Market Incremental $ Opportunity, 2025-2035
  • Figure 21: Western Europe Market Incremental $ Opportunity, 2025-2035
  • Figure 22: Eastern Europe Market Incremental $ Opportunity, 2025-2035
  • Figure 23: East Asia Market Incremental $ Opportunity, 2025-2035
  • Figure 24: South Asia & Pacific Market Incremental $ Opportunity, 2025-2035
  • Figure 25: Middle East and Africa Market Incremental $ Opportunity, 2025-2035
  • Figure 26: North America Market Value Share and BPS Analysis by Country, 2025 and 2035
  • Figure 27: North America Market Value Share and BPS Analysis by Product Type, 2025 and 2035
  • Figure 28: North America Market Y-o-Y Growth Comparison by Product Type, 2025-2035
  • Figure 29: North America Market Attractiveness Analysis by Product Type
  • Figure 30: North America Market Value Share and BPS Analysis by Flavor, 2025 and 2035
  • Figure 31: North America Market Y-o-Y Growth Comparison by Flavor, 2025-2035
  • Figure 32: North America Market Attractiveness Analysis by Flavor
  • Figure 33: North America Market Value Share and BPS Analysis by Packaging, 2025 and 2035
  • Figure 34: North America Market Y-o-Y Growth Comparison by Packaging, 2025-2035
  • Figure 35: North America Market Attractiveness Analysis by Packaging
  • Figure 36: North America Market Value Share and BPS Analysis by Distribution Channel, 2025 and 2035
  • Figure 37: North America Market Y-o-Y Growth Comparison by Distribution Channel, 2025-2035
  • Figure 38: North America Market Attractiveness Analysis by Distribution Channel
  • Figure 39: Latin America Market Value Share and BPS Analysis by Country, 2025 and 2035
  • Figure 40: Latin America Market Value Share and BPS Analysis by Product Type, 2025 and 2035
  • Figure 41: Latin America Market Y-o-Y Growth Comparison by Product Type, 2025-2035
  • Figure 42: Latin America Market Attractiveness Analysis by Product Type
  • Figure 43: Latin America Market Value Share and BPS Analysis by Flavor, 2025 and 2035
  • Figure 44: Latin America Market Y-o-Y Growth Comparison by Flavor, 2025-2035
  • Figure 45: Latin America Market Attractiveness Analysis by Flavor
  • Figure 46: Latin America Market Value Share and BPS Analysis by Packaging, 2025 and 2035
  • Figure 47: Latin America Market Y-o-Y Growth Comparison by Packaging, 2025-2035
  • Figure 48: Latin America Market Attractiveness Analysis by Packaging
  • Figure 49: Latin America Market Value Share and BPS Analysis by Distribution Channel, 2025 and 2035
  • Figure 50: Latin America Market Y-o-Y Growth Comparison by Distribution Channel, 2025-2035
  • Figure 51: Latin America Market Attractiveness Analysis by Distribution Channel
  • Figure 52: Western Europe Market Value Share and BPS Analysis by Country, 2025 and 2035
  • Figure 53: Western Europe Market Value Share and BPS Analysis by Product Type, 2025 and 2035
  • Figure 54: Western Europe Market Y-o-Y Growth Comparison by Product Type, 2025-2035
  • Figure 55: Western Europe Market Attractiveness Analysis by Product Type
  • Figure 56: Western Europe Market Value Share and BPS Analysis by Flavor, 2025 and 2035
  • Figure 57: Western Europe Market Y-o-Y Growth Comparison by Flavor, 2025-2035
  • Figure 58: Western Europe Market Attractiveness Analysis by Flavor
  • Figure 59: Western Europe Market Value Share and BPS Analysis by Packaging, 2025 and 2035
  • Figure 60: Western Europe Market Y-o-Y Growth Comparison by Packaging, 2025-2035
  • Figure 61: Western Europe Market Attractiveness Analysis by Packaging
  • Figure 62: Western Europe Market Value Share and BPS Analysis by Distribution Channel, 2025 and 2035
  • Figure 63: Western Europe Market Y-o-Y Growth Comparison by Distribution Channel, 2025-2035
  • Figure 64: Western Europe Market Attractiveness Analysis by Distribution Channel
  • Figure 65: Eastern Europe Market Value Share and BPS Analysis by Country, 2025 and 2035
  • Figure 66: Eastern Europe Market Value Share and BPS Analysis by Product Type, 2025 and 2035
  • Figure 67: Eastern Europe Market Y-o-Y Growth Comparison by Product Type, 2025-2035
  • Figure 68: Eastern Europe Market Attractiveness Analysis by Product Type
  • Figure 69: Eastern Europe Market Value Share and BPS Analysis by Flavor, 2025 and 2035
  • Figure 70: Eastern Europe Market Y-o-Y Growth Comparison by Flavor, 2025-2035
  • Figure 71: Eastern Europe Market Attractiveness Analysis by Flavor
  • Figure 72: Eastern Europe Market Value Share and BPS Analysis by Packaging, 2025 and 2035
  • Figure 73: Eastern Europe Market Y-o-Y Growth Comparison by Packaging, 2025-2035
  • Figure 74: Eastern Europe Market Attractiveness Analysis by Packaging
  • Figure 75: Eastern Europe Market Value Share and BPS Analysis by Distribution Channel, 2025 and 2035
  • Figure 76: Eastern Europe Market Y-o-Y Growth Comparison by Distribution Channel, 2025-2035
  • Figure 77: Eastern Europe Market Attractiveness Analysis by Distribution Channel
  • Figure 78: East Asia Market Value Share and BPS Analysis by Country, 2025 and 2035
  • Figure 79: East Asia Market Value Share and BPS Analysis by Product Type, 2025 and 2035
  • Figure 80: East Asia Market Y-o-Y Growth Comparison by Product Type, 2025-2035
  • Figure 81: East Asia Market Attractiveness Analysis by Product Type
  • Figure 82: East Asia Market Value Share and BPS Analysis by Flavor, 2025 and 2035
  • Figure 83: East Asia Market Y-o-Y Growth Comparison by Flavor, 2025-2035
  • Figure 84: East Asia Market Attractiveness Analysis by Flavor
  • Figure 85: East Asia Market Value Share and BPS Analysis by Packaging, 2025 and 2035
  • Figure 86: East Asia Market Y-o-Y Growth Comparison by Packaging, 2025-2035
  • Figure 87: East Asia Market Attractiveness Analysis by Packaging
  • Figure 88: East Asia Market Value Share and BPS Analysis by Distribution Channel, 2025 and 2035
  • Figure 89: East Asia Market Y-o-Y Growth Comparison by Distribution Channel, 2025-2035
  • Figure 90: East Asia Market Attractiveness Analysis by Distribution Channel
  • Figure 91: South Asia & Pacific Market Value Share and BPS Analysis by Country, 2025 and 2035
  • Figure 92: South Asia & Pacific Market Value Share and BPS Analysis by Product Type, 2025 and 2035
  • Figure 93: South Asia & Pacific Market Y-o-Y Growth Comparison by Product Type, 2025-2035
  • Figure 94: South Asia & Pacific Market Attractiveness Analysis by Product Type
  • Figure 95: South Asia & Pacific Market Value Share and BPS Analysis by Flavor, 2025 and 2035
  • Figure 96: South Asia & Pacific Market Y-o-Y Growth Comparison by Flavor, 2025-2035
  • Figure 97: South Asia & Pacific Market Attractiveness Analysis by Flavor
  • Figure 98: South Asia & Pacific Market Value Share and BPS Analysis by Packaging, 2025 and 2035
  • Figure 99: South Asia & Pacific Market Y-o-Y Growth Comparison by Packaging, 2025-2035
  • Figure 100: South Asia & Pacific Market Attractiveness Analysis by Packaging
  • Figure 101: South Asia & Pacific Market Value Share and BPS Analysis by Distribution Channel, 2025 and 2035
  • Figure 102: South Asia & Pacific Market Y-o-Y Growth Comparison by Distribution Channel, 2025-2035
  • Figure 103: South Asia & Pacific Market Attractiveness Analysis by Distribution Channel
  • Figure 104: Middle East and Africa Market Value Share and BPS Analysis by Country, 2025 and 2035
  • Figure 105: Middle East and Africa Market Value Share and BPS Analysis by Product Type, 2025 and 2035
  • Figure 106: Middle East and Africa Market Y-o-Y Growth Comparison by Product Type, 2025-2035
  • Figure 107: Middle East and Africa Market Attractiveness Analysis by Product Type
  • Figure 108: Middle East and Africa Market Value Share and BPS Analysis by Flavor, 2025 and 2035
  • Figure 109: Middle East and Africa Market Y-o-Y Growth Comparison by Flavor, 2025-2035
  • Figure 110: Middle East and Africa Market Attractiveness Analysis by Flavor
  • Figure 111: Middle East and Africa Market Value Share and BPS Analysis by Packaging, 2025 and 2035
  • Figure 112: Middle East and Africa Market Y-o-Y Growth Comparison by Packaging, 2025-2035
  • Figure 113: Middle East and Africa Market Attractiveness Analysis by Packaging
  • Figure 114: Middle East and Africa Market Value Share and BPS Analysis by Distribution Channel, 2025 and 2035
  • Figure 115: Middle East and Africa Market Y-o-Y Growth Comparison by Distribution Channel, 2025-2035
  • Figure 116: Middle East and Africa Market Attractiveness Analysis by Distribution Channel
  • Figure 117: Global Market - Tier Structure Analysis
  • Figure 118: Global Market - Company Share Analysis

Frequently Asked Questions

How big is the pre-mixed/RTD alcoholic drink market in 2025?

The global pre-mixed/RTD alcoholic drink market is estimated to be valued at USD 37.2 billion in 2025.

What will be the size of the pre-mixed/RTD alcoholic drink market in 2035?

The market size for pre-mixed/RTD alcoholic drink is projected to reach USD 59.5 billion by 2035.

How much will be the pre-mixed/RTD alcoholic drink market growth between 2025 and 2035?

The pre-mixed/RTD alcoholic drink market is expected to grow at a 4.8% CAGR between 2025 and 2035.

Which flavor type is projected to lead in the pre-mixed/RTD alcoholic drink market in 2025?

The fruits flavor segment is projected to lead in the pre-mixed/RTD alcoholic drink market with 53% share in 2025.

Which distribution channel segment will contribute a significant share in the pre-mixed/RTD alcoholic drink market in 2025?

In terms of distribution channel, hyper/supermarket stores are projected to command 45% share in the pre-mixed/RTD alcoholic drink market in 2025.

Explore Similar Insights

Future Market Insights

Pre-mixed/RTD Alcoholic Drink Market

Chat With

MaRIA

Hi There, I am MaRIA, Your Market Research Intelligence Assistant. How may I help you?