AI-powered Care Coordination Market Forecast and Outlook 2025 to 2035

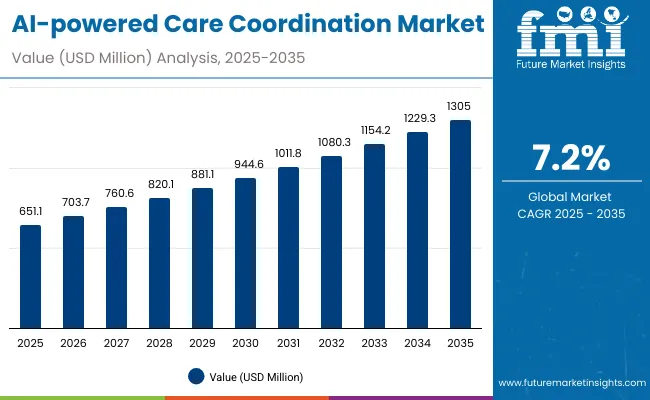
The AI-powered care coordination industry stands at the threshold of a decade-long expansion trajectory that promises to reshape healthcare delivery and patient management technology. The market's journey from USD 651.1 million in 2025 to USD 1305.0 million by 2035 represents substantial growth, demonstrating the accelerating adoption of artificial intelligence solutions and integrated care management systems across healthcare providers, payer organizations, and digital health platforms.
Quick Stats for AI-powered Care Coordination Market

  • AI-powered Care Coordination Market Value (2025): USD 651.1 million
  • AI-powered Care Coordination Market Forecast Value (2035): USD 1305.0 million
  • AI-powered Care Coordination Market Forecast CAGR: 7.2%
  • Leading Deployment Model in AI-powered Care Coordination Market: Cloud-based SaaS
  • Key Growth Regions in AI-powered Care Coordination Market: North America, Europe, and Asia Pacific
  • Top Key Players in AI-powered Care Coordination Market: Viz.ai Inc., Philips, Epic Systems Corporation, Allscripts Healthcare Solutions, Merative

Ai Powered Care Coordination Market

AI-powered Care Coordination Market Key Takeaways

Metric Value
Market Value (2025) USD 651.1 million
Market Forecast (2035) USD 1305.0 million
Growth Rate 7.2% CAGR
Leading Deployment Model Cloud-based SaaS
Primary Clinical Pathway Acute & Emergency Care

The first half of the decade (2025-2030) will witness the market climbing from USD 651.1 million to approximately USD 921.8 million, adding USD 270.7 million in value, which constitutes 41.4% of the total forecast growth period. This phase will be characterised by the rapid adoption of cloud-based AI platforms, driven by increasing healthcare digitization and care coordination complexities worldwide. Advanced machine learning capabilities and predictive analytics will become standard expectations rather than premium features.

The latter half (2030-2035) will witness accelerated growth from USD 921.8 million to USD 1305.0 million, representing an addition of USD 383.2 million or 58.6% of the decade's expansion. This period will be defined by mass market penetration of AI-driven care coordination systems, integration with comprehensive electronic health records, and seamless compatibility with existing healthcare infrastructure. The market trajectory signals fundamental shifts in how healthcare organizations approach patient care management, with participants positioned to benefit from sustained demand across multiple clinical pathway segments.

The AI-powered Care Coordination market demonstrates distinct growth phases with varying market characteristics and competitive dynamics. Between 2025 and 2030, the market progresses through its digital transformation phase, expanding from USD 651.1 million to USD 921.8 million with steady annual increments averaging 7.1% growth. This period showcases the transition from basic care coordination tools to sophisticated AI-driven platforms with enhanced predictive capabilities and integrated clinical decision support becoming mainstream features.

The 2025-2030 phase adds USD 270.7 million to market value, representing 41.4% of total decade expansion. Market maturation factors include standardisation of AI deployment protocols, declining costs for machine learning infrastructure, and increasing healthcare provider awareness of care coordination benefits reaching 85-90% effectiveness in patient outcome improvement applications. Competitive landscape evolution during this period features established healthcare technology companies expanding their AI portfolios while new entrants focus on specialized clinical pathways and enhanced interoperability solutions.

From 2030 to 2035, market dynamics shift toward advanced integration and multi-system deployment, with growth accelerating from USD 921.8 million to USD 1305.0 million, adding USD 383.2 million or 58.6% of total expansion. This phase transition centres on advanced AI algorithms, integration with population health management platforms, and deployment across diverse healthcare scenarios, becoming standard rather than specialized applications. The competitive environment matures with focus shifting from basic care coordination to comprehensive patient journey management and integration with value-based care models.

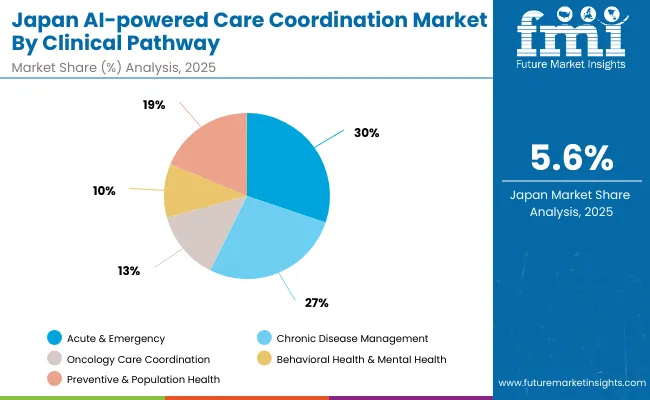
The market demonstrates strong fundamentals with cloud-based SaaS deployment models capturing a dominant 62.2% share through scalable infrastructure and cost-effective implementation capabilities. Acute & Emergency care applications drive primary demand with 31.2% market share, supported by increasing healthcare system complexity and critical care management requirements. Geographic expansion remains concentrated in developed markets with established healthcare infrastructure, while emerging economies show accelerating adoption rates driven by healthcare modernization and digital transformation initiatives.

Opportunity Pathways - AI-powered Care Coordination Market

The AI-powered care coordination market represents a compelling intersection of artificial intelligence, healthcare delivery optimization, and patient outcome improvement. With robust growth projected from USD 651.1 million in 2025 to USD 1305.0 million by 2035 at a 7.2% CAGR, this market is driven by increasing healthcare costs, provider workflow complexities, and regulatory pressures for improved care quality and coordination.

The market's expansion reflects a fundamental shift in how healthcare organizations approach patient care management and clinical workflow optimization. Strong growth opportunities exist across diverse applications, from acute care requiring real-time decision support to chronic disease management demanding longitudinal patient monitoring. Geographic expansion is particularly pronounced in Asia-Pacific markets, led by South Korea (9.4% CAGR) and India (5.4% CAGR), while established markets in North America and Europe drive premium positioning and technology innovation.

The dominance of cloud-based deployment models and acute care applications underscores the importance of scalable infrastructure and critical care management in driving adoption. Integration complexity and data privacy concerns remain key challenges, creating opportunities for companies that can simplify deployment while maintaining security standards.

  • Pathway A - Advanced AI Algorithm Development. Investment in machine learning models with enhanced predictive capabilities, real-time analytics, and clinical decision support can command premium pricing while meeting stringent healthcare requirements. Integration with natural language processing and computer vision creates competitive differentiation. Expected revenue pool: USD 200-280 million.
  • Pathway B - Clinical Pathway Specialization & Vertical Integration. Strategic focus on specific clinical areas such as oncology care coordination, chronic disease management, and behavioral health through customized AI solutions and specialized workflow optimization. Focus on evidence-based outcomes and clinical effectiveness. Revenue opportunity: USD 180-250 million.
  • Pathway C - Healthcare System Integration & Interoperability. Development of comprehensive platforms that seamlessly integrate with existing electronic health records, imaging systems, and clinical workflows, offering unified care coordination across multiple touchpoints. Pool: USD 150-200 million.
  • Pathway D - Population Health & Preventive Care Expansion. AI-driven solutions for population health management, social determinants analysis, and preventive care coordination that enable value-based care models and improve community health outcomes. Revenue uplift: USD 120-180 million.
  • Pathway E - Geographic Market Penetration & Localization. Expansion into high-growth markets through region-specific healthcare regulations, local partnership strategies, and compliance with national health data requirements. Expected upside: USD 100-150 million.
  • Pathway F - Remote Monitoring & Wearable Integration. Advanced care coordination platforms that integrate with remote patient monitoring devices, wearable technologies, and home health systems for comprehensive patient management. Innovation pool: USD 80-120 million.
  • Pathway G - Payer & Health Plan Solutions. Specialized AI coordination platforms for health insurance companies, managed care organizations, and government payers focused on cost reduction, utilization management, and member health outcomes. Strategic value: USD 70-110 million.

Why is the AI-powered Care Coordination Market Growing?

Market expansion rests on four fundamental shifts driving adoption across healthcare provider and payer sectors. Healthcare cost pressures create compelling economic advantages through AI-powered care coordination systems that reduce redundant procedures, prevent readmissions, and optimize resource utilization, enabling healthcare organizations to improve financial performance while maintaining quality care delivery. Clinical workflow complexity intensifies as healthcare providers seek integrated solutions that streamline patient management across multiple specialties, enabling coordinated care delivery that reduces medical errors and improves patient satisfaction.

Regulatory requirements accelerate adoption as government mandates for care quality reporting and value-based payment models drive demand for comprehensive coordination platforms that demonstrate measurable outcomes and compliance capabilities. Patient outcome improvement becomes paramount as healthcare organizations recognize AI's potential to enhance clinical decision-making, predict adverse events, and optimize treatment pathways for better health results.

However, growth faces headwinds from integration complexity challenges that vary across healthcare systems regarding existing technology infrastructure and workflow disruption, potentially limiting deployment flexibility in certain organizational environments. Data privacy and security concerns also persist regarding patient health information protection and regulatory compliance that may increase implementation costs and restrict data sharing capabilities.

Segmental Analysis

Primary Classification: The market segments by clinical pathway into Acute & Emergency, Chronic Disease Management, Oncology Care Coordination, Behavioral Health & Mental Health, and Preventive & Population Health categories, representing the evolution from episodic care to comprehensive patient journey management.

Secondary Breakdown: Data source segmentation divides the market into Imaging-based AI, EHR/Clinical Data, Claims & Payer Data, Remote Monitoring & Wearables, and Social Determinants of Health sectors, reflecting distinct information inputs for comprehensive care coordination analytics.

Tertiary Classification: Deployment model segmentation covers Cloud-based SaaS, On-premise, and Hybrid Models, with cloud solutions leading adoption while emerging hybrid approaches show accelerating growth patterns driven by security and compliance requirements.

The segmentation structure reveals technology progression from basic care coordination systems toward integrated AI platforms with comprehensive data analytics and predictive capabilities, while deployment diversity spans from traditional on-premise installations to modern cloud-native solutions requiring distinct implementation strategies.
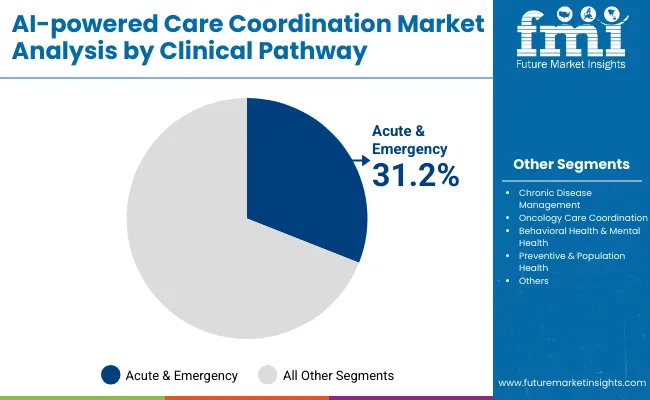
By Clinical Pathway, the Acute & Emergency Segment Accounts for 31.2% Market Share

Ai Powered Care Coordination Market By Clinical Pathway

Market Position: Acute & Emergency care coordination commands the leading position in the AI-powered Care Coordination market through critical decision support capabilities, including real-time patient monitoring, emergency response optimization, and cross-departmental communication systems that enable healthcare providers to deliver timely, coordinated care during high-stakes clinical scenarios.

Value Drivers: The segment benefits from healthcare provider prioritization of patient safety and emergency response efficiency that provides immediate clinical value through reduced response times and improved patient outcomes. High-stakes clinical environments enable premium pricing for AI solutions that demonstrate measurable improvements in emergency care delivery and patient survival rates.

Competitive Advantages: Acute care systems differentiate through rapid deployment capabilities, proven clinical effectiveness, and integration with existing emergency medical systems that enhance care coordination while maintaining compliance with critical care protocols suitable for diverse hospital environments.

Key market characteristics
  • Advanced AI algorithms with real-time monitoring and predictive analytics for emergency situations
  • Integration systems enabling seamless communication across emergency departments, ICUs, and specialist units
  • Clinical decision support tools with evidence-based recommendations and automated alert systems

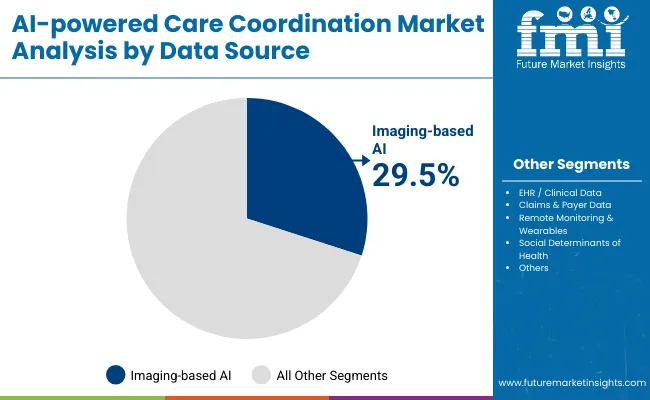
By Data Source, the Imaging-based AI Segment Accounts for the 29.5% Market Share

Ai Powered Care Coordination Market By Data Source

Market Context: Imaging-based AI dominates the AI-powered Care Coordination market due to widespread adoption of medical imaging technologies and increasing demand for automated image analysis, radiological workflow optimization applications that maximize diagnostic accuracy while enabling rapid clinical decision-making across multiple medical specialties.

Appeal Factors: Healthcare providers prioritise imaging AI solutions that provide immediate diagnostic insights, automated anomaly detection, and integration with existing radiology workflows that enable coordinated care delivery. The segment benefits from substantial imaging equipment investments and modernization programs that emphasise diagnostic efficiency and accuracy for clinical coordination applications.

Growth Drivers: Medical imaging modernization programs incorporate AI-powered analysis as standard diagnostic enhancement alongside traditional imaging equipment. At the same time, radiologist workflow optimization initiatives increase demand for automated systems that support coordinated care delivery across medical specialties.

Market Challenges: Technology integration requirements and radiologist workflow adaptation may limit deployment speed in certain healthcare environments.

Data source dynamics include

  • Strong growth in diagnostic imaging AI requiring comprehensive care coordination integration
  • Increasing adoption in radiology departments and imaging centers for workflow optimization
  • Rising integration with clinical decision support systems for coordinated patient management

What are the Drivers, Restraints, and Key Trends of the AI-powered Care Coordination Market?

Growth Accelerators: Healthcare digitization drives primary adoption as AI-powered care coordination platforms provide comprehensive patient data integration and clinical workflow optimization that enable seamless care delivery across multiple providers and specialties, supporting improved patient outcomes and operational efficiency.

Value-based care transition accelerates market expansion as healthcare organizations seek integrated solutions that demonstrate measurable quality improvements while reducing costs through coordinated care management and preventive intervention capabilities. Clinical decision support enhancement increases demand for AI systems that provide real-time analytics, predictive insights, and evidence-based recommendations that improve clinician productivity and reduce medical errors across complex care scenarios.

Growth Inhibitors: Implementation complexity challenges vary across healthcare organizations regarding existing system integration, workflow adaptation, and staff training requirements that may limit deployment flexibility and extend adoption timelines in certain institutional environments. Data privacy and interoperability concerns persist regarding patient health information security, regulatory compliance, and cross-system data sharing that may increase implementation costs and restrict comprehensive care coordination capabilities. Technology adoption resistance among healthcare providers may slow market penetration where clinical workflow disruption and learning curve requirements create organizational barriers to AI platform implementation.

Market Evolution Patterns: Adoption accelerates in large healthcare systems where comprehensive care coordination justifies technology investments, with geographic expansion transitioning toward community healthcare adoption driven by interoperability improvements and cost-effective deployment models. Technology development focuses on enhanced AI algorithms, improved predictive capabilities, and integration with emerging healthcare technologies that optimize clinical outcomes and operational efficiency. The market could face disruption if healthcare regulatory changes significantly restrict AI clinical applications or if alternative care coordination technologies develop superior integration capabilities at competitive pricing levels.
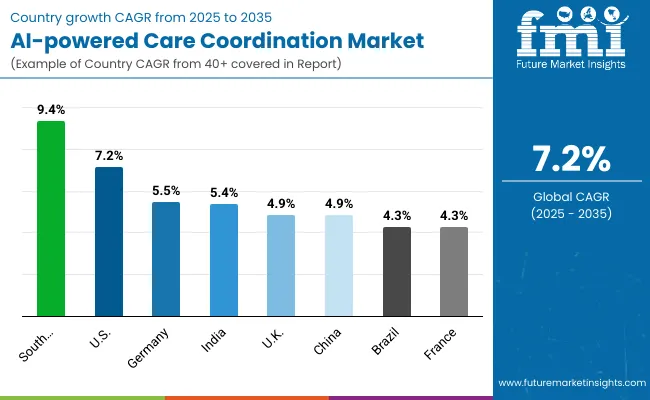
Analysis of the AI-powered Care Coordination Market by Key Country

Ai Powered Care Coordination Market By Country

Country CAGR (2025 to 2035)
South Korea 9.4%
USA 7.2%
Germany 5.5%
India 5.4%
UK 4.9%
China 4.9%
Brazil 4.3%
France 4.3%

The AI-powered Care Coordination market demonstrates varied regional dynamics with Growth Leaders including South Korea (9.4% CAGR) and USA (7.2% CAGR) driving expansion through healthcare digitization and advanced technology adoption. Steady Performers encompass Germany (5.5% CAGR), India (5.4% CAGR), and Europe overall (5.3% CAGR), benefiting from established healthcare infrastructure and regulatory support for AI technologies. Emerging Markets feature UK (4.9% CAGR), China (4.9% CAGR), and Brazil (4.3% CAGR), where healthcare modernization and technology integration support consistent growth patterns.

Regional synthesis reveals Asia-Pacific markets leading growth through healthcare modernization and technology adoption initiatives, while North American markets maintain strong expansion supported by advanced healthcare infrastructure and AI technology investment. European countries show steady performance driven by regulatory frameworks and comprehensive healthcare system integration trends.

South Korea Drives Global Market Leadership

South Korea establishes exceptional market leadership through comprehensive healthcare digitization programs and advanced AI technology integration, implementing sophisticated care coordination systems as standard components in hospital and clinic applications. The country's 9.4% CAGR through 2035 reflects government initiatives promoting healthcare technology adoption and domestic AI development capabilities that mandate integrated care coordination systems in medical institutions and healthcare facilities. Growth concentrates in major medical centres, including Seoul, Busan, and Daegu, where healthcare modernization showcases advanced AI coordination systems that appeal to providers seeking comprehensive patient management solutions and clinical efficiency applications.

Korean healthcare technology companies are developing innovative AI-powered care coordination solutions that combine traditional medical practices with advanced machine learning algorithms, including predictive analytics and automated workflow systems.

Strategic Market Indicators

  • Healthcare institutions leading adoption with 65% implementation rate in major hospitals and medical centers
  • Government healthcare digitization programs providing substantial funding for domestic AI technology development
  • Local technology companies capturing 60% market share through competitive innovation and regulatory adaptation
  • Clinical pathway integration driven by emergency care optimization and chronic disease management requirements
  • Export market development for advanced AI care coordination platforms targeting regional healthcare markets

United States Emerges as Technology Innovation Leader

In major medical centres across New York, California, and Texas, healthcare systems and medical institutions are implementing comprehensive AI-powered care coordination platforms as standard technology for clinical workflow optimization and patient outcome improvement applications, driven by increasing healthcare costs and quality improvement initiatives that emphasise coordinated care delivery capabilities.

The market is projected to demonstrate a 7.2% CAGR through 2035, supported by federal healthcare initiatives and institutional modernization programs that promote AI technology adoption for comprehensive care management. American healthcare providers are adopting AI coordination systems that provide superior clinical decision support and operational efficiency benefits, particularly appealing in complex medical environments where care coordination represents critical quality requirements.

Market expansion benefits from established healthcare technology infrastructure and strong institutional investment in AI solutions that enable widespread deployment across hospital systems and healthcare networks.

Market Intelligence Brief

  • Healthcare systems and medical institutions driving growth with 40% annual increase in AI platform implementations
  • Federal healthcare programs emphasising technology adoption for quality improvement and cost reduction
  • Healthcare technology partnerships with leading AI companies for platform development and integration
  • Clinical research institutions expanding AI coordination system validation and outcome measurement studies

Germany Maintains Healthcare Technology Excellence

Germany's advanced healthcare technology market demonstrates sophisticated AI-powered care coordination deployment with documented clinical effectiveness in hospital systems and medical practice applications through integration with existing healthcare management systems and clinical protocols. The country leverages healthcare engineering expertise and medical technology innovation to maintain a 5.5% CAGR through 2035. Medical centres, including Berlin, Munich, and Hamburg, showcase premium installations where AI coordination platforms integrate with comprehensive hospital information systems and clinical workflow management to optimise patient care delivery and operational effectiveness.

German healthcare institutions prioritise system reliability and clinical evidence in AI care coordination development, creating demand for premium platforms with advanced clinical validation, including outcome measurement capabilities and integration with evidence-based medicine protocols. The market benefits from established medical technology infrastructure and institutional willingness to invest in proven healthcare AI technologies that provide long-term clinical benefits and regulatory compliance.

Market Intelligence Brief

  • Clinical validation emphasising evidence-based outcomes and regulatory compliance, driving premium segment growth
  • Healthcare institution partnerships providing 35% faster technology deployment and clinical integration cycles
  • Technology collaboration between German medical device companies and international AI platform providers
  • Healthcare system integration programs expanding AI coordination platforms across institutional and ambulatory care settings

India Shows Strong Healthcare Modernization

India demonstrates robust market development with a 5.4% CAGR through 2035, supported by comprehensive healthcare modernization programs and government initiatives promoting digital health technology adoption across urban and rural healthcare delivery systems. The market benefits from increasing healthcare infrastructure investment and growing recognition of AI coordination benefits for addressing healthcare access challenges and clinical efficiency requirements in resource-constrained environments.

Market dynamics focus on cost-effective AI coordination solutions that balance advanced clinical capabilities with affordability considerations important to Indian healthcare providers. Growing medical tourism and private healthcare development creates sustained demand for modern care coordination systems in hospital infrastructure and specialty care applications.

Strategic Market Considerations

  • Healthcare modernization programs leading adoption with focus on efficiency improvement and care access expansion
  • Regional healthcare requirements driving diverse product portfolios from basic coordination to comprehensive AI platforms
  • Technology localization challenges offset by partnerships with international healthcare AI companies for market development
  • Government digital health initiatives beginning to influence procurement standards and technology adoption requirements

United Kingdom Demonstrates Clinical Integration Leadership

The UK market emphasises advanced AI-powered care coordination features, including comprehensive patient data integration and clinical pathway optimization that manage care delivery across National Health Service facilities and private healthcare providers through unified healthcare information systems. The country is projected to show a 4.9% CAGR through 2035, driven by NHS modernization programs and institutional demand for integrated care coordination systems that deliver measurable clinical outcomes. British healthcare providers prioritise operational effectiveness with AI coordination platforms delivering consistent care quality through advanced clinical algorithms and healthcare delivery optimization capabilities.

Technology deployment channels include major healthcare system suppliers, specialized medical technology companies, and NHS procurement programs that support professional implementation for complex healthcare applications.

Performance Metrics

  • NHS facilities and private healthcare systems leading AI coordination adoption for integrated care delivery
  • Healthcare technology supplier networks maintaining 70% market share for comprehensive institutional applications
  • NHS procurement programs supporting 30% of AI coordination platform acquisitions across hospital and primary care facilities
  • Healthcare system compatibility with major electronic health record platforms, driving procurement selection criteria

China Shows Healthcare Technology Integration

In Beijing, Shanghai, and other major medical centres, Chinese healthcare institutions and hospital systems are implementing advanced AI-powered care coordination systems to enhance clinical efficiency and support healthcare modernization that aligns with national health technology development goals and medical service quality improvement protocols.

The Chinese market demonstrates steady growth with a 4.9% CAGR through 2035, driven by healthcare infrastructure development programs and institutional investment in medical technology that emphasises comprehensive care coordination for hospital systems and medical practice applications. Chinese healthcare facilities are prioritising AI coordination platforms that provide reliable clinical support capabilities while maintaining compliance with national healthcare standards and operational efficiency requirements, particularly important in urban medical centres and specialty hospital operations.

Market expansion benefits from government healthcare technology procurement programs that mandate advanced coordination systems in public healthcare facility specifications, creating sustained demand across China's hospital and clinical care sectors, where operational efficiency and care quality represent critical institutional requirements.

Strategic Market Indicators
  • Hospital systems and medical institutions leading adoption with healthcare technology modernization programs requiring comprehensive AI coordination platforms
  • Government healthcare procurement providing regulatory support for advanced care coordination system acquisition
  • Healthcare technology compliance requirements driving demand for standardised platforms with clinical information system interoperability
  • Specialized medical centres adopting comprehensive AI coordination solutions for clinical research and advanced care applications

Europe Market Split by Country

Ai Powered Care Coordination Market Europe

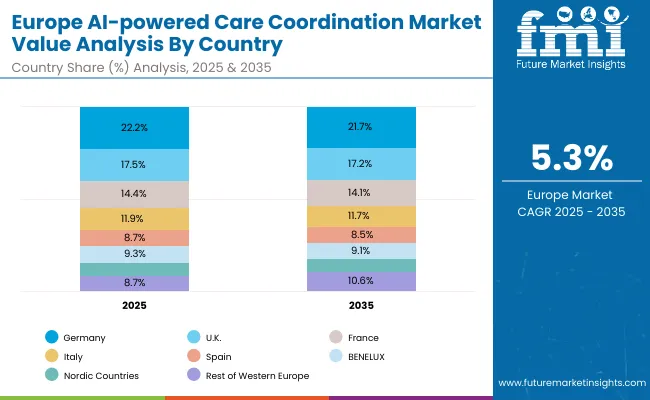
The AI-powered Care Coordination market in Europe is projected to grow from USD 182.3 million in 2025 to USD 305.0 million by 2035, registering a CAGR of 5.3% over the forecast period. Germany is expected to maintain its leadership position with a 22.2% market share in 2025, declining slightly to 21.7% by 2035, supported by its advanced healthcare technology infrastructure and major medical centres, including Berlin and Munich.

United Kingdom follows with a 17.5% share in 2025, projected to reach 17.2% by 2035, driven by NHS modernization programs and comprehensive healthcare system integration initiatives. France holds a 14.4% share in 2025, expected to maintain 14.1% by 2035 through specialized healthcare applications and medical technology development. Italy commands an 11.9% share, while Spain accounts for 8.7% in 2025. BENELUX region holds 9.3% share, Nordic Countries account for 7.2%, and the Rest of Western Europe region is anticipated to gain momentum, expanding its collective share from 8.7% to 10.6% by 2035.
Cloud-based SaaS Dominates AI Care Coordination System Demand in Japan

Ai Powered Care Coordination Market Japan

In Japan, the AI-powered Care Coordination market prioritises Cloud-based SaaS deployment models, which capture the dominant share of hospital and clinic installations through scalable infrastructure capabilities and seamless integration with existing healthcare management systems. Japanese healthcare providers emphasise system reliability, clinical effectiveness, and long-term operational support, creating demand for cloud-based platforms that provide comprehensive care coordination capabilities and adaptive clinical workflow control based on institutional requirements and patient management scenarios.

On-premise deployment systems maintain secondary market positions primarily in specialized healthcare applications and research institutions where data sovereignty meets operational requirements without compromising clinical functionality.

Market Characteristics
  • Premium focus on cloud-based systems with advanced clinical algorithms and scalable infrastructure capabilities
  • Integration requirements with existing hospital information systems and electronic health record platforms
  • Emphasis on system reliability and long-term clinical effectiveness for comprehensive healthcare applications

Imaging-based AI Leads Care Coordination System Applications in South Korea

Ai Powered Care Coordination Market South Korea

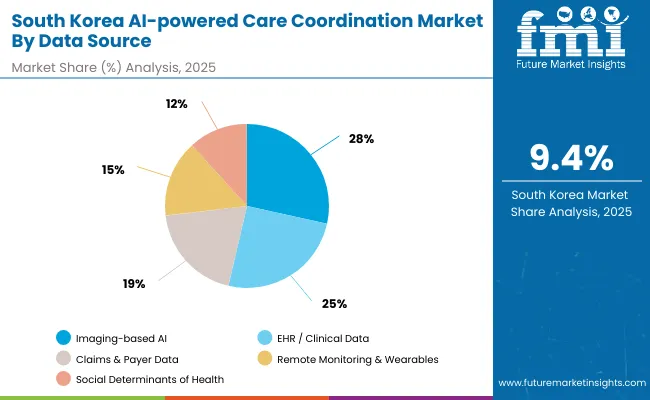
In South Korea, the market structure demonstrates strong preference for Imaging-based AI data sources, which maintain 28.5% market share through comprehensive diagnostic integration and advanced medical imaging analysis capabilities supporting coordinated care delivery across multiple clinical specialties. These systems offer integrated solutions combining sophisticated image analysis algorithms with clinical decision support platforms and real-time coordination capabilities that appeal to Korean healthcare providers seeking comprehensive diagnostic and care management solutions.

EHR/Clinical Data systems capture 25.2% market share by providing clinical information integration and workflow optimization. At the same time, Claims & Payer Data sources focus on utilization management and outcome measurement solutions tailored to Korean healthcare reimbursement characteristics.

Application Insights
  • Imaging-based AI systems maintaining premium market positioning through advanced diagnostic integration offerings
  • Clinical data integration platforms expanding to support growing demand for comprehensive care coordination and workflow optimization
  • Healthcare analytics capabilities becoming key differentiators for hospital and clinic care management applications

Competitive Landscape of the AI-powered Care Coordination Market

Ai Powered Care Coordination Market By Company

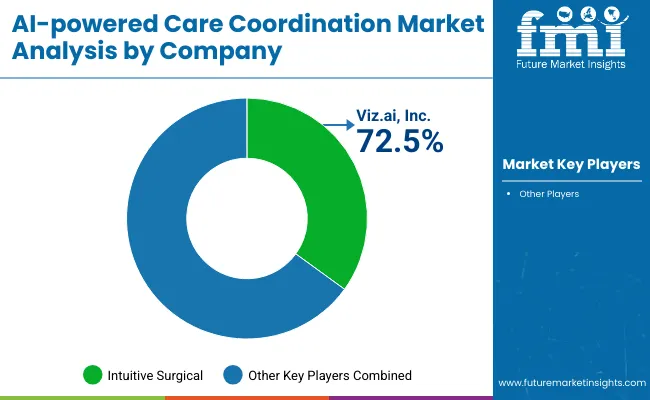
The AI-powered Care Coordination market operates with high concentration, featuring approximately 12-18 meaningful participants, where leading companies control roughly 60-70% of the global market share through established healthcare relationships and comprehensive AI technology portfolios. Competition emphasises clinical effectiveness, system integration capabilities, and regulatory compliance rather than price-based rivalry alone.

Market Leaders encompass Viz.ai Inc., Philips maintain competitive advantages through extensive healthcare technology expertise, global provider networks, and comprehensive AI development capabilities that create customer loyalty and support premium positioning. These companies leverage advanced machine learning technologies and ongoing clinical research investments to develop superior AI coordination platforms with enhanced predictive capabilities and clinical outcome improvements.

Technology Innovators include Epic Systems Corporation, Merative, and Siemens Healthineers, which compete through specialized AI algorithms and innovative healthcare integration solutions that appeal to providers seeking advanced clinical decision support and comprehensive care coordination capabilities. These companies differentiate through rapid AI development cycles and specialized healthcare application focus.

Market dynamics favour participants that combine proven clinical effectiveness with comprehensive healthcare system integration, including interoperability standards and regulatory compliance capabilities. Competitive pressure intensifies as traditional healthcare IT companies expand into AI solutions. At the same time, specialized AI companies challenge established players through novel machine learning approaches and enhanced clinical functionality targeting complex healthcare coordination scenarios.

Key Players in the AI-powered Care Coordination Market

  • Viz.ai, Inc.
  • Epic Systems Corporation
  • Allscripts Healthcare Solutions
  • Siemens Healthineers
  • Medtronic plc
  • Optum, Inc.
  • eClinicalWorks
  • Athenahealth, Inc.
  • CareCloud, Inc.
  • Health Catalyst
  • Lumeon

Scope of the Report

Item Value
Quantitative Units USD 651.1 Million
Clinical Pathway Acute & Emergency, Chronic Disease Management, Oncology Care Coordination, Behavioral Health & Mental Health, Preventive & Population Health
Data Source Imaging-based AI, EHR/Clinical Data, Claims & Payer Data, Remote Monitoring & Wearables, Social Determinants of Health
Deployment Model Cloud-based SaaS, On-premise, Hybrid Models
Regions Covered North America, Europe, Asia Pacific, Latin America, Middle East & Africa
Countries Covered USA, Germany, UK, Japan, South Korea, China, India, Brazil, France, and 25+ additional countries
Key Companies Profiled Viz.ai Inc., Epic Systems Corporation, Allscripts Healthcare Solutions
Additional Attributes Dollar sales by clinical pathway and deployment model categories, regional adoption trends across North America, Europe, and Asia-Pacific, competitive landscape with healthcare technology manufacturers and AI platform providers, provider preferences for clinical effectiveness and system integration capabilities, integration with electronic health records and healthcare management systems, innovations in machine learning algorithms and predictive analytics, and development of comprehensive care coordination solutions with enhanced clinical decision support and patient outcome optimization capabilities.

AI-powered Care Coordination Market by Segments

By Clinical Pathway:

  • Acute & Emergency
  • Chronic Disease Management
  • Oncology Care Coordination
  • Behavioral Health & Mental Health
  • Preventive & Population Health

By Data Source:

  • Imaging-based AI
  • EHR/Clinical Data
  • Claims & Payer Data
  • Remote Monitoring & Wearables
  • Social Determinants of Health

By Deployment Model:

  • Cloud-based SaaS
  • On-premise
  • Hybrid Models

By Region:

  • North America
  • United States
  • Canada
  • Mexico
  • Europe
  • Germany
  • United Kingdom
  • France
  • Italy
  • Spain
  • BENELUX
  • Nordic Countries
  • Rest of Western Europe
  • Asia Pacific
  • China
  • Japan
  • India
  • South Korea
  • ASEAN
  • Australia & New Zealand
  • Rest of Asia Pacific
  • Latin America
  • Brazil
  • Chile
  • Rest of Latin America
  • Middle East & Africa
  • Kingdom of Saudi Arabia
  • Other GCC Countries
  • Turkey
  • South Africa
  • Other African Union
  • Rest of Middle East & Africa

Table of Content

  1. Executive Summary
    • Global Market Outlook
    • Demand-side Trends
    • Supply-side Trends
    • Technology Roadmap Analysis
    • Analysis and Recommendations
  2. Market Overview
    • Market Coverage / Taxonomy
    • Market Definition / Scope / Limitations
  3. Market Background
    • Market Dynamics
      • Drivers
      • Restraints
      • Opportunity
      • Trends
    • Scenario Forecast
      • Demand in Optimistic Scenario
      • Demand in Likely Scenario
      • Demand in Conservative Scenario
    • Opportunity Map Analysis
    • Product Life Cycle Analysis
    • Supply Chain Analysis
      • Supply Side Participants and their Roles
        • Producers
        • Mid-Level Participants (Traders/ Agents/ Brokers)
        • Wholesalers and Distributors
      • Value Added and Value Created at Node in the Supply Chain
      • List of Raw Material Suppliers
      • List of Existing and Potential Buyer's
    • Investment Feasibility Matrix
    • Value Chain Analysis
      • Profit Margin Analysis
      • Wholesalers and Distributors
      • Retailers
    • PESTLE and Porter's Analysis
    • Regulatory Landscape
      • By Key Regions
      • By Key Countries
    • Regional Parent Market Outlook
    • Production and Consumption Statistics
    • Import and Export Statistics
  4. Global Market Analysis 2020 to 2024 and Forecast, 2025 to 2035
    • Historical Market Size Value (USD Million) & Volume (PMPM-priced members) Analysis, 2020 to 2024
    • Current and Future Market Size Value (USD Million) & Volume (PMPM-priced members) Projections, 2025 to 2035
      • Y-o-Y Growth Trend Analysis
      • Absolute $ Opportunity Analysis
  5. Global Market Pricing Analysis 2020 to 2024 and Forecast 2025 to 2035
  6. Global Market Analysis 2020 to 2024 and Forecast 2025 to 2035, By Clinical Pathway
    • Introduction / Key Findings
    • Historical Market Size Value (USD Million) & Volume (PMPM-priced members) Analysis By Clinical Pathway, 2020 to 2024
    • Current and Future Market Size Value (USD Million) & Volume (PMPM-priced members) Analysis and Forecast By Clinical Pathway, 2025 to 2035
      • Acute & Emergency
      • Chronic Disease Management
      • Oncology Care Coordination
      • Behavioral Health & Mental Health
      • Preventive & Population Health
    • Y-o-Y Growth Trend Analysis By Clinical Pathway, 2020 to 2024
    • Absolute $ Opportunity Analysis By Clinical Pathway, 2025 to 2035
  7. Global Market Analysis 2020 to 2024 and Forecast 2025 to 2035, By Data Source
    • Introduction / Key Findings
    • Historical Market Size Value (USD Million) & Volume (PMPM-priced members) Analysis By Data Source, 2020 to 2024
    • Current and Future Market Size Value (USD Million) & Volume (PMPM-priced members) Analysis and Forecast By Data Source, 2025 to 2035
      • Imaging-based AI
      • EHR / Clinical Data
      • Claims & Payer Data
      • Remote Monitoring & Wearables
      • Social Determinants of Health
    • Y-o-Y Growth Trend Analysis By Data Source, 2020 to 2024
    • Absolute $ Opportunity Analysis By Data Source, 2025 to 2035
  8. Global Market Analysis 2020 to 2024 and Forecast 2025 to 2035, By Deployment Model
    • Introduction / Key Findings
    • Historical Market Size Value (USD Million) & Volume (PMPM-priced members) Analysis By Deployment Model, 2020 to 2024
    • Current and Future Market Size Value (USD Million) & Volume (PMPM-priced members) Analysis and Forecast By Deployment Model, 2025 to 2035
      • Cloud-based SaaS
      • On-premise
      • Hybrid Models
    • Y-o-Y Growth Trend Analysis By Deployment Model, 2020 to 2024
    • Absolute $ Opportunity Analysis By Deployment Model, 2025 to 2035
  9. Global Market Analysis 2020 to 2024 and Forecast 2025 to 2035, By Region
    • Introduction
    • Historical Market Size Value (USD Million) & Volume (PMPM-priced members) Analysis By Region, 2020 to 2024
    • Current Market Size Value (USD Million) & Volume (PMPM-priced members) Analysis and Forecast By Region, 2025 to 2035
      • North America
      • Latin America
      • East Asia
      • South Asia & Pacific
      • Western Europe
      • Eastern Europe
      • Middle East & Africa
    • Market Attractiveness Analysis By Region
  10. North America Market Analysis 2020 to 2024 and Forecast 2025 to 2035, By Country
    • Historical Market Size Value (USD Million) & Volume (PMPM-priced members) Trend Analysis By Market Taxonomy, 2020 to 2024
    • Market Size Value (USD Million) & Volume (PMPM-priced members) Forecast By Market Taxonomy, 2025 to 2035
      • By Country
        • USA
        • Canada
        • Mexico
      • By Clinical Pathway
      • By Data Source
      • By Deployment Model
    • Market Attractiveness Analysis
      • By Country
      • By Clinical Pathway
      • By Data Source
      • By Deployment Model
    • Key Takeaways
  11. Latin America Market Analysis 2020 to 2024 and Forecast 2025 to 2035, By Country
    • Historical Market Size Value (USD Million) & Volume (PMPM-priced members) Trend Analysis By Market Taxonomy, 2020 to 2024
    • Market Size Value (USD Million) & Volume (PMPM-priced members) Forecast By Market Taxonomy, 2025 to 2035
      • By Country
        • Brazil
        • Argentina
        • Rest of Latin America
      • By Clinical Pathway
      • By Data Source
      • By Deployment Model
    • Market Attractiveness Analysis
      • By Country
      • By Clinical Pathway
      • By Data Source
      • By Deployment Model
    • Key Takeaways
  12. East Asia Market Analysis 2020 to 2024 and Forecast 2025 to 2035, By Country
    • Historical Market Size Value (USD Million) & Volume (PMPM-priced members) Trend Analysis By Market Taxonomy, 2020 to 2024
    • Market Size Value (USD Million) & Volume (PMPM-priced members) Forecast By Market Taxonomy, 2025 to 2035
      • By Country
        • China
        • Japan
        • South Korea
      • By Clinical Pathway
      • By Data Source
      • By Deployment Model
    • Market Attractiveness Analysis
      • By Country
      • By Clinical Pathway
      • By Data Source
      • By Deployment Model
    • Key Takeaways
  13. South Asia & Pacific Market Analysis 2020 to 2024 and Forecast 2025 to 2035, By Country
    • Historical Market Size Value (USD Million) & Volume (PMPM-priced members) Trend Analysis By Market Taxonomy, 2020 to 2024
    • Market Size Value (USD Million) & Volume (PMPM-priced members) Forecast By Market Taxonomy, 2025 to 2035
      • By Country
        • India
        • ASEAN Countries
        • Australia & New Zealand
        • Rest of South Asia
      • By Clinical Pathway
      • By Data Source
      • By Deployment Model
    • Market Attractiveness Analysis
      • By Country
      • By Clinical Pathway
      • By Data Source
      • By Deployment Model
    • Key Takeaways
  14. Western Europe Market Analysis 2020 to 2024 and Forecast 2025 to 2035, By Country
    • Historical Market Size Value (USD Million) & Volume (PMPM-priced members) Trend Analysis By Market Taxonomy, 2020 to 2024
    • Market Size Value (USD Million) & Volume (PMPM-priced members) Forecast By Market Taxonomy, 2025 to 2035
      • By Country
        • Germany
        • UK
        • France
        • Italy
        • Spain
        • BENELUX
        • Nordic Countries
        • Rest of Western Europe
      • By Clinical Pathway
      • By Data Source
      • By Deployment Model
    • Market Attractiveness Analysis
      • By Country
      • By Clinical Pathway
      • By Data Source
      • By Deployment Model
    • Key Takeaways
  15. Eastern Europe Market Analysis 2020 to 2024 and Forecast 2025 to 2035, By Country
    • Historical Market Size Value (USD Million) & Volume (PMPM-priced members) Trend Analysis By Market Taxonomy, 2020 to 2024
    • Market Size Value (USD Million) & Volume (PMPM-priced members) Forecast By Market Taxonomy, 2025 to 2035
      • By Country
        • Russia
        • Hungary
        • Poland
        • Rest of Eastern Europe
      • By Clinical Pathway
      • By Data Source
      • By Deployment Model
    • Market Attractiveness Analysis
      • By Country
      • By Clinical Pathway
      • By Data Source
      • By Deployment Model
    • Key Takeaways
  16. Middle East & Africa Market Analysis 2020 to 2024 and Forecast 2025 to 2035, By Country
    • Historical Market Size Value (USD Million) & Volume (PMPM-priced members) Trend Analysis By Market Taxonomy, 2020 to 2024
    • Market Size Value (USD Million) & Volume (PMPM-priced members) Forecast By Market Taxonomy, 2025 to 2035
      • By Country
        • Saudi Arabia
        • Türkiye
        • South Africa
        • Other African Union
        • Rest of Middle East & Africa
      • By Clinical Pathway
      • By Data Source
      • By Deployment Model
    • Market Attractiveness Analysis
      • By Country
      • By Clinical Pathway
      • By Data Source
      • By Deployment Model
    • Key Takeaways
  17. Key Countries Market Analysis
    • USA
      • Pricing Analysis
      • Market Share Analysis, 2024
        • By Clinical Pathway
        • By Data Source
        • By Deployment Model
    • Brazil
      • Pricing Analysis
      • Market Share Analysis, 2024
        • By Clinical Pathway
        • By Data Source
        • By Deployment Model
    • China
      • Pricing Analysis
      • Market Share Analysis, 2024
        • By Clinical Pathway
        • By Data Source
        • By Deployment Model
    • India
      • Pricing Analysis
      • Market Share Analysis, 2024
        • By Clinical Pathway
        • By Data Source
        • By Deployment Model
    • Japan
      • Pricing Analysis
      • Market Share Analysis, 2024
        • By Clinical Pathway
        • By Data Source
        • By Deployment Model
    • Germany
      • Pricing Analysis
      • Market Share Analysis, 2024
        • By Clinical Pathway
        • By Data Source
        • By Deployment Model
    • France
      • Pricing Analysis
      • Market Share Analysis, 2024
        • By Clinical Pathway
        • By Data Source
        • By Deployment Model
    • UK
      • Pricing Analysis
      • Market Share Analysis, 2024
        • By Clinical Pathway
        • By Data Source
        • By Deployment Model
  18. Market Structure Analysis
    • Competition Dashboard
    • Competition Benchmarking
    • Market Share Analysis of Top Players
      • By Regional
      • By Clinical Pathway
      • By Data Source
      • By Deployment Model
  19. Competition Analysis
    • Competition Deep Dive
      • Viz.ai, Inc.
        • Overview
        • Product Portfolio
        • Profitability by Market Segments (Product/Age/Sales Channel/Region)
        • Sales Footprint
        • Strategy Overview
          • Marketing Strategy
          • Product Strategy
          • Channel Strategy
      • Philips
        • Overview
        • Product Portfolio
        • Profitability by Market Segments (Product/Age/Sales Channel/Region)
        • Sales Footprint
        • Strategy Overview
          • Marketing Strategy
          • Product Strategy
          • Channel Strategy
      • Epic Systems Corporation
        • Overview
        • Product Portfolio
        • Profitability by Market Segments (Product/Age/Sales Channel/Region)
        • Sales Footprint
        • Strategy Overview
          • Marketing Strategy
          • Product Strategy
          • Channel Strategy
      • Allscripts Healthcare Solutions
        • Overview
        • Product Portfolio
        • Profitability by Market Segments (Product/Age/Sales Channel/Region)
        • Sales Footprint
        • Strategy Overview
          • Marketing Strategy
          • Product Strategy
          • Channel Strategy
      • Siemens Healthineers
        • Overview
        • Product Portfolio
        • Profitability by Market Segments (Product/Age/Sales Channel/Region)
        • Sales Footprint
        • Strategy Overview
          • Marketing Strategy
          • Product Strategy
          • Channel Strategy
      • Medtronic plc
        • Overview
        • Product Portfolio
        • Profitability by Market Segments (Product/Age/Sales Channel/Region)
        • Sales Footprint
        • Strategy Overview
          • Marketing Strategy
          • Product Strategy
          • Channel Strategy
      • Optum, Inc.
        • Overview
        • Product Portfolio
        • Profitability by Market Segments (Product/Age/Sales Channel/Region)
        • Sales Footprint
        • Strategy Overview
          • Marketing Strategy
          • Product Strategy
          • Channel Strategy
      • eClinicalWorks
        • Overview
        • Product Portfolio
        • Profitability by Market Segments (Product/Age/Sales Channel/Region)
        • Sales Footprint
        • Strategy Overview
          • Marketing Strategy
          • Product Strategy
          • Channel Strategy
      • Athenahealth, Inc.
        • Overview
        • Product Portfolio
        • Profitability by Market Segments (Product/Age/Sales Channel/Region)
        • Sales Footprint
        • Strategy Overview
          • Marketing Strategy
          • Product Strategy
          • Channel Strategy
      • CareCloud, Inc.
        • Overview
        • Product Portfolio
        • Profitability by Market Segments (Product/Age/Sales Channel/Region)
        • Sales Footprint
        • Strategy Overview
          • Marketing Strategy
          • Product Strategy
          • Channel Strategy
      • Health Catalyst
        • Overview
        • Product Portfolio
        • Profitability by Market Segments (Product/Age/Sales Channel/Region)
        • Sales Footprint
        • Strategy Overview
          • Marketing Strategy
          • Product Strategy
          • Channel Strategy
      • Lumeon
        • Overview
        • Product Portfolio
        • Profitability by Market Segments (Product/Age/Sales Channel/Region)
        • Sales Footprint
        • Strategy Overview
          • Marketing Strategy
          • Product Strategy
          • Channel Strategy
  20. Assumptions & Acronyms Used
  21. Research Methodology

List of Tables

  • Table 1: Global Market Value (USD Million) Forecast by Region, 2020-2035
  • Table 2: Global Market Volume (PMPM-priced members) Forecast by Region, 2020-2035
  • Table 3: Global Market Value (USD Million) Forecast by Clinical Pathway, 2020-2035
  • Table 4: Global Market Volume (PMPM-priced members) Forecast by Clinical Pathway, 2020-2035
  • Table 5: Global Market Value (USD Million) Forecast by Data Source, 2020-2035
  • Table 6: Global Market Volume (PMPM-priced members) Forecast by Data Source, 2020-2035
  • Table 7: Global Market Value (USD Million) Forecast by Deployment Model, 2020-2035
  • Table 8: Global Market Volume (PMPM-priced members) Forecast by Deployment Model, 2020-2035
  • Table 9: North America Market Value (USD Million) Forecast by Country, 2020-2035
  • Table 10: North America Market Volume (PMPM-priced members) Forecast by Country, 2020-2035
  • Table 11: North America Market Value (USD Million) Forecast by Clinical Pathway, 2020-2035
  • Table 12: North America Market Volume (PMPM-priced members) Forecast by Clinical Pathway, 2020-2035
  • Table 13: North America Market Value (USD Million) Forecast by Data Source, 2020-2035
  • Table 14: North America Market Volume (PMPM-priced members) Forecast by Data Source, 2020-2035
  • Table 15: North America Market Value (USD Million) Forecast by Deployment Model, 2020-2035
  • Table 16: North America Market Volume (PMPM-priced members) Forecast by Deployment Model, 2020-2035
  • Table 17: Latin America Market Value (USD Million) Forecast by Country, 2020-2035
  • Table 18: Latin America Market Volume (PMPM-priced members) Forecast by Country, 2020-2035
  • Table 19: Latin America Market Value (USD Million) Forecast by Clinical Pathway, 2020-2035
  • Table 20: Latin America Market Volume (PMPM-priced members) Forecast by Clinical Pathway, 2020-2035
  • Table 21: Latin America Market Value (USD Million) Forecast by Data Source, 2020-2035
  • Table 22: Latin America Market Volume (PMPM-priced members) Forecast by Data Source, 2020-2035
  • Table 23: Latin America Market Value (USD Million) Forecast by Deployment Model, 2020-2035
  • Table 24: Latin America Market Volume (PMPM-priced members) Forecast by Deployment Model, 2020-2035
  • Table 25: East Asia Market Value (USD Million) Forecast by Country, 2020-2035
  • Table 26: East Asia Market Volume (PMPM-priced members) Forecast by Country, 2020-2035
  • Table 27: East Asia Market Value (USD Million) Forecast by Clinical Pathway, 2020-2035
  • Table 28: East Asia Market Volume (PMPM-priced members) Forecast by Clinical Pathway, 2020-2035
  • Table 29: East Asia Market Value (USD Million) Forecast by Data Source, 2020-2035
  • Table 30: East Asia Market Volume (PMPM-priced members) Forecast by Data Source, 2020-2035
  • Table 31: East Asia Market Value (USD Million) Forecast by Deployment Model, 2020-2035
  • Table 32: East Asia Market Volume (PMPM-priced members) Forecast by Deployment Model, 2020-2035
  • Table 33: South Asia & Pacific Market Value (USD Million) Forecast by Country, 2020-2035
  • Table 34: South Asia & Pacific Market Volume (PMPM-priced members) Forecast by Country, 2020-2035
  • Table 35: South Asia & Pacific Market Value (USD Million) Forecast by Clinical Pathway, 2020-2035
  • Table 36: South Asia & Pacific Market Volume (PMPM-priced members) Forecast by Clinical Pathway, 2020-2035
  • Table 37: South Asia & Pacific Market Value (USD Million) Forecast by Data Source, 2020-2035
  • Table 38: South Asia & Pacific Market Volume (PMPM-priced members) Forecast by Data Source, 2020-2035
  • Table 39: South Asia & Pacific Market Value (USD Million) Forecast by Deployment Model, 2020-2035
  • Table 40: South Asia & Pacific Market Volume (PMPM-priced members) Forecast by Deployment Model, 2020-2035
  • Table 41: Western Europe Market Value (USD Million) Forecast by Country, 2020-2035
  • Table 42: Western Europe Market Volume (PMPM-priced members) Forecast by Country, 2020-2035
  • Table 43: Western Europe Market Value (USD Million) Forecast by Clinical Pathway, 2020-2035
  • Table 44: Western Europe Market Volume (PMPM-priced members) Forecast by Clinical Pathway, 2020-2035
  • Table 45: Western Europe Market Value (USD Million) Forecast by Data Source, 2020-2035
  • Table 46: Western Europe Market Volume (PMPM-priced members) Forecast by Data Source, 2020-2035
  • Table 47: Western Europe Market Value (USD Million) Forecast by Deployment Model, 2020-2035
  • Table 48: Western Europe Market Volume (PMPM-priced members) Forecast by Deployment Model, 2020-2035
  • Table 49: Eastern Europe Market Value (USD Million) Forecast by Country, 2020-2035
  • Table 50: Eastern Europe Market Volume (PMPM-priced members) Forecast by Country, 2020-2035
  • Table 51: Eastern Europe Market Value (USD Million) Forecast by Clinical Pathway, 2020-2035
  • Table 52: Eastern Europe Market Volume (PMPM-priced members) Forecast by Clinical Pathway, 2020-2035
  • Table 53: Eastern Europe Market Value (USD Million) Forecast by Data Source, 2020-2035
  • Table 54: Eastern Europe Market Volume (PMPM-priced members) Forecast by Data Source, 2020-2035
  • Table 55: Eastern Europe Market Value (USD Million) Forecast by Deployment Model, 2020-2035
  • Table 56: Eastern Europe Market Volume (PMPM-priced members) Forecast by Deployment Model, 2020-2035
  • Table 57: Middle East & Africa Market Value (USD Million) Forecast by Country, 2020-2035
  • Table 58: Middle East & Africa Market Volume (PMPM-priced members) Forecast by Country, 2020-2035
  • Table 59: Middle East & Africa Market Value (USD Million) Forecast by Clinical Pathway, 2020-2035
  • Table 60: Middle East & Africa Market Volume (PMPM-priced members) Forecast by Clinical Pathway, 2020-2035
  • Table 61: Middle East & Africa Market Value (USD Million) Forecast by Data Source, 2020-2035
  • Table 62: Middle East & Africa Market Volume (PMPM-priced members) Forecast by Data Source, 2020-2035
  • Table 63: Middle East & Africa Market Value (USD Million) Forecast by Deployment Model, 2020-2035
  • Table 64: Middle East & Africa Market Volume (PMPM-priced members) Forecast by Deployment Model, 2020-2035
  • Table 65: USA Market Value (USD Million) Forecast by Clinical Pathway, 2020-2035
  • Table 66: USA Market Volume (PMPM-priced members) Forecast by Clinical Pathway, 2020-2035
  • Table 67: USA Market Value (USD Million) Forecast by Data Source, 2020-2035
  • Table 68: USA Market Volume (PMPM-priced members) Forecast by Data Source, 2020-2035
  • Table 69: USA Market Value (USD Million) Forecast by Deployment Model, 2020-2035
  • Table 70: USA Market Volume (PMPM-priced members) Forecast by Deployment Model, 2020-2035
  • Table 71: Canada Market Value (USD Million) Forecast by Clinical Pathway, 2020-2035
  • Table 72: Canada Market Volume (PMPM-priced members) Forecast by Clinical Pathway, 2020-2035
  • Table 73: Canada Market Value (USD Million) Forecast by Data Source, 2020-2035
  • Table 74: Canada Market Volume (PMPM-priced members) Forecast by Data Source, 2020-2035
  • Table 75: Canada Market Value (USD Million) Forecast by Deployment Model, 2020-2035
  • Table 76: Canada Market Volume (PMPM-priced members) Forecast by Deployment Model, 2020-2035
  • Table 77: Mexico Market Value (USD Million) Forecast by Clinical Pathway, 2020-2035
  • Table 78: Mexico Market Volume (PMPM-priced members) Forecast by Clinical Pathway, 2020-2035
  • Table 79: Mexico Market Value (USD Million) Forecast by Data Source, 2020-2035
  • Table 80: Mexico Market Volume (PMPM-priced members) Forecast by Data Source, 2020-2035
  • Table 81: Mexico Market Value (USD Million) Forecast by Deployment Model, 2020-2035
  • Table 82: Mexico Market Volume (PMPM-priced members) Forecast by Deployment Model, 2020-2035
  • Table 83: Brazil Market Value (USD Million) Forecast by Clinical Pathway, 2020-2035
  • Table 84: Brazil Market Volume (PMPM-priced members) Forecast by Clinical Pathway, 2020-2035
  • Table 85: Brazil Market Value (USD Million) Forecast by Data Source, 2020-2035
  • Table 86: Brazil Market Volume (PMPM-priced members) Forecast by Data Source, 2020-2035
  • Table 87: Brazil Market Value (USD Million) Forecast by Deployment Model, 2020-2035
  • Table 88: Brazil Market Volume (PMPM-priced members) Forecast by Deployment Model, 2020-2035
  • Table 89: Argentina Market Value (USD Million) Forecast by Clinical Pathway, 2020-2035
  • Table 90: Argentina Market Volume (PMPM-priced members) Forecast by Clinical Pathway, 2020-2035
  • Table 91: Argentina Market Value (USD Million) Forecast by Data Source, 2020-2035
  • Table 92: Argentina Market Volume (PMPM-priced members) Forecast by Data Source, 2020-2035
  • Table 93: Argentina Market Value (USD Million) Forecast by Deployment Model, 2020-2035
  • Table 94: Argentina Market Volume (PMPM-priced members) Forecast by Deployment Model, 2020-2035
  • Table 95: China Market Value (USD Million) Forecast by Clinical Pathway, 2020-2035
  • Table 96: China Market Volume (PMPM-priced members) Forecast by Clinical Pathway, 2020-2035
  • Table 97: China Market Value (USD Million) Forecast by Data Source, 2020-2035
  • Table 98: China Market Volume (PMPM-priced members) Forecast by Data Source, 2020-2035
  • Table 99: China Market Value (USD Million) Forecast by Deployment Model, 2020-2035
  • Table 100: China Market Volume (PMPM-priced members) Forecast by Deployment Model, 2020-2035
  • Table 101: Japan Market Value (USD Million) Forecast by Clinical Pathway, 2020-2035
  • Table 102: Japan Market Volume (PMPM-priced members) Forecast by Clinical Pathway, 2020-2035
  • Table 103: Japan Market Value (USD Million) Forecast by Data Source, 2020-2035
  • Table 104: Japan Market Volume (PMPM-priced members) Forecast by Data Source, 2020-2035
  • Table 105: Japan Market Value (USD Million) Forecast by Deployment Model, 2020-2035
  • Table 106: Japan Market Volume (PMPM-priced members) Forecast by Deployment Model, 2020-2035
  • Table 107: South Korea Market Value (USD Million) Forecast by Clinical Pathway, 2020-2035
  • Table 108: South Korea Market Volume (PMPM-priced members) Forecast by Clinical Pathway, 2020-2035
  • Table 109: South Korea Market Value (USD Million) Forecast by Data Source, 2020-2035
  • Table 110: South Korea Market Volume (PMPM-priced members) Forecast by Data Source, 2020-2035
  • Table 111: South Korea Market Value (USD Million) Forecast by Deployment Model, 2020-2035
  • Table 112: South Korea Market Volume (PMPM-priced members) Forecast by Deployment Model, 2020-2035
  • Table 113: India Market Value (USD Million) Forecast by Clinical Pathway, 2020-2035
  • Table 114: India Market Volume (PMPM-priced members) Forecast by Clinical Pathway, 2020-2035
  • Table 115: India Market Value (USD Million) Forecast by Data Source, 2020-2035
  • Table 116: India Market Volume (PMPM-priced members) Forecast by Data Source, 2020-2035
  • Table 117: India Market Value (USD Million) Forecast by Deployment Model, 2020-2035
  • Table 118: India Market Volume (PMPM-priced members) Forecast by Deployment Model, 2020-2035
  • Table 119: ASEAN Countries Market Value (USD Million) Forecast by Clinical Pathway, 2020-2035
  • Table 120: ASEAN Countries Market Volume (PMPM-priced members) Forecast by Clinical Pathway, 2020-2035
  • Table 121: ASEAN Countries Market Value (USD Million) Forecast by Data Source, 2020-2035
  • Table 122: ASEAN Countries Market Volume (PMPM-priced members) Forecast by Data Source, 2020-2035
  • Table 123: ASEAN Countries Market Value (USD Million) Forecast by Deployment Model, 2020-2035
  • Table 124: ASEAN Countries Market Volume (PMPM-priced members) Forecast by Deployment Model, 2020-2035
  • Table 125: Australia & New Zealand Market Value (USD Million) Forecast by Clinical Pathway, 2020-2035
  • Table 126: Australia & New Zealand Market Volume (PMPM-priced members) Forecast by Clinical Pathway, 2020-2035
  • Table 127: Australia & New Zealand Market Value (USD Million) Forecast by Data Source, 2020-2035
  • Table 128: Australia & New Zealand Market Volume (PMPM-priced members) Forecast by Data Source, 2020-2035
  • Table 129: Australia & New Zealand Market Value (USD Million) Forecast by Deployment Model, 2020-2035
  • Table 130: Australia & New Zealand Market Volume (PMPM-priced members) Forecast by Deployment Model, 2020-2035
  • Table 131: Germany Market Value (USD Million) Forecast by Clinical Pathway, 2020-2035
  • Table 132: Germany Market Volume (PMPM-priced members) Forecast by Clinical Pathway, 2020-2035
  • Table 133: Germany Market Value (USD Million) Forecast by Data Source, 2020-2035
  • Table 134: Germany Market Volume (PMPM-priced members) Forecast by Data Source, 2020-2035
  • Table 135: Germany Market Value (USD Million) Forecast by Deployment Model, 2020-2035
  • Table 136: Germany Market Volume (PMPM-priced members) Forecast by Deployment Model, 2020-2035
  • Table 137: UK Market Value (USD Million) Forecast by Clinical Pathway, 2020-2035
  • Table 138: UK Market Volume (PMPM-priced members) Forecast by Clinical Pathway, 2020-2035
  • Table 139: UK Market Value (USD Million) Forecast by Data Source, 2020-2035
  • Table 140: UK Market Volume (PMPM-priced members) Forecast by Data Source, 2020-2035
  • Table 141: UK Market Value (USD Million) Forecast by Deployment Model, 2020-2035
  • Table 142: UK Market Volume (PMPM-priced members) Forecast by Deployment Model, 2020-2035
  • Table 143: France Market Value (USD Million) Forecast by Clinical Pathway, 2020-2035
  • Table 144: France Market Volume (PMPM-priced members) Forecast by Clinical Pathway, 2020-2035
  • Table 145: France Market Value (USD Million) Forecast by Data Source, 2020-2035
  • Table 146: France Market Volume (PMPM-priced members) Forecast by Data Source, 2020-2035
  • Table 147: France Market Value (USD Million) Forecast by Deployment Model, 2020-2035
  • Table 148: France Market Volume (PMPM-priced members) Forecast by Deployment Model, 2020-2035
  • Table 149: Italy Market Value (USD Million) Forecast by Clinical Pathway, 2020-2035
  • Table 150: Italy Market Volume (PMPM-priced members) Forecast by Clinical Pathway, 2020-2035
  • Table 151: Italy Market Value (USD Million) Forecast by Data Source, 2020-2035
  • Table 152: Italy Market Volume (PMPM-priced members) Forecast by Data Source, 2020-2035
  • Table 153: Italy Market Value (USD Million) Forecast by Deployment Model, 2020-2035
  • Table 154: Italy Market Volume (PMPM-priced members) Forecast by Deployment Model, 2020-2035

List of Figures

  • Figure 1: Global Market Value (USD Million) by Clinical Pathway, 2025-2035
  • Figure 2: Global Market Value (USD Million) by Data Source, 2025-2035
  • Figure 3: Global Market Value (USD Million) by Deployment Model, 2025-2035
  • Figure 4: Global Market Value (USD Million) by Region, 2025-2035
  • Figure 5: Global Market Value (USD Million) Analysis by Region, 2020-2035
  • Figure 6: Global Market Volume (PMPM-priced members) Analysis by Region, 2020-2035
  • Figure 7: Global Market Value Share (%) and BPS Analysis by Region, 2025-2035
  • Figure 8: Global Market Y-o-Y Growth (%) Projections by Region, 2025-2035
  • Figure 9: Global Market Value (USD Million) Analysis by Clinical Pathway, 2020-2035
  • Figure 10: Global Market Volume (PMPM-priced members) Analysis by Clinical Pathway, 2020-2035
  • Figure 11: Global Market Value Share (%) and BPS Analysis by Clinical Pathway, 2025-2035
  • Figure 12: Global Market Y-o-Y Growth (%) Projections by Clinical Pathway, 2025-2035
  • Figure 13: Global Market Value (USD Million) Analysis by Data Source, 2020-2035
  • Figure 14: Global Market Volume (PMPM-priced members) Analysis by Data Source, 2020-2035
  • Figure 15: Global Market Value Share (%) and BPS Analysis by Data Source, 2025-2035
  • Figure 16: Global Market Y-o-Y Growth (%) Projections by Data Source, 2025-2035
  • Figure 17: Global Market Value (USD Million) Analysis by Deployment Model, 2020-2035
  • Figure 18: Global Market Volume (PMPM-priced members) Analysis by Deployment Model, 2020-2035
  • Figure 19: Global Market Value Share (%) and BPS Analysis by Deployment Model, 2025-2035
  • Figure 20: Global Market Y-o-Y Growth (%) Projections by Deployment Model, 2025-2035
  • Figure 21: Global Market Attractiveness by Clinical Pathway, 2025-2035
  • Figure 22: Global Market Attractiveness by Data Source, 2025-2035
  • Figure 23: Global Market Attractiveness by Deployment Model, 2025-2035
  • Figure 24: Global Market Attractiveness by Region, 2025-2035
  • Figure 25: North America Market Value (USD Million) by Clinical Pathway, 2025-2035
  • Figure 26: North America Market Value (USD Million) by Data Source, 2025-2035
  • Figure 27: North America Market Value (USD Million) by Deployment Model, 2025-2035
  • Figure 28: North America Market Value (USD Million) by Country, 2025-2035
  • Figure 29: North America Market Value (USD Million) Analysis by Country, 2020-2035
  • Figure 30: North America Market Volume (PMPM-priced members) Analysis by Country, 2020-2035
  • Figure 31: North America Market Value Share (%) and BPS Analysis by Country, 2025-2035
  • Figure 32: North America Market Y-o-Y Growth (%) Projections by Country, 2025-2035
  • Figure 33: North America Market Value (USD Million) Analysis by Clinical Pathway, 2020-2035
  • Figure 34: North America Market Volume (PMPM-priced members) Analysis by Clinical Pathway, 2020-2035
  • Figure 35: North America Market Value Share (%) and BPS Analysis by Clinical Pathway, 2025-2035
  • Figure 36: North America Market Y-o-Y Growth (%) Projections by Clinical Pathway, 2025-2035
  • Figure 37: North America Market Value (USD Million) Analysis by Data Source, 2020-2035
  • Figure 38: North America Market Volume (PMPM-priced members) Analysis by Data Source, 2020-2035
  • Figure 39: North America Market Value Share (%) and BPS Analysis by Data Source, 2025-2035
  • Figure 40: North America Market Y-o-Y Growth (%) Projections by Data Source, 2025-2035
  • Figure 41: North America Market Value (USD Million) Analysis by Deployment Model, 2020-2035
  • Figure 42: North America Market Volume (PMPM-priced members) Analysis by Deployment Model, 2020-2035
  • Figure 43: North America Market Value Share (%) and BPS Analysis by Deployment Model, 2025-2035
  • Figure 44: North America Market Y-o-Y Growth (%) Projections by Deployment Model, 2025-2035
  • Figure 45: North America Market Attractiveness by Clinical Pathway, 2025-2035
  • Figure 46: North America Market Attractiveness by Data Source, 2025-2035
  • Figure 47: North America Market Attractiveness by Deployment Model, 2025-2035
  • Figure 48: North America Market Attractiveness by Country, 2025-2035
  • Figure 49: Latin America Market Value (USD Million) by Clinical Pathway, 2025-2035
  • Figure 50: Latin America Market Value (USD Million) by Data Source, 2025-2035
  • Figure 51: Latin America Market Value (USD Million) by Deployment Model, 2025-2035
  • Figure 52: Latin America Market Value (USD Million) by Country, 2025-2035
  • Figure 53: Latin America Market Value (USD Million) Analysis by Country, 2020-2035
  • Figure 54: Latin America Market Volume (PMPM-priced members) Analysis by Country, 2020-2035
  • Figure 55: Latin America Market Value Share (%) and BPS Analysis by Country, 2025-2035
  • Figure 56: Latin America Market Y-o-Y Growth (%) Projections by Country, 2025-2035
  • Figure 57: Latin America Market Value (USD Million) Analysis by Clinical Pathway, 2020-2035
  • Figure 58: Latin America Market Volume (PMPM-priced members) Analysis by Clinical Pathway, 2020-2035
  • Figure 59: Latin America Market Value Share (%) and BPS Analysis by Clinical Pathway, 2025-2035
  • Figure 60: Latin America Market Y-o-Y Growth (%) Projections by Clinical Pathway, 2025-2035
  • Figure 61: Latin America Market Value (USD Million) Analysis by Data Source, 2020-2035
  • Figure 62: Latin America Market Volume (PMPM-priced members) Analysis by Data Source, 2020-2035
  • Figure 63: Latin America Market Value Share (%) and BPS Analysis by Data Source, 2025-2035
  • Figure 64: Latin America Market Y-o-Y Growth (%) Projections by Data Source, 2025-2035
  • Figure 65: Latin America Market Value (USD Million) Analysis by Deployment Model, 2020-2035
  • Figure 66: Latin America Market Volume (PMPM-priced members) Analysis by Deployment Model, 2020-2035
  • Figure 67: Latin America Market Value Share (%) and BPS Analysis by Deployment Model, 2025-2035
  • Figure 68: Latin America Market Y-o-Y Growth (%) Projections by Deployment Model, 2025-2035
  • Figure 69: Latin America Market Attractiveness by Clinical Pathway, 2025-2035
  • Figure 70: Latin America Market Attractiveness by Data Source, 2025-2035
  • Figure 71: Latin America Market Attractiveness by Deployment Model, 2025-2035
  • Figure 72: Latin America Market Attractiveness by Country, 2025-2035
  • Figure 73: East Asia Market Value (USD Million) by Clinical Pathway, 2025-2035
  • Figure 74: East Asia Market Value (USD Million) by Data Source, 2025-2035
  • Figure 75: East Asia Market Value (USD Million) by Deployment Model, 2025-2035
  • Figure 76: East Asia Market Value (USD Million) by Country, 2025-2035
  • Figure 77: East Asia Market Value (USD Million) Analysis by Country, 2020-2035
  • Figure 78: East Asia Market Volume (PMPM-priced members) Analysis by Country, 2020-2035
  • Figure 79: East Asia Market Value Share (%) and BPS Analysis by Country, 2025-2035
  • Figure 80: East Asia Market Y-o-Y Growth (%) Projections by Country, 2025-2035
  • Figure 81: East Asia Market Value (USD Million) Analysis by Clinical Pathway, 2020-2035
  • Figure 82: East Asia Market Volume (PMPM-priced members) Analysis by Clinical Pathway, 2020-2035
  • Figure 83: East Asia Market Value Share (%) and BPS Analysis by Clinical Pathway, 2025-2035
  • Figure 84: East Asia Market Y-o-Y Growth (%) Projections by Clinical Pathway, 2025-2035
  • Figure 85: East Asia Market Value (USD Million) Analysis by Data Source, 2020-2035
  • Figure 86: East Asia Market Volume (PMPM-priced members) Analysis by Data Source, 2020-2035
  • Figure 87: East Asia Market Value Share (%) and BPS Analysis by Data Source, 2025-2035
  • Figure 88: East Asia Market Y-o-Y Growth (%) Projections by Data Source, 2025-2035
  • Figure 89: East Asia Market Value (USD Million) Analysis by Deployment Model, 2020-2035
  • Figure 90: East Asia Market Volume (PMPM-priced members) Analysis by Deployment Model, 2020-2035
  • Figure 91: East Asia Market Value Share (%) and BPS Analysis by Deployment Model, 2025-2035
  • Figure 92: East Asia Market Y-o-Y Growth (%) Projections by Deployment Model, 2025-2035
  • Figure 93: East Asia Market Attractiveness by Clinical Pathway, 2025-2035
  • Figure 94: East Asia Market Attractiveness by Data Source, 2025-2035
  • Figure 95: East Asia Market Attractiveness by Deployment Model, 2025-2035
  • Figure 96: East Asia Market Attractiveness by Country, 2025-2035
  • Figure 97: South Asia & Pacific Market Value (USD Million) by Clinical Pathway, 2025-2035
  • Figure 98: South Asia & Pacific Market Value (USD Million) by Data Source, 2025-2035
  • Figure 99: South Asia & Pacific Market Value (USD Million) by Deployment Model, 2025-2035
  • Figure 100: South Asia & Pacific Market Value (USD Million) by Country, 2025-2035
  • Figure 101: South Asia & Pacific Market Value (USD Million) Analysis by Country, 2020-2035
  • Figure 102: South Asia & Pacific Market Volume (PMPM-priced members) Analysis by Country, 2020-2035
  • Figure 103: South Asia & Pacific Market Value Share (%) and BPS Analysis by Country, 2025-2035
  • Figure 104: South Asia & Pacific Market Y-o-Y Growth (%) Projections by Country, 2025-2035
  • Figure 105: South Asia & Pacific Market Value (USD Million) Analysis by Clinical Pathway, 2020-2035
  • Figure 106: South Asia & Pacific Market Volume (PMPM-priced members) Analysis by Clinical Pathway, 2020-2035
  • Figure 107: South Asia & Pacific Market Value Share (%) and BPS Analysis by Clinical Pathway, 2025-2035
  • Figure 108: South Asia & Pacific Market Y-o-Y Growth (%) Projections by Clinical Pathway, 2025-2035
  • Figure 109: South Asia & Pacific Market Value (USD Million) Analysis by Data Source, 2020-2035
  • Figure 110: South Asia & Pacific Market Volume (PMPM-priced members) Analysis by Data Source, 2020-2035
  • Figure 111: South Asia & Pacific Market Value Share (%) and BPS Analysis by Data Source, 2025-2035
  • Figure 112: South Asia & Pacific Market Y-o-Y Growth (%) Projections by Data Source, 2025-2035
  • Figure 113: South Asia & Pacific Market Value (USD Million) Analysis by Deployment Model, 2020-2035
  • Figure 114: South Asia & Pacific Market Volume (PMPM-priced members) Analysis by Deployment Model, 2020-2035
  • Figure 115: South Asia & Pacific Market Value Share (%) and BPS Analysis by Deployment Model, 2025-2035
  • Figure 116: South Asia & Pacific Market Y-o-Y Growth (%) Projections by Deployment Model, 2025-2035
  • Figure 117: South Asia & Pacific Market Attractiveness by Clinical Pathway, 2025-2035
  • Figure 118: South Asia & Pacific Market Attractiveness by Data Source, 2025-2035
  • Figure 119: South Asia & Pacific Market Attractiveness by Deployment Model, 2025-2035
  • Figure 120: South Asia & Pacific Market Attractiveness by Country, 2025-2035
  • Figure 121: Western Europe Market Value (USD Million) by Clinical Pathway, 2025-2035
  • Figure 122: Western Europe Market Value (USD Million) by Data Source, 2025-2035
  • Figure 123: Western Europe Market Value (USD Million) by Deployment Model, 2025-2035
  • Figure 124: Western Europe Market Value (USD Million) by Country, 2025-2035
  • Figure 125: Western Europe Market Value (USD Million) Analysis by Country, 2020-2035
  • Figure 126: Western Europe Market Volume (PMPM-priced members) Analysis by Country, 2020-2035
  • Figure 127: Western Europe Market Value Share (%) and BPS Analysis by Country, 2025-2035
  • Figure 128: Western Europe Market Y-o-Y Growth (%) Projections by Country, 2025-2035
  • Figure 129: Western Europe Market Value (USD Million) Analysis by Clinical Pathway, 2020-2035
  • Figure 130: Western Europe Market Volume (PMPM-priced members) Analysis by Clinical Pathway, 2020-2035
  • Figure 131: Western Europe Market Value Share (%) and BPS Analysis by Clinical Pathway, 2025-2035
  • Figure 132: Western Europe Market Y-o-Y Growth (%) Projections by Clinical Pathway, 2025-2035
  • Figure 133: Western Europe Market Value (USD Million) Analysis by Data Source, 2020-2035
  • Figure 134: Western Europe Market Volume (PMPM-priced members) Analysis by Data Source, 2020-2035
  • Figure 135: Western Europe Market Value Share (%) and BPS Analysis by Data Source, 2025-2035
  • Figure 136: Western Europe Market Y-o-Y Growth (%) Projections by Data Source, 2025-2035
  • Figure 137: Western Europe Market Value (USD Million) Analysis by Deployment Model, 2020-2035
  • Figure 138: Western Europe Market Volume (PMPM-priced members) Analysis by Deployment Model, 2020-2035
  • Figure 139: Western Europe Market Value Share (%) and BPS Analysis by Deployment Model, 2025-2035
  • Figure 140: Western Europe Market Y-o-Y Growth (%) Projections by Deployment Model, 2025-2035
  • Figure 141: Western Europe Market Attractiveness by Clinical Pathway, 2025-2035
  • Figure 142: Western Europe Market Attractiveness by Data Source, 2025-2035
  • Figure 143: Western Europe Market Attractiveness by Deployment Model, 2025-2035
  • Figure 144: Western Europe Market Attractiveness by Country, 2025-2035
  • Figure 145: Eastern Europe Market Value (USD Million) by Clinical Pathway, 2025-2035
  • Figure 146: Eastern Europe Market Value (USD Million) by Data Source, 2025-2035
  • Figure 147: Eastern Europe Market Value (USD Million) by Deployment Model, 2025-2035
  • Figure 148: Eastern Europe Market Value (USD Million) by Country, 2025-2035
  • Figure 149: Eastern Europe Market Value (USD Million) Analysis by Country, 2020-2035
  • Figure 150: Eastern Europe Market Volume (PMPM-priced members) Analysis by Country, 2020-2035
  • Figure 151: Eastern Europe Market Value Share (%) and BPS Analysis by Country, 2025-2035
  • Figure 152: Eastern Europe Market Y-o-Y Growth (%) Projections by Country, 2025-2035
  • Figure 153: Eastern Europe Market Value (USD Million) Analysis by Clinical Pathway, 2020-2035
  • Figure 154: Eastern Europe Market Volume (PMPM-priced members) Analysis by Clinical Pathway, 2020-2035
  • Figure 155: Eastern Europe Market Value Share (%) and BPS Analysis by Clinical Pathway, 2025-2035
  • Figure 156: Eastern Europe Market Y-o-Y Growth (%) Projections by Clinical Pathway, 2025-2035
  • Figure 157: Eastern Europe Market Value (USD Million) Analysis by Data Source, 2020-2035
  • Figure 158: Eastern Europe Market Volume (PMPM-priced members) Analysis by Data Source, 2020-2035
  • Figure 159: Eastern Europe Market Value Share (%) and BPS Analysis by Data Source, 2025-2035
  • Figure 160: Eastern Europe Market Y-o-Y Growth (%) Projections by Data Source, 2025-2035
  • Figure 161: Eastern Europe Market Value (USD Million) Analysis by Deployment Model, 2020-2035
  • Figure 162: Eastern Europe Market Volume (PMPM-priced members) Analysis by Deployment Model, 2020-2035
  • Figure 163: Eastern Europe Market Value Share (%) and BPS Analysis by Deployment Model, 2025-2035
  • Figure 164: Eastern Europe Market Y-o-Y Growth (%) Projections by Deployment Model, 2025-2035
  • Figure 165: Eastern Europe Market Attractiveness by Clinical Pathway, 2025-2035
  • Figure 166: Eastern Europe Market Attractiveness by Data Source, 2025-2035
  • Figure 167: Eastern Europe Market Attractiveness by Deployment Model, 2025-2035
  • Figure 168: Eastern Europe Market Attractiveness by Country, 2025-2035
  • Figure 169: Middle East & Africa Market Value (USD Million) by Clinical Pathway, 2025-2035
  • Figure 170: Middle East & Africa Market Value (USD Million) by Data Source, 2025-2035
  • Figure 171: Middle East & Africa Market Value (USD Million) by Deployment Model, 2025-2035
  • Figure 172: Middle East & Africa Market Value (USD Million) by Country, 2025-2035
  • Figure 173: Middle East & Africa Market Value (USD Million) Analysis by Country, 2020-2035
  • Figure 174: Middle East & Africa Market Volume (PMPM-priced members) Analysis by Country, 2020-2035
  • Figure 175: Middle East & Africa Market Value Share (%) and BPS Analysis by Country, 2025-2035
  • Figure 176: Middle East & Africa Market Y-o-Y Growth (%) Projections by Country, 2025-2035
  • Figure 177: Middle East & Africa Market Value (USD Million) Analysis by Clinical Pathway, 2020-2035
  • Figure 178: Middle East & Africa Market Volume (PMPM-priced members) Analysis by Clinical Pathway, 2020-2035
  • Figure 179: Middle East & Africa Market Value Share (%) and BPS Analysis by Clinical Pathway, 2025-2035
  • Figure 180: Middle East & Africa Market Y-o-Y Growth (%) Projections by Clinical Pathway, 2025-2035
  • Figure 181: Middle East & Africa Market Value (USD Million) Analysis by Data Source, 2020-2035
  • Figure 182: Middle East & Africa Market Volume (PMPM-priced members) Analysis by Data Source, 2020-2035
  • Figure 183: Middle East & Africa Market Value Share (%) and BPS Analysis by Data Source, 2025-2035
  • Figure 184: Middle East & Africa Market Y-o-Y Growth (%) Projections by Data Source, 2025-2035
  • Figure 185: Middle East & Africa Market Value (USD Million) Analysis by Deployment Model, 2020-2035
  • Figure 186: Middle East & Africa Market Volume (PMPM-priced members) Analysis by Deployment Model, 2020-2035
  • Figure 187: Middle East & Africa Market Value Share (%) and BPS Analysis by Deployment Model, 2025-2035
  • Figure 188: Middle East & Africa Market Y-o-Y Growth (%) Projections by Deployment Model, 2025-2035
  • Figure 189: Middle East & Africa Market Attractiveness by Clinical Pathway, 2025-2035
  • Figure 190: Middle East & Africa Market Attractiveness by Data Source, 2025-2035
  • Figure 191: Middle East & Africa Market Attractiveness by Deployment Model, 2025-2035
  • Figure 192: Middle East & Africa Market Attractiveness by Country, 2025-2035

Frequently Asked Questions

How big is the AI-powered Care Coordination market in 2025?

The global AI-powered Care Coordination market is valued at USD 651.1 million in 2025.

What will be the size of the AI-powered Care Coordination market in 2035?

The size of the AI-powered Care Coordination market is projected to reach USD 1305.0 million by 2035.

How much will the AI-powered Care Coordination market grow between 2025 and 2035?

The AI-powered Care Coordination market is expected to grow at a 7.2% CAGR between 2025 and 2035.

What are the key clinical pathway segments in the AI-powered Care Coordination market?

The key clinical pathway segments in the AI-powered Care Coordination market are Acute & Emergency, Chronic Disease Management, Oncology Care Coordination, Behavioral Health & Mental Health, and Preventive & Population Health.

Which clinical pathway segment is expected to contribute a significant share to the AI-powered Care Coordination market in 2025?

In terms of clinical pathway, the Acute & Emergency segment is set to command the dominant share in the AI-powered Care Coordination market in 2025.

Explore Similar Insights

Future Market Insights

AI-powered Care Coordination Market

Chat With

MaRIA

Hi There, I am MaRIA, Your Market Research Intelligence Assistant. How may I help you?