
- Market Size (2026)
- USD 5.1 Bn
- Forecast (2036)
- USD 11.8 Bn
- CAGR (2026 to 2036)
- 8.8%
How Big Is the Amphibious Vehicle Market in 2026?
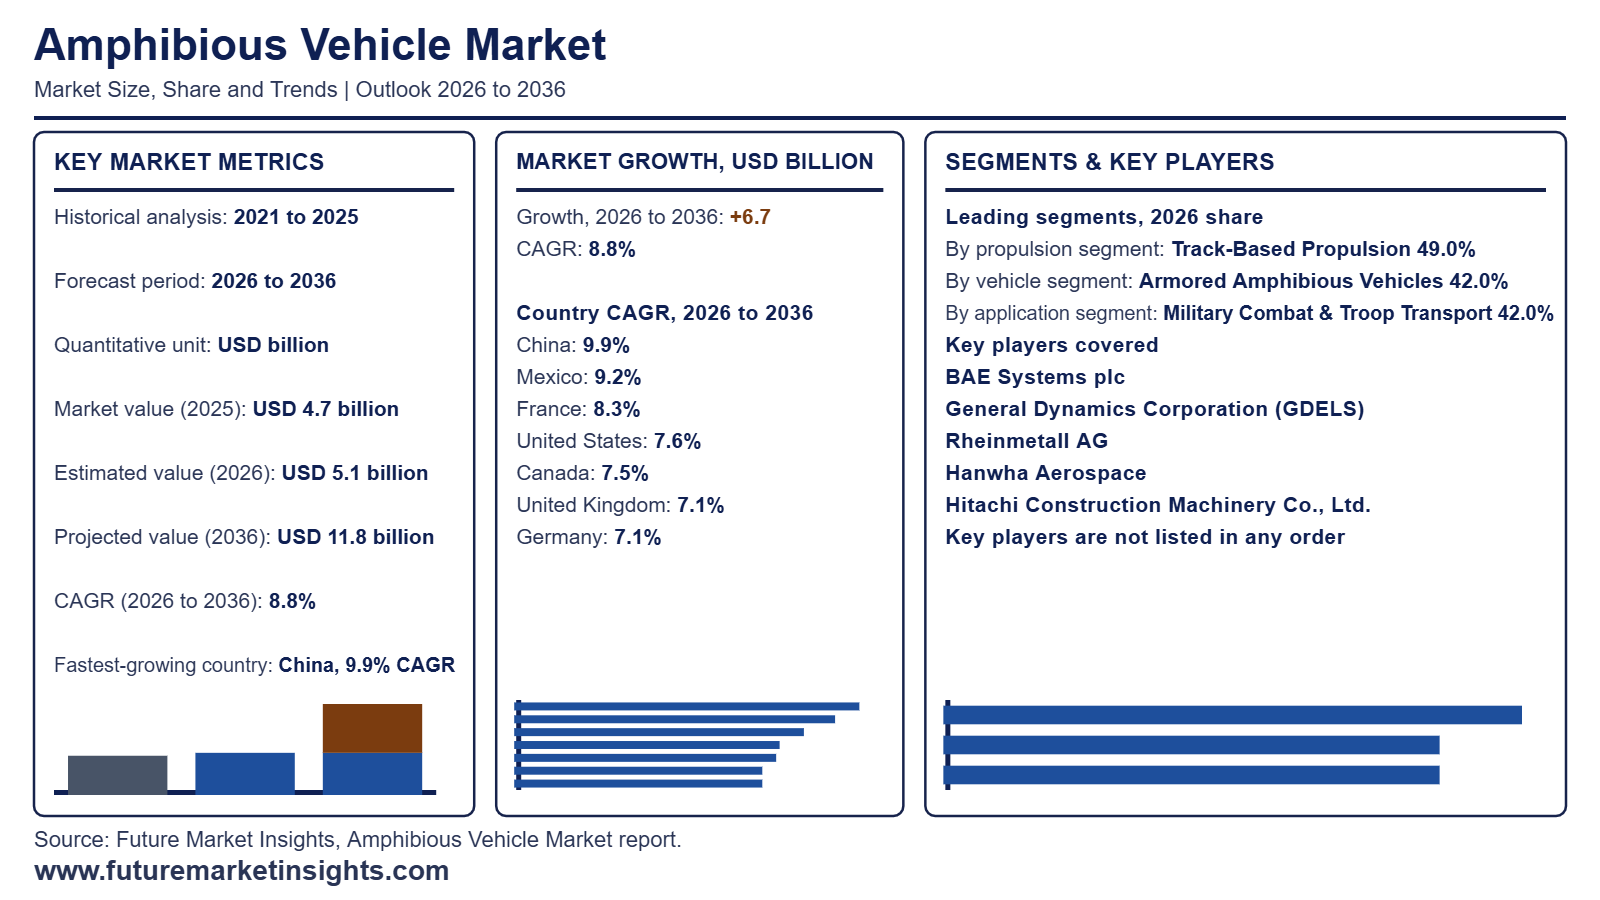
Assessed at USD 4.7 billion in 2025 and progressing to USD 5.1 billion in 2026, the global amphibious vehicle market valuation is on course according to Future Market Insights (FMI) to reach USD 11.8 billion by 2036, aided by an 8.8% CAGR that delivers USD 6.7 billion in incremental expansion.
| Market Metric | Valuation / Share / Forecast Benchmark |
|---|---|
| 2025 Market Size (Historical) | USD 4.7 billion |
| 2026 Market Size (Estimated) | USD 5.1 billion |
| 2036 Market Size (Projected) | USD 11.8 billion |
| Compound Annual Growth Rate (2026 to 2036) | 8.8% CAGR |
| Incremental Dollar Opportunity (2026 to 2036) | USD 6.7 billion |
| Dominant Propulsion Segment (2026 Share) | Track-Based Propulsion (49.0% in 2026) | Other Segment Combined (51.0% in 2026) | Total (100.0%) |
| Dominant Vehicle Segment (2026 Share) | Armored Amphibious Vehicles (42.0% in 2026) | Other Segment Combined (58.0% in 2026) | Total (100.0%) |
| Dominant Application Segment (2026 Share) | Military Combat & Troop Transport (42.0% in 2026) | Other Segment Combined (58.0% in 2026) | Total (100.0%) |
| Dominant End-Use Segment (2026 Share) | Defense Forces (38.0% in 2026) | Other Segment Combined (62.0% in 2026) | Total (100.0%) |
| Fastest-Growing Country Markets (2026 to 2036) | China (9.9% CAGR), Mexico (9.2% CAGR), France (8.3% CAGR) |
| Additional Tracked Country Markets (2026 to 2036) | United States (7.6% CAGR), Canada (7.5% CAGR), United Kingdom (7.1% CAGR), Germany (7.1% CAGR) |
| Leading Active Market Participants | BAE Systems plc, General Dynamics Corporation (GDELS), Rheinmetall AG, Hanwha Aerospace, Hitachi Construction Machinery Co., Ltd., Wetland Equipment Company, Wilco Manufacturing L.L.C., Marsh Buggies Incorporated, SHERP |
Source: Future Market Insights analysis of the amphibious vehicle market, 2026.
This Report Answers
- How large the amphibious vehicle market is in 2026 and what it reaches by 2036
- Which propulsion, vehicle, application and end-use segments lead in 2026
- What is driving demand and what is holding the category back
- Which countries grow fastest between 2026 and 2036
- What BAE Systems plc and other leading players have launched
- How the amphibious vehicle market is defined, segmented and measured
Executive Market Overview
Procurement of amphibious vehicles is accelerating as naval infantry forces replace legacy ship-to-shore assault carriers and European engineering battalions standardize wide wet-gap bridging rigs. As per FMI's assessment of defense procurement tenders, multi-year production awards convert military modernization budgets into predictable factory deliveries once hull buoyancy and surf-transit survivability pass qualification trials. Contract announcements from BAE Systems plc (April 2025) confirm a USD 188.5 million full-rate production award from the U.S. Marine Corps for 30 Amphibious Combat Vehicle 30mm (`ACV-30`) units, while the U.S. Marine Corps (August 2025) celebrated delivery of the 300th Amphibious Combat Vehicle at the York, Pennsylvania plant with ballistic protection upgrades.
Civil and commercial demand follows a separate economic model anchored in wetland dredging, coastal levee remediation, and flood rescue where standard crawler excavators sink in saturated soil. FMI projects Track-Based Propulsion to command 49.0% of propulsion revenue in 2026 driven by pontoon-track undercarriages that distribute machine weight across marshland and riverbanks. Product launch records from Hitachi Construction Machinery Asia and Pacific (February 2025) document the rollout of specialized amphibious excavators equipped with hydraulic extendable pontoons and Multi-Synchronous Drive motors for Southeast Asian maintenance dredging. Market sizing includes completed land-water amphibious vehicles across rescue and commercial transport roles, while excluding standalone boats, fixed bridges, and aftermarket components.
Analyst Perspective
"Amphibious vehicle manufacturers secure multi-year margin visibility by winning platform-family contracts that extend a single qualified hull across troop transport, 30mm direct-fire, recovery, and uncrewed variants. The principal commercial risk is saltwater corrosion and seal maintenance complexity, which lengthens military acceptance testing and pushes civil contractors toward short-term rentals."
- Nikhil Kaitwade, Principal Consultant, Future Market Insights (FMI)
Key Market Trends & Insights
- Expansion from Troop Carriers into Specialized Recovery and Direct-Fire Variants: Naval expeditionary forces are expanding core personnel carrier fleets to include dedicated field-recovery and medium-caliber cannon variants built on shared 8x8 amphibious hulls. Contract disclosures from BAE Systems plc (October 2026) confirm a USD 230.1 million U.S. Marine Corps award for 32 Amphibious Combat Vehicle Recovery (`ACV-R`) variant chassis produced in York, Pennsylvania through 2029, following a BAE Systems plc (January 2026) USD 184 million full-rate production contract. Shared chassis commonality lowers spare-parts inventory costs across deployed units using driven portal axles.
- NATO Standardization Around Self-Propelled Amphibious Bridge and Ferry Rigs: European armies are replacing 30-year-old wet-gap crossing equipment with interoperable 4x4 amphibious rigs capable of ferrying 70-ton main battle tanks across wide rivers in under 10 minutes. Procurement announcements from General Dynamics European Land Systems (September 2025) and General Dynamics European Land Systems (December 2025) confirm that Denmark and Norway joined the M3 amphibious bridge and ferry user group in late 2025, with GDELS supplying more than 90% of NATO amphibious bridging capacity and military trucks.
- Integration of Autonomous Uncrewed Amphibious Kits for Littoral Reconnaissance: Defense agencies are fielding robotic amphibious ground vehicles to conduct beachhead reconnaissance, communications relay, and medical resupply without exposing crews to littoral fire. Press disclosures from Rheinmetall AG (September 2026) document a USD 7.28 million U.S. Marine Corps contract for 12 Mission Master SP autonomous uncrewed ground vehicles and 5 amphibious flotation kits equipped with PATH autonomy and ruggedized military displays.
What Are the Main Drivers, Restraints, and Opportunities?
Multi-nation defense wet-gap modernization and full-rate Marine Corps lot awards drive core revenue, whereas dual-environment maintenance complexity restrains fleet readiness, leaving flood-response utility vehicles and pontoon excavators as high-growth civil opportunities.
Driver: Full-Rate Naval Infantry Production Lots and Joint NATO Bridging Contracts
Defense ministries fund amphibious vehicle programs to move armored units across contested shorelines and inland river barriers without waiting for fixed bridge construction. FMI finds that multi-year production lots provide suppliers with long-cycle backlog visibility attributed to strict military qualification barriers that lock out uncertified competitors. Contract records from BAE Systems plc (February 2026) document a USD 195 million award for 30 additional U.S. Marine Corps Amphibious Combat Vehicles under full-rate production Lot 5/6, while General Dynamics European Land Systems (November 2026) delivered the first M3 amphibious bridge and ferry system to Norway in November 2026 powered by marine propulsion engines.
Restraint: Dual-Environment Corrosion, Hull Seal Maintenance, and Fleet Readiness Costs
Operating heavy armored or excavation machinery across saltwater surf zones and abrasive mud imposes severe hull-sealing and drivetrain inspection burdens. In FMI's view, high lifecycle maintenance costs slow procurement conversion among budget-constrained municipalities and civil contractors that cannot keep specialized machines working year-round. Readiness audits published by the U.S. Government Accountability Office (July 2026) and the U.S. Government Accountability Office (March 2026) confirm persistent spare-parts shortages and depot maintenance backlogs across amphibious and ground combat fleets, requiring dedicated corrosion control and defense ground support equipment.
Opportunity: Modular Pontoon Excavators and Public-Safety Flood Rescue Fleets
Civil engineering contractors and disaster-response agencies are procuring amphibious marsh excavators and all-terrain rescue carriers to reach flooded communities and coastal wetlands inaccessible to wheeled trucks or fast rescue boats. FMI expects civil and public-safety orders to expand steadily helped by extreme precipitation events and federal flood-adaptation budgets. Federal grant announcements from Environment and Climate Change Canada (June 2025) and disaster-force directives from the State Council of the People's Republic of China (January 2026) confirm expanded national funding for northern flood-rescue equipment and wetland infrastructure protection.
How Is the Amphibious Vehicle Market Segmented?
Amphibious Vehicle Market is segmented by Propulsion, Vehicle, Application, End Use, and Region. Forecast period from 2026 to 2036.
| Segmentation Axis | Sub-Segments Covered | 2026 Leading Segment & Share Breakdown | Main Growth Benchmark (2026 to 2036) |
|---|---|---|---|
| Propulsion | Track-Based Propulsion, Water Jet Propulsion, Screw Propeller | Track-Based Propulsion (49.0%) | Other Segment Combined (51.0%) | Total (100.0%) | Track-Based Propulsion leads via low ground pressure on mud and surf |
| Vehicle | Armored Amphibious Vehicles, Amphibious Excavators, Light Amphibious Utility Vehicles, Commercial Amphibious Transport | Armored Amphibious Vehicles (42.0%) | Other Segment Combined (58.0%) | Total (100.0%) | Armored Amphibious Vehicles lead on high-unit-value defense contracts |
| Application | Military Combat & Troop Transport, Disaster Response & Humanitarian Aid, Construction & Dredging, Commercial & Recreational Transport | Military Combat & Troop Transport (42.0%) | Other Segment Combined (58.0%) | Total (100.0%) | Combat & Troop Transport leads via multi-year ship-to-shore programs |
| End Use | Defense Forces, Disaster Management Agencies, Construction & Dredging Contractors, Tourism & Transport Operators, Government Municipalities | Defense Forces (38.0%) | Other Segment Combined (62.0%) | Total (100.0%) | Defense Forces lead via integrated fleet procurement and sustainment |
Source: Future Market Insights analysis of the amphibious vehicle market, 2026.
Why Does the Track-Based Propulsion Segment Lead by Propulsion?
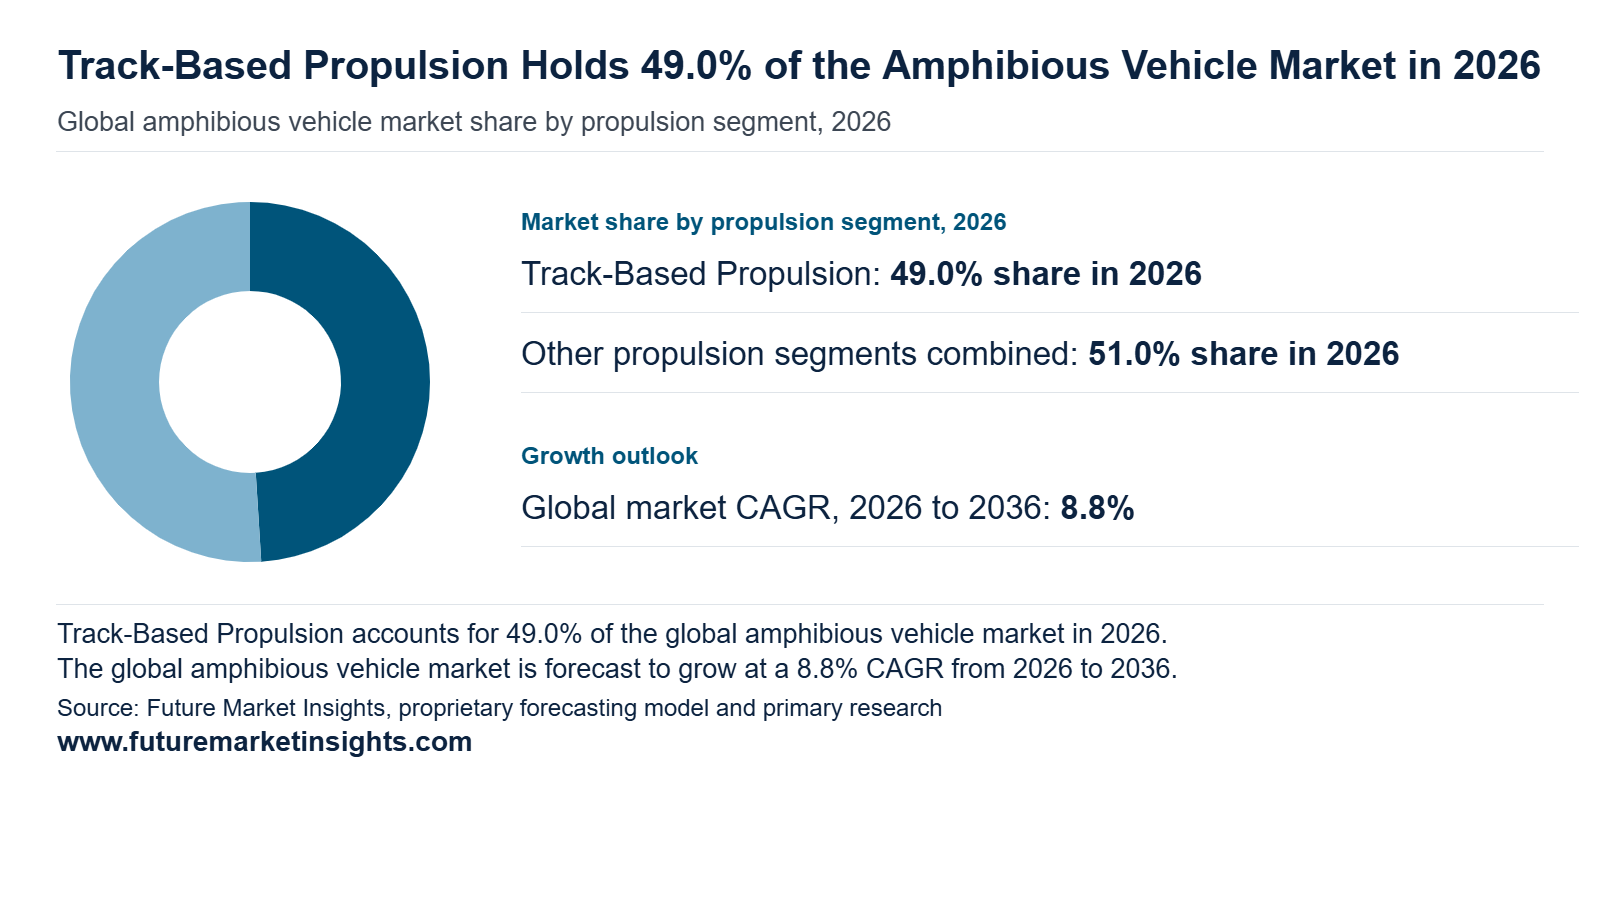
Track-Based Propulsion captures 49.0% of the Propulsion segment in 2026, favored for low ground pressure and continuous traction across soft sand, tidal mudflats, and marshy riverbanks using heavy-duty defense rubber tracks to transition between water and soft soil.
Why Does the Armored Amphibious Vehicles Segment Lead by Vehicle?
Armored Amphibious Vehicles hold 42.0% of the Vehicle segment in 2026across Amphibious Excavators, Light Amphibious Utility Vehicles, and Commercial Amphibious Transport. FMI's analysis indicates that armored platforms command the largest revenue share due to high per-unit acquisition prices that bundle blast-resistant hulls, remote weapon stations, and nuclear-biological-chemical protection suites. Exhibition disclosures from Hanwha Aerospace (June 2026) and Rheinmetall AG (June 2026) at Eurosatory 2026 highlight how tracked K21 and 6x6 Fuchs Evolution armored platforms integrate modular mission turrets and composite armor materials.
Why Does the Military Combat & Troop Transport Segment Lead by Application?
Military Combat & Troop Transport accounts for 42.0% of the Application segment in 2026across Disaster Response & Humanitarian Aid, Construction & Dredging, and Commercial & Recreational Transport. FMI observes that littoral warfare doctrine requires protected squad carriers that launch from amphibious assault ships beyond horizon radar range and fight directly inland without pausing at the beachline. Operational exercises documented by the Ministry of National Defense of the People's Republic of China (September 2026) saw more than 1,000 Marines compete in the September 2026 Amphibious Elite Challenge Tournament testing squad-level armored amphibious assault and maritime obstacle crossing.
Why Does the Defense Forces Segment Lead by End Use?
Defense Forces represent 38.0% of the End Use segment in 2026across Disaster Management Agencies, Construction & Dredging Contractors, Tourism & Transport Operators, and Government Municipalities. In FMI's view, national defense ministries lead end-use purchasing fueled by multi-year parliamentary appropriations that fund both initial vehicle lots and 20-year depot sustainment contracts. Joint procurement records from the UK Ministry of Defence (October 2025) confirm the bilateral Anglo-German OCCAR contract for 36 M3 EVO amphibious bridging vehicles for the Royal Engineers and hydraulic rescue hoist systems and logistics support.
Regional & Country Outlook
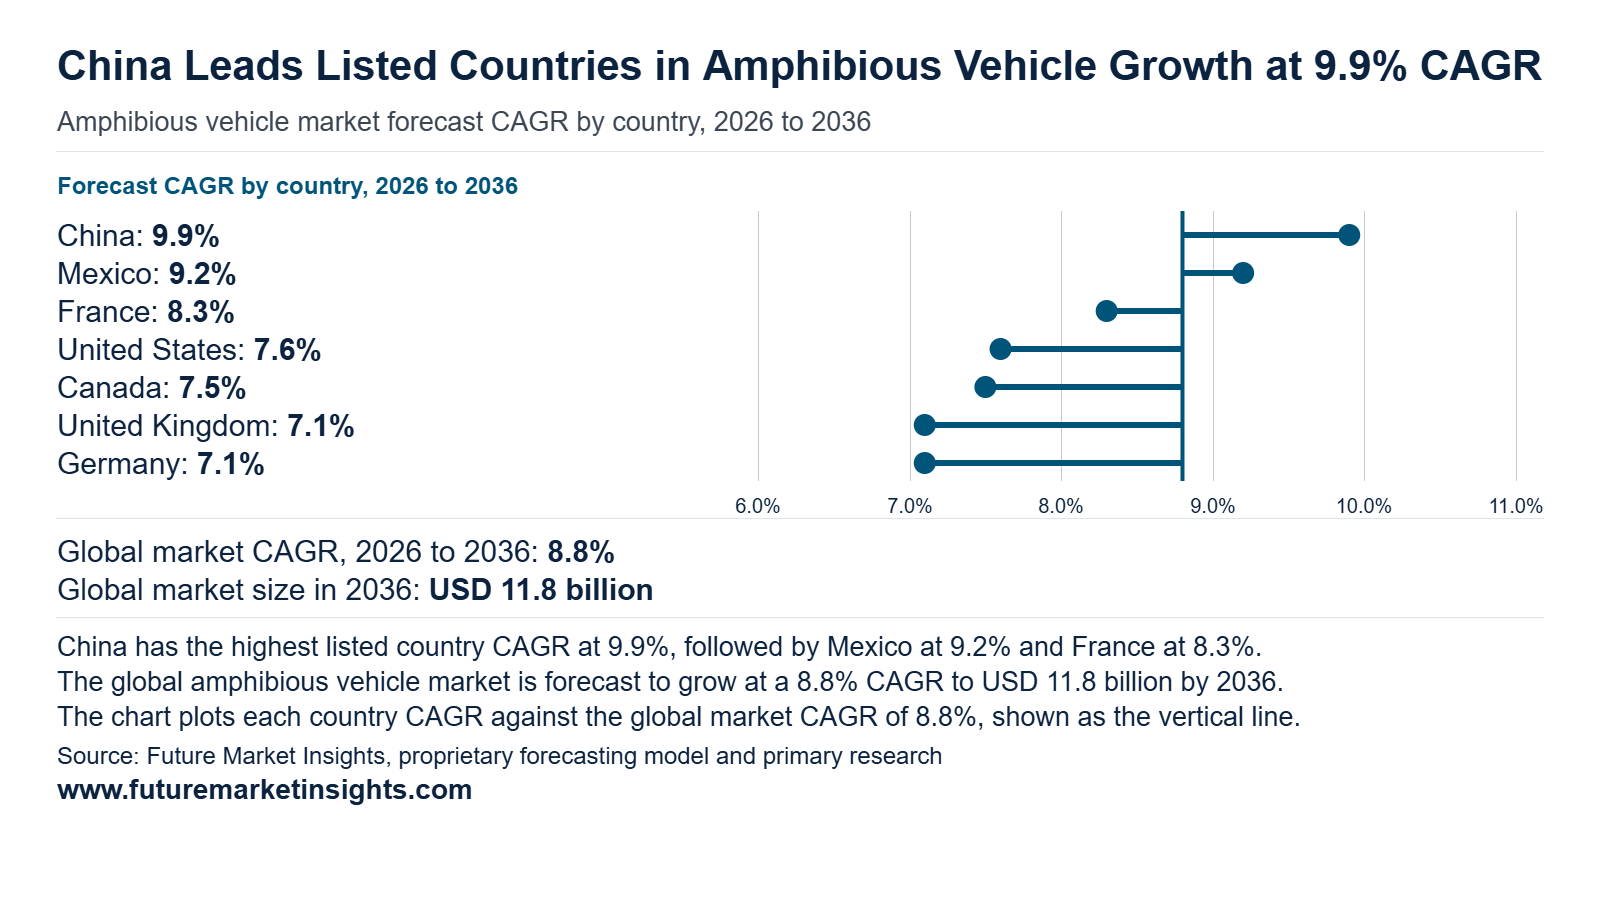
North America, East Asia, and Western Europe generate the majority of global amphibious vehicle revenue in 2026, anchored by U.S. Marine Corps ACV production lots, Chinese littoral assault and flood-rescue fleet expansion, and joint Anglo-German M3 EVO bridging procurement. FMI projects the seven core countries profiled below to account for 75.5% of global revenue in 2026 (USD 3.85 billion) and 73.6% by 2036 (USD 8.69 billion), adding USD 4.84 billion over the forecast decade. China leads national growth at a 9.9% CAGR, followed by Mexico at 9.2% CAGR and France at 8.3% CAGR, while the United States remains the largest single national market at USD 1.48 billion in 2026.
| Country | 2026 Revenue | 2036 Revenue | 10-Year Addition | 2026 to 2036 CAGR | Global Share (2026 -> 2036) |
|---|---|---|---|---|---|
| China | USD 1.02 billion | USD 2.62 billion | +USD 1.60 billion | 9.9% | 20.0% -> 22.2% |
| Mexico | USD 0.15 billion | USD 0.36 billion | +USD 0.21 billion | 9.2% | 2.9% -> 3.1% |
| France | USD 0.31 billion | USD 0.69 billion | +USD 0.38 billion | 8.3% | 6.1% -> 5.8% |
| United States | USD 1.48 billion | USD 3.08 billion | +USD 1.60 billion | 7.6% | 29.0% -> 26.1% |
| Canada | USD 0.23 billion | USD 0.47 billion | +USD 0.24 billion | 7.5% | 4.5% -> 4.0% |
| United Kingdom | USD 0.33 billion | USD 0.66 billion | +USD 0.33 billion | 7.1% | 6.5% -> 5.6% |
| Germany | USD 0.33 billion | USD 0.81 billion | +USD 0.48 billion | 7.1% | 6.5% -> 6.9% |
Source: Future Market Insights analysis of the amphibious vehicle market, 2026.
United States
Demand for amphibious vehicle in United States is projected to rise from USD 1.48 billion in 2026 to USD 3.08 billion by 2036, advancing at a 7.6% CAGR and adding USD 1.60 billion in new revenue. FMI observes that United States demand combines full-rate Marine Corps ACV-30 and ACV-R procurement with Gulf Coast wetland excavation and pipeline maintenance fleets built in Louisiana. Production disclosures from BAE Systems plc (October 2026) and civil equipment specifications from Wilco Manufacturing L.L.C. (January 2026) and Marsh Buggies Incorporated (January 2026) confirm active manufacturing across defense and coastal dredging sectors. Multi-year Marine Corps variant deliveries and coastal restoration contracts will sustain United States market expansion through 2036.
China
Buyer adoption of amphibious vehicle across China is estimated to expand from USD 1.02 billion in 2026 to USD 2.62 billion by 2036, spurred by a 9.9% CAGR and generating USD 1.60 billion in commercial expansion. FMI finds that Chinese demand is anchored by PLA Navy Marine Corps Type-05 armored assault vehicle deployments and national emergency-management purchases of tracked flood-rescue carriers. Official reports from the Ministry of National Defense of the People's Republic of China (July 2026) and the Ministry of National Defense of the People's Republic of China (October 2026) document continuous ZBD-05 beach-landing operations and sea trials of the 40,000-ton Type 076 amphibious assault ship Sichuan carrying amphibious equipment. Dual military littoral modernization and provincial flood-rescue procurement will drive Chinese orders through 2036.
Germany
Germany's amphibious vehicle industry is set to scale from USD 0.33 billion in 2026 to USD 0.81 billion by 2036, driven by a 7.1% CAGR and adding USD 0.48 billion in incremental market value. In FMI's assessment, Germany is Europe's industrial manufacturing hub for self-propelled wet-gap bridging systems and wheeled 6x6 armored transport vehicles. Corporate announcements from General Dynamics European Land Systems (October 2025) and field reports from the Bundeswehr (February 2025) confirm expanded M3 EVO production investments at Kaiserslautern for the binational German-British engineer battalion in Minden. Ongoing NATO wet-gap fleet deliveries from German plants will support steady national revenue growth through 2036.
United Kingdom
Sales of amphibious vehicle throughout United Kingdom are projected to increase from USD 0.33 billion in 2026 to USD 0.66 billion by 2036, progressing at a 7.1% CAGR and creating USD 0.33 billion in additional revenue. FMI believes British demand is anchored by Royal Engineers wet-gap crossing modernization and littoral strike force upgrades under the Strategic Defence Review. Official procurement records from the UK Ministry of Defence (October 2025) confirm the acquisition of 36 M3 EVO amphibious bridging and ferry vehicles capable of carrying Challenger 3 main battle tanks across water obstacles exceeding 100 meters. Staged M3 EVO deliveries and coastal flood-response vehicle renewals are forecast to sustain British demand through 2036.
France
Consumption of amphibious vehicle across France is estimated to climb from USD 0.31 billion in 2026 to USD 0.69 billion by 2036, reflecting a 8.3% CAGR and contributing USD 0.38 billion over the forecast decade. FMI notes that French procurement is shaped by joint expeditionary landing exercises and municipal civil-security equipment needs across flood-exposed river basins. Defense updates from the Ministry for the Armed Forces, France (June 2025) document French Army amphibious landing operations during Exercise Polaris 25, while the Ministry for Ecological Transition, France (August 2025) identifies flooding as France's primary natural hazard across municipal jurisdictions. Expeditionary force upgrades and municipal flood-access equipment tenders will support French market growth through 2036.
Canada
Revenue generated by amphibious vehicle suppliers in Canada is forecast to expand from USD 0.23 billion in 2026 to USD 0.47 billion by 2036, supported by a 7.5% CAGR and generating USD 0.24 billion in new category sales. In FMI's view, Canadian federal agencies procure tracked and wheeled amphibious utility vehicles to operate across thawing Arctic muskeg, ice-breakup waterways, and seasonal flood zones. Official tender records from Government of Canada, CanadaBuys (March 2026) document contract `M1500-254787` for amphibious vehicles supplied to the Royal Canadian Mounted Police, while Department of National Defence, Canada (April 2026) disclosures outline Arctic all-terrain mobility investments. Public-safety and northern sovereignty vehicle programs will drive Canadian orders through 2036.
Mexico
Buyer procurement of amphibious vehicle throughout Mexico is tracking from USD 0.15 billion in 2026 to USD 0.36 billion by 2036, exhibiting a 9.2% CAGR and contributing USD 0.21 billion to national market value. FMI's analysis indicates that hurricane emergency-response deployments along Pacific and Gulf coastlines and silt removal in shallow lagoons create recurring public-sector demand for amphibious vehicles and excavators. Operational readiness releases from the Secretaria de Marina, Mexico (October 2025) confirm active Plan Marina deployments of specialized amphibious and emergency vehicles across coastal states during tropical storm events, supported by low-carbon marine propulsion and naval support investments. Coastal disaster-relief and lagoon-dredging contracts are expected to sustain Mexican procurement through 2036.
Competitive Environment and Notable Companies
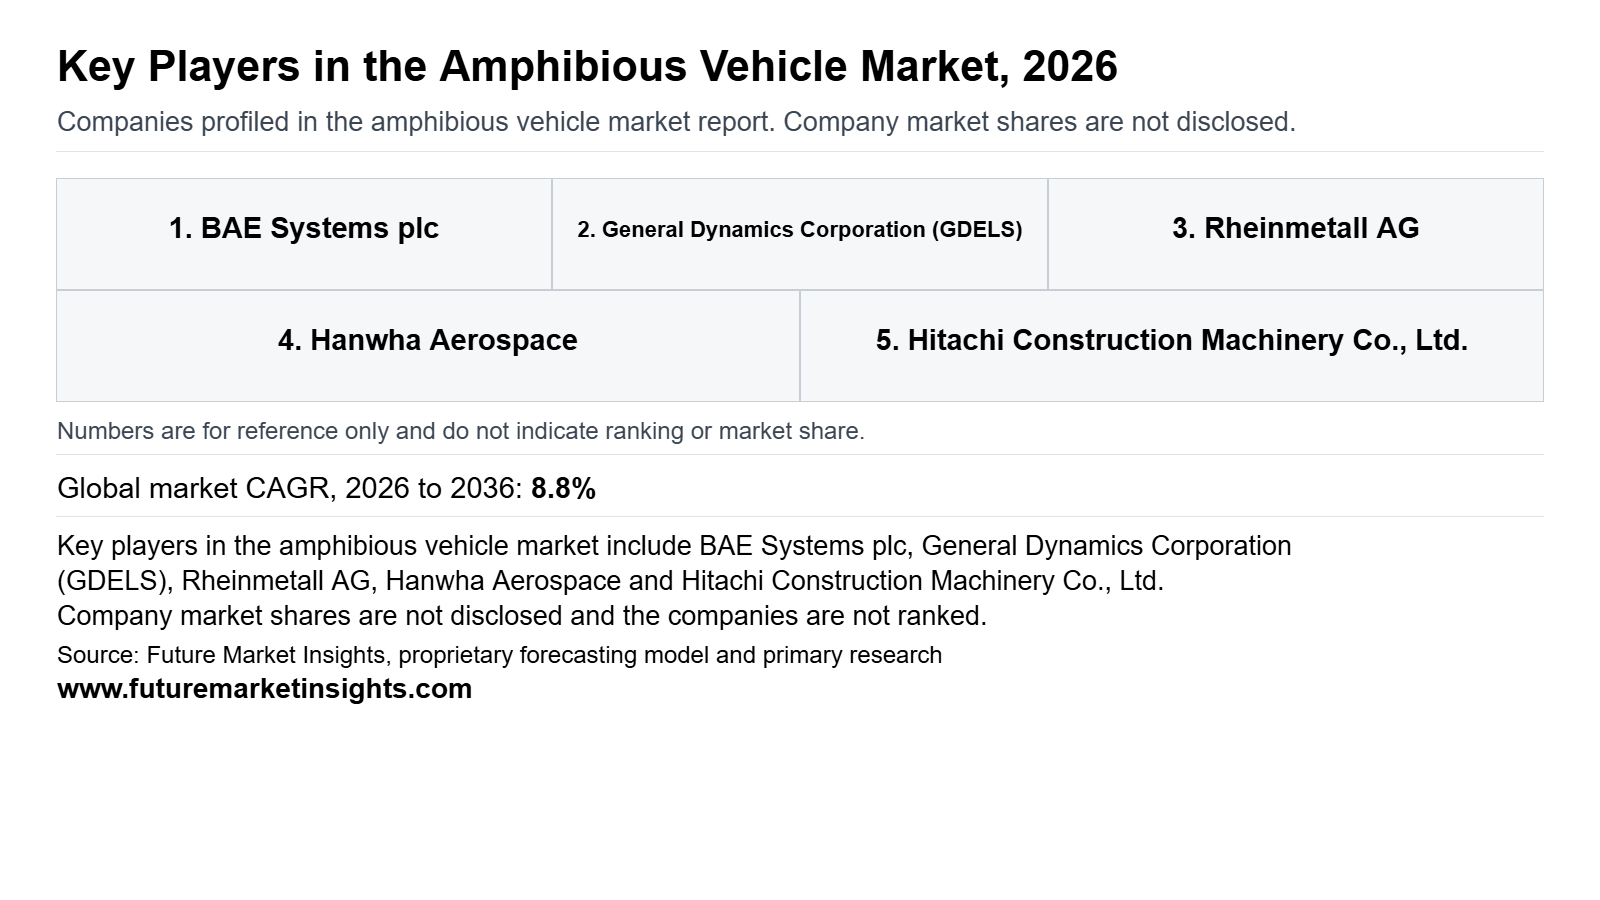
Notable companies operating in the global amphibious vehicle market include BAE Systems plc, General Dynamics Corporation (General Dynamics European Land Systems), Rheinmetall AG, Hanwha Aerospace, Hitachi Construction Machinery Co., Ltd., Wetland Equipment Company, Wilco Manufacturing L.L.C., Marsh Buggies Incorporated, and SHERP. Competitive structure separates into Tier-1 defense prime contractors (BAE Systems, GDELS, Rheinmetall, Hanwha Aerospace) executing multi-hundred-million-dollar armored combat and wet-gap bridging programs, and specialized civil/utility manufacturers (Hitachi Construction Machinery, Wetland Equipment, Wilco Manufacturing, Marsh Buggies, SHERP) building floating-pontoon excavators and extreme-terrain utility vehicles.
How Are Companies Positioned in the Amphibious Vehicle Market?
BAE Systems plc leads wheeled 8x8 armored ship-to-shore combat vehicles through the U.S. Marine Corps ACV family (`ACV-P`, `ACV-C`, `ACV-30`, and `ACV-R`). General Dynamics European Land Systems dominates NATO self-propelled amphibious bridging and ferry systems with the M3 and M3 EVO rig. Hanwha Aerospace positions tracked KAAV and K21 amphibious armored platforms, while Rheinmetall AG supplies amphibious Fuchs Evolution configurations and Mission Master SP autonomous amphibious uncrewed vehicles.
What Matters When a Buyer Selects an Amphibious Vehicle Supplier?
Military acquisition commands evaluate suppliers on sea-state surf transit stability and ballistic blast protection, NATO STANAG interoperability, and 20-year spare-parts sustainment. Civil dredging and utility contractors evaluate pontoon buoyancy margins, ground pressure in psi, hydraulic extendable pontoon width for highway flatbed transport, and local dealer service support.
Which Capabilities Distinguish Product Offers?
Defense prime contractors differentiate through modular mission integration on a single hull: BAE Systems plc (October 2026) adapts the ACV hull for field recovery (`ACV-R`) and 30mm turret fire (`ACV-30`), while Rheinmetall AG (September 2026) integrates PATH autonomous navigation with amphibious kits on the Mission Master SP. In civil equipment, Hitachi Construction Machinery Asia and Pacific (February 2025) uses a Multi-Synchronous Drive System with front and rear travel motors, and SHERP (January 2026) uses ultra-low-pressure tubeless tires that inflate via exhaust gas to float across water and ice.
How Does Geographic Reach Affect Competition?
BAE Systems plc anchors production in York, Pennsylvania for U.S. Marine Corps programs, while General Dynamics European Land Systems manufactures M3 systems in Kaiserslautern, Germany for Germany, the United Kingdom and Sweden. Hitachi Construction Machinery Co., Ltd. manufactures amphibious excavators through its Indonesian affiliate for Southeast Asia, whereas Wetland Equipment Company, Wilco Manufacturing L.L.C., and Marsh Buggies Incorporated fabricate marsh excavators and buggies in Louisiana for North American and international wetland contractors.
| Verified Company Evidence (2025 to 2026) | Commercial Effect | Buyer Action |
|---|---|---|
| October 2026: BAE Systems plc received a USD 230.1 million contract from the U.S. Marine Corps for 32 Amphibious Combat Vehicle Recovery (ACV-R) variant chassis (BAE Systems plc, October 2026). | Extends full-rate ACV production into specialized field-maintenance and recovery variants through 2029. | Align fleet support and depot tooling schedules with modular ACV variant deliveries. |
| October 2025 & November 2026: General Dynamics European Land Systems signed the joint UK-Germany M3 EVO contract (exceeding EUR 450 million / USD 485 million) and delivered Norway's first M3 rig in November 2026 (GDELS, October 2025 & November 2026). | Consolidates European NATO wet-gap crossing fleets around a single interoperable amphibious bridge and ferry platform. | Standardize coalition engineer training and pontoon coupling interfaces around M3 EVO specifications. |
| September 2026: American Rheinmetall received a USD 7.28 million contract to deliver 12 Mission Master SP autonomous uncrewed ground vehicles and 5 amphibious kits to the U.S. Marine Corps (Rheinmetall AG, September 2026). | Opens a commercial pathway for autonomous uncrewed amphibious resupply and reconnaissance platforms. | Evaluate modular amphibious flotation kits for uncrewed ground vehicles in littoral logistics tenders. |
Source: Verified corporate disclosures and Future Market Insights analysis, 2026.
| Company | Core Positioning | Verified Activity & Source Attribution |
|---|---|---|
| BAE Systems plc | 8x8 Armored Amphibious Combat Vehicles (ACV-P, ACV-C, ACV-30, ACV-R) and tracked AAV7A1 sustainment | Secured USD 188.5 million ACV-30 contract in April 2025, USD 184 million contract in January 2026, USD 195 million contract in February 2026, and USD 230.1 million ACV-R contract in October 2026 (BAE Systems plc, October 2026). |
| General Dynamics Corporation (GDELS) | Self-propelled M3 and M3 EVO 4x4 amphibious bridge and ferry systems | Signed joint UK-Germany M3 EVO contract in October 2025, Danish and Norwegian orders in late 2025, and first Norwegian M3 delivery in November 2026 (GDELS, November 2026). |
| Rheinmetall AG | Fuchs Evolution 6x6 armored amphibious vehicles and Mission Master SP autonomous amphibious UGVs | Awarded USD 7.28 million USMC contract for 12 Mission Master SP vehicles and 5 amphibious kits in September 2026 and presented Fuchs JAGM in June 2026 (Rheinmetall AG, September 2026). |
| Hanwha Aerospace | Tracked KAAV amphibious assault vehicles, K21 amphibious infantry fighting vehicles, and H-UGV platforms | Exhibited K21-based H-UGV and armored land systems at Eurosatory in June 2026 (Hanwha Aerospace, June 2026). |
| Hitachi Construction Machinery Co., Ltd. | Purpose-built amphibious hydraulic excavators with extendable floating pontoon undercarriages | Launched new amphibious excavators with Multi-Synchronous Drive Systems in February 2025 for Southeast Asian dredging and wetland construction (Hitachi Construction Machinery Asia and Pacific, February 2025). |
| Wetland Equipment Company | 5-ton to 22-ton amphibious excavators, marsh buggies, and hydraulic pontoon undercarriages | Manufactures sealed pontoon undercarriages and amphibious excavators in Thibodaux, Louisiana for CAT, Komatsu, Volvo, and Bobcat carriers (Wetland Equipment Company, January 2026). |
| Wilco Manufacturing L.L.C. | Custom swamp-dredging amphibious excavators and tracked marsh personnel carriers | Fabricates heavy-duty amphibious excavators and wetland access carriers in Lafayette, Louisiana (Wilco Manufacturing L.L.C., January 2026). |
| Marsh Buggies Incorporated | Tracked and pontoon-mounted marsh buggies, amphibious excavators, and cargo carriers | Supplies custom marsh buggies and wetland excavation platforms from its Louisiana manufacturing base (Marsh Buggies Incorporated, January 2026). |
| SHERP | Ultra-low-pressure tire amphibious utility terrain vehicles (SHERP N 1200 and SHERP Q) | Supplies all-terrain amphibious utility and rescue vehicles capable of crossing water, thin ice, and peat bogs (SHERP, January 2026). |
Source: Verified corporate disclosures and Future Market Insights analysis, 2026.
Key takeaways
- Valued at USD 5.1 billion in 2026, on course for USD 11.8 billion by 2036.
- The decade adds USD 6.7 billion in new value at an 8.8% CAGR.
- The propulsion segment is led by Track-Based Propulsion at 49.0% of 2026 revenue.
- 42.0% of vehicle revenue goes to Armored Amphibious Vehicles in 2026.
- China grows fastest at 9.9% CAGR, ahead of Mexico at 9.2%.
Amphibious Vehicle Market Report Scope and Research Methodology
FMI sizes the global amphibious vehicle market by reconciling defense ministry procurement contracts, multi-year full-rate production lot awards, and civil wetland machinery shipments across North America, Europe, Asia-Pacific, Latin America, and the Middle East and Africa. Primary interviews with defense program managers, military combat-engineering officers, wetland dredging contractors, and pontoon undercarriage fabricators validate unit pricing, variant mix, and fleet replacement cycles. Revenue is recorded in the country of buyer delivery and reconciled across Propulsion and Vehicle as well as Application as well as End-use Use to match the global valuation of USD 5.1 billion in 2026 and USD 11.8 billion by 2036. Non-amphibious ground vehicles, standalone marine vessels, fixed bridges, and aftermarket spare parts are excluded.
| Coverage Field | Report Scope |
|---|---|
| Market definition | New-sale revenue from completed land-water amphibious vehicles across military combat, wet-gap bridging, wetland excavation, disaster rescue, and utility transport roles. |
| Propulsion segmentation | Track-Based Propulsion (49.0% in 2026); Other Segment Combined (51.0%: Water Jet Propulsion, Screw Propeller); Total (100.0%). |
| Vehicle segmentation | Armored Amphibious Vehicles (42.0% in 2026); Other Segment Combined (58.0%: Amphibious Excavators, Light Amphibious Utility Vehicles, Commercial Amphibious Transport); Total (100.0%). |
| Application segmentation | Military Combat & Troop Transport (42.0% in 2026); Other Segment Combined (58.0%: Disaster Response & Humanitarian Aid, Construction & Dredging, Commercial & Recreational Transport); Total (100.0%). |
| End-use segmentation | Defense Forces (38.0% in 2026); Other Segment Combined (62.0%: Disaster Management Agencies, Construction & Dredging Contractors, Tourism & Transport Operators, Government Municipalities); Total (100.0%). |
| Platforms & configurations included | 8x8 and tracked ship-to-shore armored assault/recovery vehicles, 4x4 self-propelled amphibious bridge/ferry rigs, pontoon-mounted hydraulic excavators, and amphibious utility/rescue carriers. |
| Exclusions | Standalone boats and landing craft (LCAC/LCU), non-amphibious armored vehicles, fixed or non-self-propelled ribbon bridges, aftermarket parts, and equipment rental service fees. |
| Quantitative units | USD billion for all global and country market valuations. |
| Historical & base years | 2025 historical baseline (USD 4.7 billion); 2026 estimated base year (USD 5.1 billion). |
| Forecast period & 2036 projection | 2026 to 2036 (projected to reach USD 11.8 billion by 2036 at an 8.8% CAGR; +USD 6.7 billion incremental opportunity). |
| Regions covered | North America, Latin America, Western Europe, Eastern Europe, East Asia, South Asia and Pacific, and Middle East and Africa. |
| Countries profiled | United States, China, Germany, United Kingdom, France, Canada, and Mexico. |
| Companies profiled | BAE Systems plc, General Dynamics Corporation (GDELS), Rheinmetall AG, Hanwha Aerospace, Hitachi Construction Machinery Co., Ltd., Wetland Equipment Company, Wilco Manufacturing L.L.C., Marsh Buggies Incorporated, and SHERP. |
| Primary research validation | Structured interviews with defense acquisition officers, combat engineer commanders, and marsh excavation contractors. |
| Desk research sources | U.S. DoD/USMC contract awards, UK MoD/OCCAR filings, GAO readiness audits, CanadaBuys tender records, China MoD releases, and corporate disclosures. |
Source: Future Market Insights analysis of the amphibious vehicle market, 2026.
Research Sources and Bibliography
- BAE Systems plc. (2025, April 29). BAE Systems Receives $188.5 Million Full-Rate Production Contract from U.S. Marine Corps for Amphibious Combat Vehicle 30mm. https://www.baesystems.com/en/article/bae-systems-receives-188-million-full-rate-production-contract-from-us-marine-corps-for-amphibious-combat-vehicle-30mm
- BAE Systems plc. (2026, January 14). BAE Systems Receives $184 Million Full-Rate Production Contract, Expanding Amphibious Combat Vehicles Program. https://www.baesystems.com/en/article/bae-systems-receives-184-million-full-rate-production-contract-expanding-amphibious-combat-vehicles-program
- BAE Systems plc. (2026, February 3). BAE Systems Receives $195 Million Contract for 30 Additional Amphibious Combat Vehicles. https://www.baesystems.com/en-us/article/bae-systems-receives-195-million-contract-for-30-additional-amphibious-combat-vehicles
- BAE Systems plc. (2026, October 8). BAE Systems Receives $230 Million Contract for New Amphibious Combat Vehicle Variant. https://www.baesystems.com/en-us/article/bae-systems-receives-230-million-contract-for-new-amphibious-combat-vehicle-variant
- Bundeswehr. (2025, February 7). Mindener Pioniere empfangen Verteidigungsminister Boris Pistorius: Deutsch-Britisches Pionierbruckenbataillon 130. https://www.bundeswehr.de/de/organisation/heer/aktuelles/minister-besucht-pioniere-5884242
- Department of National Defence, Canada. (2026, April 27). Appearance Before the Standing Senate Committee on National Security, Defence and Veterans Affairs: Mandate, Priorities, and Arctic Mobility. https://www.canada.ca/en/department-national-defence/corporate/reports-publications/proactive-disclosure/2026/secd-mandate-priorities-nato-2percentage.html
- Environment and Climate Change Canada. (2025, June 18). The Government of Canada Is Investing in Flood Mapping and Adaptation Projects. https://www.canada.ca/en/environment-climate-change/news/2025/06/the-government-of-canada-is-investing-in-flood-mapping-and-adaptation-projects.html
- General Dynamics European Land Systems. (2025, September 8). Denmark to Become Latest M3 User Nation. https://www.gdels.com/en/media/news/denmark-to-become-latest-m3-user-nation-qkqr6336xtd8vl7nquyoggbv
- General Dynamics European Land Systems. (2025, October 30). GDELS to Provide Germany and the United Kingdom with New M3 Amphibious Bridging Capabilities. https://www.gdels.com/en/media/news/news-article-ve4zxa3st1z35yp13vudjbyv
- General Dynamics European Land Systems. (2025, December 1). Norway Orders M3 from GDELS. https://www.gdels.com/en/media/news/norway-orders-m3-from-gdels-vlrymcva6czmigg6i5w4kzco
- General Dynamics European Land Systems. (2026, November 4). Norway Receives First M3 from GDELS. https://www.gdels.com/en/media/news/norway-receives-first-m3-from-gdels-dj20bo35im5r970gnhbw4ztl
- Government of Canada, CanadaBuys. (2026, March 16). M1500-254787 Amphibious Vehicles: Contract History for Royal Canadian Mounted Police. https://canadabuys.canada.ca/en/tender-opportunities/contract-history/cw2442659-000
- Hanwha Aerospace. (2026, June 15). Hanwha Presents Field-Proven Defence Systems, K21 H-UGV, and European Partnerships at Eurosatory 2026. https://m.hanwhaaerospace.com/eng/media/newsroom/view.do?seq=636
- Hitachi Construction Machinery Asia and Pacific. (2025, February 28). Hitachi Construction Machinery Asia Pacific Unveils Amphibious Machines for Southeast Asia's Toughest Terrain. https://www.hitachicm.com/content/dam/hitachicm/sg/en/pdf-news/2025-/New%20Amphibious%20Machine%20introcude%20to%20the%20SEA%20markets.pdf
- Marsh Buggies Incorporated. (2026, January 12). Marsh Buggies and Amphibious Wetland Equipment Specifications. https://marshbuggies.com/marsh-equipment/
- Ministry for Ecological Transition, France. (2025, August 14). Ayons les bons reflexes face aux pluies intenses et inondations soudaines. https://www.ecologie.gouv.fr/pluie-et-inondation
- Ministry for the Armed Forces, France. (2025, June 17). Polaris 25: La capacite amphibie francaise en premiere ligne face aux defis de haute intensite. https://www.defense.gouv.fr/terre/actualites/polaris-25-capacite-amphibie-francaise-premiere-ligne-face-aux-defis-guerre-haute-intensite
- Ministry of National Defense of the People's Republic of China. (2026, May 22). Amphibious Armored Vehicles in Maritime Driving Training. https://eng.mod.gov.cn/2025xb/H_251589/F/16462806.html
- Ministry of National Defense of the People's Republic of China. (2026, July 25). Born for Beach Landing: Type-05 Amphibious Armored Vehicle Operations. https://eng.mod.gov.cn/2025xb/D/V/16475790.html
- Ministry of National Defense of the People's Republic of China. (2026, September 24). PLA Navy Marine Corps' Amphibious Elite Challenge Tournament Concludes. http://eng.mod.gov.cn/2025xb/D/V/16489025.html
- Ministry of National Defense of the People's Republic of China. (2026, October 30). Type 076 Amphibious Assault Ship Sichuan Maritime Testing Update. http://eng.mod.gov.cn/2025xb/N/T/16497228.html
- Rheinmetall AG. (2026, June 15). Eurosatory 2026: Fuchs Evolution and Fuchs JAGM Armored Transport Platform. https://www.rheinmetall.com/en/media/news-watch/news/2026/06/2026-06-15-rheinmetall-at-eurosatory-fuchs-jagm-next-generation-missile-tank-destroyer
- Rheinmetall AG. (2026, September 10). American Rheinmetall Delivers Mission Master SP Autonomous Amphibious Vehicles to the U.S. Marine Corps. https://www.rheinmetall.com/en/media/news-watch/news/2026/09/2026-09-10-american-rheinmetall-supplies-mission-master-to-the-us-marine-corps
- Secretaria de Marina, Mexico. (2025, October 9). Se mantiene activo el Plan Marina ante fenomenos meteorologicos en los litorales del Pacifico y el Golfo de Mexico. https://www.gob.mx/semar/prensa/se-mantiene-activo-el-plan-marina-ante-fenomenos-meteorologicos-que-prevalecen-en-los-litorales-del-pacifico-y-el-golfo-de-mexico?idiom=es
- SHERP. (2026, January 15). SHERP N 1200 Amphibious All-Terrain Utility Vehicle Technical Specifications. https://sherpglobal.com/en/sherp-n-1200-2/
- State Council of the People's Republic of China. (2026, January 6). China Further Strengthens Flood and Geological Disaster Rescue Forces in Northern Regions. https://english.www.gov.cn/news/202601/06/content_WS695cf54bc6d00ca5f9a086fb.html
- UK Ministry of Defence. (2025, October 30). Boost for British Armed Forces as UK and Germany Sign Major Contract for Next-Generation M3 EVO Bridging Equipment. https://www.gov.uk/government/news/boost-for-british-armed-forces-as-uk-and-germany-sign-major-contract-for-next-generation-bridging-equipment
- U.S. Government Accountability Office. (2026, March 15). Military Readiness: DOD Should Take Further Actions to Address Challenges Across the Air, Sea, Ground, and Space Domains (GAO-26-108888). https://files.gao.gov/reports/GAO-26-108888/index.html
- U.S. Government Accountability Office. (2026, July 10). Amphibious Warfare Fleet: Navy Maintenance and Readiness Implementation Update (GAO-25-106728). https://www.gao.gov/products/gao-25-106728
- U.S. Marine Corps Program Executive Officer Land Systems. (2025, August 15). Advanced Amphibious Assault: Delivery of 300th Amphibious Combat Vehicle in York, Pennsylvania. https://www.pae.marines.mil/Legacy-Content/Programs/Advanced-Amphibious-Assault/
- Wetland Equipment Company. (2026, January 10). Amphibious Excavators and Hydraulic Pontoon Undercarriages for Wet Terrains. https://wetlandequipment.com/amphibious-excavators
- Wilco Manufacturing L.L.C. (2026, January 14). Amphibious Excavator and Marsh Carrier Specifications. https://wilcomfg.com/amphibious-excavator/
Table of Content
- Key Takeaways
- Market Size and CAGR
- Top Growth Driver
- Fastest Growing Segment
- Leading Region
- Key Companies
- Emerging Opportunities
- Executive Summary
- Global Market Outlook
- Demand-side Trends
- Supply-side Trends
- Technology Roadmap Analysis
- Analysis and Recommendations
- Analyst Perspective (What is happening? Why now? What should investors know?)
- Key Questions Answered
- How large is the market?
- What is the CAGR?
- What are key trends?
- Which region dominates?
- Who are the leaders?
Read More...
- Market Overview
- Market Coverage / Taxonomy
- Market Definition / Scope / Limitations
- Research Methodology
- Chapter Orientation
- Analytical Lens and Working Hypotheses
- Market Structure, Signals, and Trend Drivers
- Benchmarking and Cross-market Comparability
- Market Sizing, Forecasting, and Opportunity Mapping
- Research Design and Evidence Framework
- Desk Research Programme (Secondary Evidence)
- Expert Input and Fieldwork (Primary Evidence)
- Tooling, Models, and Reference Databases
- Data Engineering and Model Build
- Quality Assurance and Audit Trail
- Market Background
- Market Dynamics (Drivers, Restraints, Opportunity, Trends)
- Scenario Forecast (Optimistic, Likely, Conservative)
- Impact Analysis
- AI Impact
- Sustainability Impact
- Regulatory Impact
- Technology Impact
- Consumer / Buyer Analysis
- Purchase Drivers
- Adoption Barriers
- Buyer Journey
- Opportunity Map Analysis
- Product Life Cycle Analysis
- Supply Chain Analysis
- Investment Feasibility Matrix
- Value Chain Analysis
- PESTLE and Porter's Analysis
- Regulatory Landscape
- Regional Parent Market Outlook
- Production and Consumption Statistics
- Import and Export Statistics
- Global Market Analysis and Forecast, 2021 to 2036
- Historical Market Size Value (USD Billion) Analysis, 2021 to 2025
- Current and Future Market Size Value (USD Billion) Projections, 2026 to 2036
- Y-o-Y Growth Trend Analysis
- Absolute $ Opportunity Analysis
- Global Market Pricing Analysis, 2021 to 2036
- Global Market Analysis and Forecast, By Propulsion, 2021 to 2036
- Introduction / Key Findings
- Historical Market Size Value (USD Billion) Analysis By Propulsion, 2021 to 2025
- Current and Future Market Size Value (USD Billion) Analysis and Forecast By Propulsion, 2026 to 2036
- Track-Based Propulsion
- Water Jet Propulsion
- Screw Propeller
- Y-o-Y Growth Trend Analysis By Propulsion, 2021 to 2025
- Absolute $ Opportunity Analysis By Propulsion, 2026 to 2036
- Global Market Analysis and Forecast, By Vehicle, 2021 to 2036
- Introduction / Key Findings
- Historical Market Size Value (USD Billion) Analysis By Vehicle, 2021 to 2025
- Current and Future Market Size Value (USD Billion) Analysis and Forecast By Vehicle, 2026 to 2036
- Armored Amphibious Vehicles
- Amphibious Excavators
- Light Amphibious Utility Vehicles
- Commercial Amphibious Transport
- Y-o-Y Growth Trend Analysis By Vehicle, 2021 to 2025
- Absolute $ Opportunity Analysis By Vehicle, 2026 to 2036
- Global Market Analysis and Forecast, By Application, 2021 to 2036
- Introduction / Key Findings
- Historical Market Size Value (USD Billion) Analysis By Application, 2021 to 2025
- Current and Future Market Size Value (USD Billion) Analysis and Forecast By Application, 2026 to 2036
- Military Combat & Troop Transport
- Disaster Response & Humanitarian Aid
- Construction & Dredging
- Commercial & Recreational Transport
- Y-o-Y Growth Trend Analysis By Application, 2021 to 2025
- Absolute $ Opportunity Analysis By Application, 2026 to 2036
- Global Market Analysis and Forecast, By End Use, 2021 to 2036
- Introduction / Key Findings
- Historical Market Size Value (USD Billion) Analysis By End Use, 2021 to 2025
- Current and Future Market Size Value (USD Billion) Analysis and Forecast By End Use, 2026 to 2036
- Defense Forces
- Disaster Management Agencies
- Construction & Dredging Contractors
- Tourism & Transport Operators
- Government Municipalities
- Y-o-Y Growth Trend Analysis By End Use, 2021 to 2025
- Absolute $ Opportunity Analysis By End Use, 2026 to 2036
- Global Market Analysis and Forecast, By Region, 2021 to 2036
- Introduction
- Historical Market Size Value (USD Billion) Analysis By Region, 2021 to 2025
- Current Market Size Value (USD Billion) Analysis and Forecast By Region, 2026 to 2036
- North America
- Western Europe
- East Asia
- South Asia and Pacific
- Market Attractiveness Analysis By Region
- North America Market Analysis and Forecast, By Country, 2021 to 2036
- Historical Market Size Value (USD Billion) Trend Analysis By Market Taxonomy, 2021 to 2025
- Market Size Value (USD Billion) Forecast By Market Taxonomy, 2026 to 2036
- By Country
- United States
- Canada
- By Propulsion
- By Vehicle
- By Application
- By End Use
- By Country
- Market Attractiveness Analysis
- By Country
- By Propulsion
- By Vehicle
- By Application
- By End Use
- Key Takeaways
- Western Europe Market Analysis and Forecast, By Country
- Historical Market Size Value (USD Billion) Trend Analysis By Market Taxonomy, 2021 to 2025
- Market Size Value (USD Billion) Forecast By Market Taxonomy, 2026 to 2036
- By Country
- United Kingdom
- Germany
- France
- By Propulsion
- By Vehicle
- By Application
- By End Use
- By Country
- Market Attractiveness Analysis
- By Country
- By Propulsion
- By Vehicle
- By Application
- By End Use
- Key Takeaways
- East Asia Market Analysis and Forecast, By Country
- Historical Market Size Value (USD Billion) Trend Analysis By Market Taxonomy, 2021 to 2025
- Market Size Value (USD Billion) Forecast By Market Taxonomy, 2026 to 2036
- By Country
- China
- Japan
- South Korea
- By Propulsion
- By Vehicle
- By Application
- By End Use
- By Country
- Market Attractiveness Analysis
- By Country
- By Propulsion
- By Vehicle
- By Application
- By End Use
- Key Takeaways
- South Asia and Pacific Market Analysis and Forecast, By Country
- Historical Market Size Value (USD Billion) Trend Analysis By Market Taxonomy, 2021 to 2025
- Market Size Value (USD Billion) Forecast By Market Taxonomy, 2026 to 2036
- By Country
- India
- Australia
- Rest of world aggregate
- By Propulsion
- By Vehicle
- By Application
- By End Use
- By Country
- Market Attractiveness Analysis
- By Country
- By Propulsion
- By Vehicle
- By Application
- By End Use
- Key Takeaways
- Key Countries Market Analysis
- United States
- Pricing Analysis
- Market Share Analysis, 2025
- By Propulsion
- By Vehicle
- By Application
- By End Use
- Canada
- Pricing Analysis
- Market Share Analysis, 2025
- By Propulsion
- By Vehicle
- By Application
- By End Use
- Germany
- Pricing Analysis
- Market Share Analysis, 2025
- By Propulsion
- By Vehicle
- By Application
- By End Use
- United Kingdom
- Pricing Analysis
- Market Share Analysis, 2025
- By Propulsion
- By Vehicle
- By Application
- By End Use
- France
- Pricing Analysis
- Market Share Analysis, 2025
- By Propulsion
- By Vehicle
- By Application
- By End Use
- India
- Pricing Analysis
- Market Share Analysis, 2025
- By Propulsion
- By Vehicle
- By Application
- By End Use
- China
- Pricing Analysis
- Market Share Analysis, 2025
- By Propulsion
- By Vehicle
- By Application
- By End Use
- Japan
- Pricing Analysis
- Market Share Analysis, 2025
- By Propulsion
- By Vehicle
- By Application
- By End Use
- South Korea
- Pricing Analysis
- Market Share Analysis, 2025
- By Propulsion
- By Vehicle
- By Application
- By End Use
- Australia
- Pricing Analysis
- Market Share Analysis, 2025
- By Propulsion
- By Vehicle
- By Application
- By End Use
- United States
- Market Structure Analysis
- Competition Dashboard
- Competition Benchmarking
- Market Share Analysis of Top Players
- By Regional
- By Propulsion
- By Vehicle
- By Application
- By End Use
- Emerging Startups
- Innovation Benchmarking
- Competition Analysis
- Competition Deep Dive
- BAE Systems plc
- Overview
- Product Portfolio
- Profitability by Market Segments
- Sales Footprint
- Strategy Overview
- Marketing Strategy
- Product Strategy
- Channel Strategy
- General Dynamics Corporation (GDELS)
- Rheinmetall AG
- Hanwha Aerospace
- Hitachi Construction Machinery Co., Ltd.
- Wetland Equipment Company
- Wilco Manufacturing L.L.C.
- Marsh Buggies Incorporated
- SHERP
- BAE Systems plc
- Case Studies
- Success Stories
- Recent Developments
- Competition Deep Dive
- Assumptions & Acronyms Used
List of Tables
- Table 1: Global Market Value (USD Billion) Forecast by Region, 2021 to 2036
- Table 2: Global Market Value (USD Billion) Forecast by Propulsion, 2021 to 2036
- Table 3: Global Market Value (USD Billion) Forecast by Vehicle, 2021 to 2036
- Table 4: Global Market Value (USD Billion) Forecast by Application, 2021 to 2036
- Table 5: Global Market Value (USD Billion) Forecast by End Use, 2021 to 2036
- Table 6: North America Market Value (USD Billion) Forecast by Country, 2021 to 2036
- Table 7: North America Market Value (USD Billion) Forecast by Propulsion, 2021 to 2036
- Table 8: North America Market Value (USD Billion) Forecast by Vehicle, 2021 to 2036
- Table 9: North America Market Value (USD Billion) Forecast by Application, 2021 to 2036
- Table 10: North America Market Value (USD Billion) Forecast by End Use, 2021 to 2036
- Table 11: Western Europe Market Value (USD Billion) Forecast by Country, 2021 to 2036
- Table 12: Western Europe Market Value (USD Billion) Forecast by Propulsion, 2021 to 2036
- Table 13: Western Europe Market Value (USD Billion) Forecast by Vehicle, 2021 to 2036
- Table 14: Western Europe Market Value (USD Billion) Forecast by Application, 2021 to 2036
- Table 15: Western Europe Market Value (USD Billion) Forecast by End Use, 2021 to 2036
- Table 16: East Asia Market Value (USD Billion) Forecast by Country, 2021 to 2036
- Table 17: East Asia Market Value (USD Billion) Forecast by Propulsion, 2021 to 2036
- Table 18: East Asia Market Value (USD Billion) Forecast by Vehicle, 2021 to 2036
- Table 19: East Asia Market Value (USD Billion) Forecast by Application, 2021 to 2036
- Table 20: East Asia Market Value (USD Billion) Forecast by End Use, 2021 to 2036
- Table 21: South Asia and Pacific Market Value (USD Billion) Forecast by Country, 2021 to 2036
- Table 22: South Asia and Pacific Market Value (USD Billion) Forecast by Propulsion, 2021 to 2036
- Table 23: South Asia and Pacific Market Value (USD Billion) Forecast by Vehicle, 2021 to 2036
- Table 24: South Asia and Pacific Market Value (USD Billion) Forecast by Application, 2021 to 2036
- Table 25: South Asia and Pacific Market Value (USD Billion) Forecast by End Use, 2021 to 2036
List of Figures
- Figure 1: Global Market Pricing Analysis
- Figure 2: Global Market Value (USD Billion) Forecast 2021-2036
- Figure 3: Global Market Value Share and BPS Analysis by Propulsion, 2026 and 2036
- Figure 4: Global Market Y-o-Y Growth Comparison by Propulsion, 2026-2036
- Figure 5: Global Market Attractiveness Analysis by Propulsion
- Figure 6: Global Market Value Share and BPS Analysis by Vehicle, 2026 and 2036
- Figure 7: Global Market Y-o-Y Growth Comparison by Vehicle, 2026-2036
- Figure 8: Global Market Attractiveness Analysis by Vehicle
- Figure 9: Global Market Value Share and BPS Analysis by Application, 2026 and 2036
- Figure 10: Global Market Y-o-Y Growth Comparison by Application, 2026-2036
- Figure 11: Global Market Attractiveness Analysis by Application
- Figure 12: Global Market Value Share and BPS Analysis by End Use, 2026 and 2036
- Figure 13: Global Market Y-o-Y Growth Comparison by End Use, 2026-2036
- Figure 14: Global Market Attractiveness Analysis by End Use
- Figure 15: Global Market Value (USD Billion) Share and BPS Analysis by Region, 2026 and 2036
- Figure 16: Global Market Y-o-Y Growth Comparison by Region, 2026-2036
- Figure 17: Global Market Attractiveness Analysis by Region
- Figure 18: North America Market Incremental Dollar Opportunity, 2026-2036
- Figure 19: Western Europe Market Incremental Dollar Opportunity, 2026-2036
- Figure 20: East Asia Market Incremental Dollar Opportunity, 2026-2036
- Figure 21: South Asia and Pacific Market Incremental Dollar Opportunity, 2026-2036
- Figure 22: North America Market Value Share and BPS Analysis by Country, 2026 and 2036
- Figure 23: North America Market Value Share and BPS Analysis by Propulsion, 2026 and 2036
- Figure 24: North America Market Y-o-Y Growth Comparison by Propulsion, 2026-2036
- Figure 25: North America Market Attractiveness Analysis by Propulsion
- Figure 26: North America Market Value Share and BPS Analysis by Vehicle, 2026 and 2036
- Figure 27: North America Market Y-o-Y Growth Comparison by Vehicle, 2026-2036
- Figure 28: North America Market Attractiveness Analysis by Vehicle
- Figure 29: North America Market Value Share and BPS Analysis by Application, 2026 and 2036
- Figure 30: North America Market Y-o-Y Growth Comparison by Application, 2026-2036
- Figure 31: North America Market Attractiveness Analysis by Application
- Figure 32: North America Market Value Share and BPS Analysis by End Use, 2026 and 2036
- Figure 33: North America Market Y-o-Y Growth Comparison by End Use, 2026-2036
- Figure 34: North America Market Attractiveness Analysis by End Use
- Figure 35: Western Europe Market Value Share and BPS Analysis by Country, 2026 and 2036
- Figure 36: Western Europe Market Value Share and BPS Analysis by Propulsion, 2026 and 2036
- Figure 37: Western Europe Market Y-o-Y Growth Comparison by Propulsion, 2026-2036
- Figure 38: Western Europe Market Attractiveness Analysis by Propulsion
- Figure 39: Western Europe Market Value Share and BPS Analysis by Vehicle, 2026 and 2036
- Figure 40: Western Europe Market Y-o-Y Growth Comparison by Vehicle, 2026-2036
- Figure 41: Western Europe Market Attractiveness Analysis by Vehicle
- Figure 42: Western Europe Market Value Share and BPS Analysis by Application, 2026 and 2036
- Figure 43: Western Europe Market Y-o-Y Growth Comparison by Application, 2026-2036
- Figure 44: Western Europe Market Attractiveness Analysis by Application
- Figure 45: Western Europe Market Value Share and BPS Analysis by End Use, 2026 and 2036
- Figure 46: Western Europe Market Y-o-Y Growth Comparison by End Use, 2026-2036
- Figure 47: Western Europe Market Attractiveness Analysis by End Use
- Figure 48: East Asia Market Value Share and BPS Analysis by Country, 2026 and 2036
- Figure 49: East Asia Market Value Share and BPS Analysis by Propulsion, 2026 and 2036
- Figure 50: East Asia Market Y-o-Y Growth Comparison by Propulsion, 2026-2036
- Figure 51: East Asia Market Attractiveness Analysis by Propulsion
- Figure 52: East Asia Market Value Share and BPS Analysis by Vehicle, 2026 and 2036
- Figure 53: East Asia Market Y-o-Y Growth Comparison by Vehicle, 2026-2036
- Figure 54: East Asia Market Attractiveness Analysis by Vehicle
- Figure 55: East Asia Market Value Share and BPS Analysis by Application, 2026 and 2036
- Figure 56: East Asia Market Y-o-Y Growth Comparison by Application, 2026-2036
- Figure 57: East Asia Market Attractiveness Analysis by Application
- Figure 58: East Asia Market Value Share and BPS Analysis by End Use, 2026 and 2036
- Figure 59: East Asia Market Y-o-Y Growth Comparison by End Use, 2026-2036
- Figure 60: East Asia Market Attractiveness Analysis by End Use
- Figure 61: South Asia and Pacific Market Value Share and BPS Analysis by Country, 2026 and 2036
- Figure 62: South Asia and Pacific Market Value Share and BPS Analysis by Propulsion, 2026 and 2036
- Figure 63: South Asia and Pacific Market Y-o-Y Growth Comparison by Propulsion, 2026-2036
- Figure 64: South Asia and Pacific Market Attractiveness Analysis by Propulsion
- Figure 65: South Asia and Pacific Market Value Share and BPS Analysis by Vehicle, 2026 and 2036
- Figure 66: South Asia and Pacific Market Y-o-Y Growth Comparison by Vehicle, 2026-2036
- Figure 67: South Asia and Pacific Market Attractiveness Analysis by Vehicle
- Figure 68: South Asia and Pacific Market Value Share and BPS Analysis by Application, 2026 and 2036
- Figure 69: South Asia and Pacific Market Y-o-Y Growth Comparison by Application, 2026-2036
- Figure 70: South Asia and Pacific Market Attractiveness Analysis by Application
- Figure 71: South Asia and Pacific Market Value Share and BPS Analysis by End Use, 2026 and 2036
- Figure 72: South Asia and Pacific Market Y-o-Y Growth Comparison by End Use, 2026-2036
- Figure 73: South Asia and Pacific Market Attractiveness Analysis by End Use
- Figure 74: Global Market - Tier Structure Analysis
- Figure 75: Global Market - Company Share Analysis
Frequently Asked Questions
How big is the amphibious vehicle market in 2026?
Future Market Insights estimates the global amphibious vehicle market valuation at USD 5.1 billion in 2026, advancing from USD 4.7 billion in 2025 across defense and civil platforms.
How fast is the amphibious vehicle market projected to grow through 2036?
FMI projects the global amphibious vehicle market to expand at an 8.8% CAGR from 2026 to 2036, reaching USD 11.8 billion by 2036 and generating USD 6.7 billion in incremental revenue.
Which Propulsion segment leads the amphibious vehicle market?
Track-Based Propulsion leads the amphibious vehicle market by Propulsion with a 49.0% share in 2026, driven by low-ground-pressure traction across mud and surf.
Which Vehicle segment holds the largest share of the amphibious vehicle market?
Armored Amphibious Vehicles lead the Vehicle category with a 42.0% revenue share in 2026, anchored by multi-year military ship-to-shore production contracts.
Which Application and End-Use segments lead the amphibious vehicle market?
Military Combat & Troop Transport segment leads Applications at 42.0% in 2026 (0%), while Defense Forces lead End Use at 38.0% (0%).
Which countries record the fastest growth in the amphibious vehicle market?
China leads national growth at a 9.9% CAGR from 2026 to 2036, followed by Mexico at 9.2% CAGR, France at 8.3% CAGR, the United States at 7.6% CAGR, and Canada at 7.5% CAGR.
Which companies are active players in the amphibious vehicle market?
Active players in the amphibious vehicle market include BAE Systems plc, General Dynamics Corporation (GDELS), Rheinmetall AG, Hanwha Aerospace, Hitachi Construction Machinery Co., Ltd., Wetland Equipment Company, Wilco Manufacturing L.L.C., Marsh Buggies Incorporated, and SHERP.
What operational factors restrain amphibious vehicle procurement?
Saltwater corrosion, hull seal inspection requirements, high depot maintenance costs, and seasonal project schedules among civil dredging contractors restrain faster fleet expansion.
Preview the report firsthand - request a free sample
Get SampleGet the brochure for pricing and purchase details.
Get PDF
