Anti-Puffiness Agents Market Size and Share Forecast Outlook 2025 to 2035

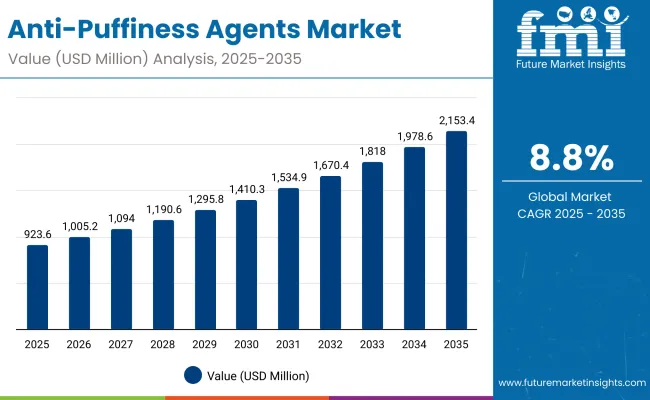
A valuation of USD 923.6 Million is anticipated for the Anti-Puffiness Agents Market in 2025, which is projected to reach USD 2,153.4 Million by 2035. This expansion of USD 1,229.8 Million represents an overall increase of 133% during the decade. A compound annual growth rate (CAGR) of 8.8% is projected, reflecting robust demand for raw materials that enhance efficacy and stability in eye-care formulations. The doubling of market size underscores the expected traction of advanced bioactive systems across both established and emerging regions.
Quick Stats for Anti-Puffiness Agents Market

  • Market Value (2025): USD 923.6 Million
  • Market Forecast Value (2035): USD 2,153.4 Million
  • Market Forecast CAGR (2025 to 2035): 8.8%
  • Leading Segment in 2025: Microcirculation boosters (41%)
  • Key Growth Regions: North America, East Asia, South Asia & Pacific, Europe
  • Top Key Players: Lipotec (Lubrizol), Givaudan, Mibelle Biochemistry, DSM-Firmenich, Ashland, Croda, Symrise, Clariant, Rahn, Seppic
Anti Puffiness Agents Market

Anti-Puffiness Agents Market Key Takeaways

Metric Value
Anti-Puffiness Agents Market Estimated Value in (2025E) USD 923.6 Million
Anti-Puffiness Agents Market Forecast Value in (2035F) USD 2,153.4 Million
Forecast CAGR (2025 to 2035) 8.80%

During the first half of the period, from 2025 to 2030, the market is expected to grow from USD 923.6 Million to USD 1,410.3 Million, adding USD 486.7 Million. This contribution represents nearly 40% of the total decade growth. Uptake is expected to be reinforced by premium skincare positioning, where microcirculation boosters are projected to dominate with a 41% share in 2025 due to their visible de-puffing effect. In parallel, peptide-based sources are anticipated to capture 38% of value share, showcasing the increasing reliance on clinically validated actives.

The second phase from 2030 to 2035 is projected to add USD 743.1 Million, equivalent to 60% of the total decade growth. This momentum is anticipated to be powered by advanced delivery technologies, with liposomal and vesicular systems leading at 47% share in 2025 and expected to widen penetration due to their superior stability and targeted deposition. Competitive advantages are expected to accrue to suppliers integrating bioactivity validation with scalable, regulatory-compliant production.

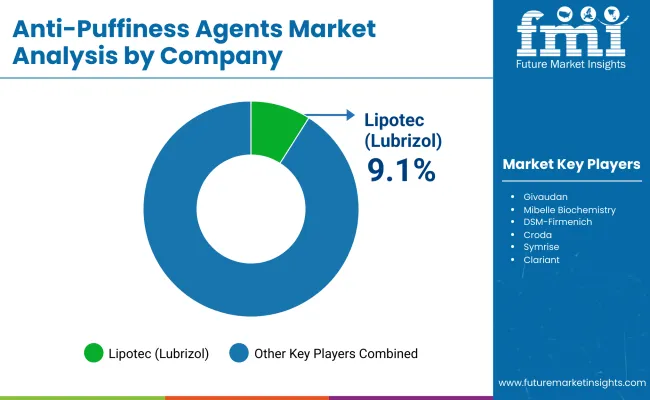
From 2025 to 2035, the market value is projected to more than double, driven by increasing reliance on clinically validated actives and advanced delivery systems. The competitive landscape is expected to remain fragmented, with leading suppliers controlling less than 10% share, while growth is anticipated to favor players integrating bioactive efficacy with scalable and regulatory-compliant production. Demand is expected to be reinforced in Asia-Pacific and North America, where both premium and dermocosmetic segments are projected to absorb high-value ingredients.

Why the Anti-Puffiness Agents Market is growing?

The growth of the Anti-Puffiness Agents Market is being driven by multiple scientific and consumer-focused dynamics. Rising demand for bioactive raw materials with proven efficacy is being observed as skincare brands increasingly emphasize evidence-backed claims. The adoption of microcirculation boosters and peptide-based actives is being favored, owing to their ability to deliver visible de-puffing effects and long-term skin benefits. Advanced delivery systems such as liposomal and vesicular carriers are being integrated more widely, as formulators seek improved stability, bioavailability, and targeted deposition. Growth is also being accelerated by premiumization trends in skincare, where consumer willingness to invest in dermocosmetic and clinically supported formulations is expanding. Demand across emerging economies is being reinforced by the rising middle class and increased focus on preventative skincare. With regulatory scrutiny intensifying, suppliers delivering transparent safety data and sustainable sourcing are expected to capture significant opportunities, ensuring the market sustains its robust trajectory.

Segmental Analysis

The Anti-Puffiness Agents Market is projected to expand significantly over the next decade, with its value expected to increase from USD 923.6 Mn in 2025 to USD 2,153.4 Mn by 2035. This growth, reflected in a CAGR of 8.8%, is anticipated to be driven by rising demand for high-performance ingredients that deliver visible under-eye decongestion and long-term skin benefits. Ingredient innovation is being prioritized around microcirculation boosters, peptide-based actives, and advanced encapsulation carriers, each offering differentiated efficacy and improved formulation stability. Global suppliers are expected to strengthen positions by providing clinically validated solutions, sustainable sourcing, and regulatory compliance. Growth momentum is anticipated across North America, East Asia, and South Asia, while premiumization and preventive skincare trends are projected to sustain robust uptake worldwide.
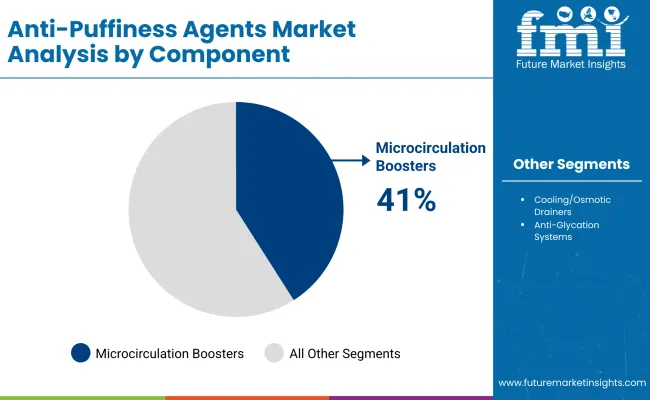
Insights into the Mode of Action Segment with Microcirculation Boosters Leading in Market Share

Anti Puffiness Agents Market By Component

Mode of Action Market Value Share, 2025
Microcirculation boosters 41%
Others 59.0%

Microcirculation boosters are expected to hold 41% of market share in 2025, positioning them as the leading mechanism in anti-puffiness formulations. Their dominance is being reinforced by growing clinical validation that demonstrates rapid improvements in under-eye circulation and visible reduction of puffiness. Demand is anticipated to be sustained by brands highlighting instant efficacy and long-term resilience, both of which resonate strongly with consumer expectations. Suppliers of microcirculation actives are projected to benefit from collaborations with skincare brands emphasizing scientifically backed claims. While other mechanisms, such as osmotic drainers and cooling modulators, retain a larger cumulative share, their adoption is expected to be more fragmented across applications. Over the decade, multi-pathway approaches are anticipated to gain traction, enhancing formulation versatility and broadening supplier opportunities.
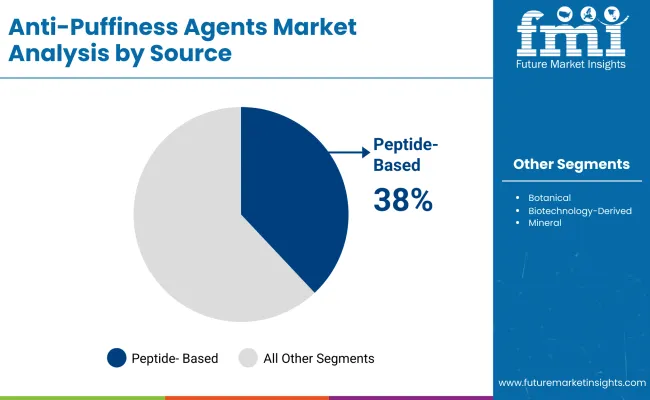
Insights into the Source Segment with Peptide-Based Ingredients Driving Value

Anti Puffiness Agents Market By Source

Source Market Value Share, 2025
Peptide-based 38%
Others 62.0%

Peptide-based actives are projected to represent 38% of ingredient sales in 2025, underscoring their critical role in the anti-puffiness landscape. Their growing importance is being driven by demand for highly targeted, scientifically validated ingredients that deliver measurable skin benefits. With peptides increasingly engineered for stability and penetration, formulators are expected to prioritize their inclusion in high-value dermocosmetic and premium skincare ranges. Rising consumer trust in peptide-driven performance claims is anticipated to further reinforce demand. Other sources, including botanical and biotechnology-derived actives, collectively hold a larger share; however, peptides are positioned to gain incremental adoption due to their versatility in multi-active formulations. Over the forecast period, investment in proprietary peptide sequences is expected to provide suppliers with strong differentiation and regulatory defensibility.
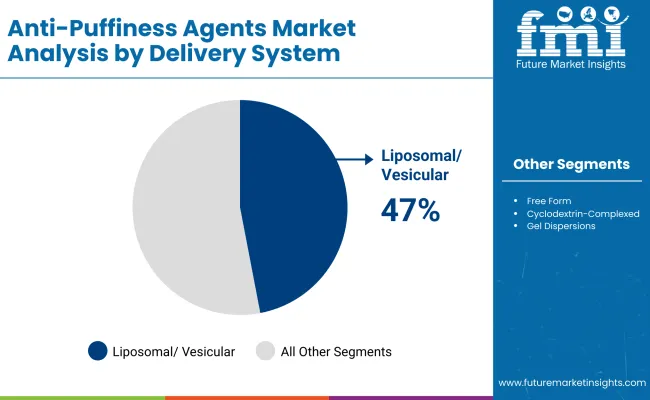
Insights into the Delivery System Segment with Liposomal/Vesicular Systems Taking the Lead

Anti Puffiness Agents Market By Delivery System

Delivery System Market Value Share, 2025
Liposomal/vesicular 47%
Others 53.0%

Liposomal and vesicular carriers are anticipated to dominate with a 47% share in 2025, reflecting their superior ability to stabilize actives and deliver targeted efficacy. Their role in enhancing ingredient penetration and reducing irritation is being increasingly emphasized by suppliers, making them the preferred choice for premium formulations. Growth in this segment is being accelerated by consumer demand for products that balance rapid visible results with long-term skin health. The reliance on such systems is projected to increase as complex peptide and bioactive formulations become mainstream. Other delivery systems, including free form and cyclodextrin complexes, continue to play a complementary role, especially in cost-sensitive markets. However, liposomal and vesicular technologies are expected to remain central to supplier innovation pipelines through 2035.

What are the Drivers, Restraints, and Key Trends of the Anti-Puffiness Agents Market?

Complex regulatory scrutiny and cost pressures are challenging ingredient suppliers, even as demand is being strengthened by clinical validation, advanced encapsulation systems, and bioactive innovation, ensuring the Anti-Puffiness Agents Market is positioned for transformative growth across dermocosmetic and premium skincare formulations.

Integration of Encapsulation with Multi-Active Formulations

Growth is being reinforced by the integration of encapsulation systems that enable multiple actives to be delivered in a single formulation. This advancement is allowing brands to position anti-puffiness products as multifunctional solutions, addressing hydration, firmness, and irritation simultaneously. Suppliers incorporating liposomal and vesicular carriers are expected to capture higher-value partnerships with skincare brands, as these systems not only stabilize sensitive peptides but also ensure compatibility with botanical or biotechnological actives. Such multifunctional ingredient platforms are anticipated to become a decisive driver of long-term adoption, particularly in premium and dermocosmetic lines where clinical transparency and visible results remain non-negotiable.

Shift Toward Regulatory-Ready Transparency in Bioactives

A pronounced trend is being observed toward regulatory-ready ingredient portfolios, where suppliers proactively present dossiers aligned with evolving cosmetic regulations in the EU, USA, and Asia-Pacific. This shift is enabling faster adoption by global skincare brands that increasingly seek de-risked innovation pipelines. Beyond safety compliance, transparent data on irritation thresholds, allergen profiles, and environmental impact is being packaged with marketing claims, ensuring trust across both B2B partners and end consumers. The ability to combine efficacy-driven innovation with clear regulatory defensibility is expected to separate leaders from laggards, establishing a trend where ingredient credibility outweighs cost advantages in securing long-term contracts.
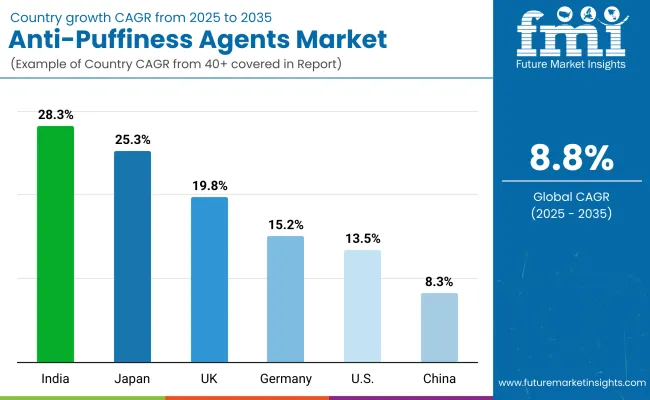
Analysis of Anti-Puffiness Agents Market By Key Countries

Anti Puffiness Agents Market By Country

Country CAGR
China 8.3%
USA 13.5%
India 28.3%
UK 19.8%
Germany 15.2%
Japan 25.3%

The Anti-Puffiness Agents Market is expected to display significant variation in growth across leading countries, shaped by consumer awareness, regulatory frameworks, and brand strategies. India is projected to lead with a CAGR of 28.3% between 2025 and 2035, as rising disposable income and a young demographic accelerate adoption of active ingredients in skincare formulations. Japan follows with a CAGR of 25.3%, where demand is anticipated to be fueled by sensitive-skin positioning, high-quality dermocosmetic innovation, and preference for advanced delivery systems. The UK and Germany are also expected to perform strongly, registering growth rates of 19.8% and 15.2% respectively, underpinned by strict safety standards and the rising influence of dermatology-driven claims in European markets.

In North America, the USA is forecast to grow at 13.5% CAGR, supported by the maturity of dermocosmetic channels and robust demand for clinically validated peptide-based actives. China, although growing at a slower CAGR of 8.3%, is expected to retain its strategic significance due to its scale, dominance in raw material sourcing, and rising consumer shift toward efficacy-first formulations. Europe overall is anticipated to maintain a balanced trajectory at 13.5%, with premium brands and compliance-driven formulations sustaining steady growth.

Sales Outlook for Anti-Puffiness Agents in the United States

Year USA Anti-Puffiness Agents Market (USD Million)
2025 166.59
2026 180.08
2027 194.67
2028 210.44
2029 227.49
2030 245.92
2031 265.84
2032 287.38
2033 310.66
2034 335.83
2035 363.04

The Anti-Puffiness Agents Market in the United States is projected to grow at a CAGR of 8.6% between 2025 and 2035. This growth trajectory is being reinforced by strong consumer preference for clinically validated actives and rising demand for multifunctional formulations within the dermocosmetic and premium skincare categories. Ingredient suppliers are expected to benefit from investments in peptide innovation, encapsulation carriers, and transparent claim substantiation that align with FDA-driven safety requirements.

A gradual shift toward multifunctional eye-care systems is anticipated, creating opportunities for suppliers to integrate anti-puffiness actives with hydration and anti-aging benefits. Clinical dermatology channels are projected to remain central to adoption, while premium skincare brands are expected to drive incremental sourcing of high-value actives.

  • Clinical dermatology is expected to sustain ingredient demand, where safety and efficacy are prioritized.
  • Encapsulation technologies are projected to provide differentiation by enhancing performance and bioavailability of sensitive peptides.
  • Strategic collaborations between USA-based skincare brands and global suppliers are anticipated to reinforce innovation pipelines and accelerate market penetration.

Growth and Expansion Outlook for Anti-Puffiness Agents Market in the United Kingdom

The Anti-Puffiness Agents Market in the United Kingdom is projected to grow at a CAGR of 19.8% between 2025 and 2035. This strong momentum is anticipated to be supported by premium skincare adoption, rising consumer inclination toward dermocosmetic solutions, and the influence of clinical claim substantiation. Ingredient suppliers are expected to benefit from partnerships with dermatologists and retail-led premium skincare chains, which remain influential in consumer decision-making. Formulation demand is likely to focus on peptides and liposomal carriers, as transparency and high efficacy continue to be prioritized.

  • Demand is expected to be reinforced by clinical skincare endorsements and compliance with EU and UK safety standards.
  • Premiumization is anticipated to drive the sourcing of advanced delivery systems for visible, fast-acting results.
  • Digital engagement and social-commerce platforms are projected to enhance consumer awareness of ingredient-backed efficacy.
  • Supplier differentiation is expected to favor portfolios with clear regulatory and sustainability positioning.

Growth and Expansion Outlook for Anti-Puffiness Agents Market in India

The Anti-Puffiness Agents Market in India is forecast to expand at a CAGR of 28.3% from 2025 to 2035, the highest among leading countries. Growth is anticipated to be powered by rapid urbanization, rising disposable income, and increasing focus on preventative skincare routines. Ingredient demand is expected to be centered on affordable yet clinically credible bioactives, with peptide adoption projected to accelerate as premium skincare gains traction. International suppliers are likely to expand through local partnerships, ensuring compliance with evolving regulatory requirements and maintaining affordability in mass-premium categories.

  • Rising middle-class consumption is expected to fuel greater penetration of anti-puffiness actives into daily skincare.
  • Local production and ingredient blending are projected to create cost-competitive supply chains.
  • Education-led marketing is expected to enhance consumer trust in peptide and encapsulation technologies.
  • Strategic collaborations with Indian skincare brands are likely to fast-track adoption in domestic and export markets.

Sales Outlook for Anti-Puffiness Agents in China

The Anti-Puffiness Agents Market in China is projected to record a CAGR of 8.3% between 2025 and 2035. Although slower than other Asian peers, growth is expected to be anchored in the scale of the domestic skincare sector and the consumer shift toward efficacy-first formulations. Ingredient sourcing is likely to remain diversified, with strong adoption of “other source” actives, while peptides are expected to steadily gain share as clinical storytelling becomes mainstream. The competitive environment is anticipated to favor suppliers aligning with local regulations and digital-first sales ecosystems.
  • Market expansion is expected to be shaped by strong e-commerce platforms emphasizing efficacy-based marketing.
  • Local suppliers are anticipated to capture share through cost-competitive and fast-scaled formulations.
  • Peptides are projected to advance steadily, gaining consumer trust through visible benefits and domestic innovation.
  • Compliance with China’s cosmetic ingredient filing requirements is expected to define supplier credibility.

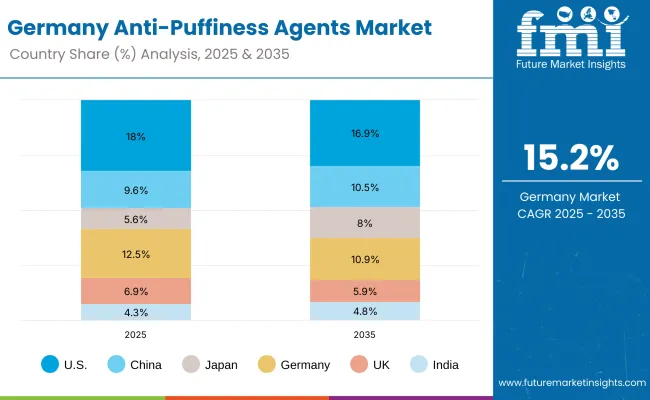
In-depth Analysis of Anti-Puffiness Agents in Germany

Germany Anti Puffiness Agents Market

Country 2025
USA 18.0%
China 9.6%
Japan 5.6%
Germany 12.5%
UK 6.9%
India 4.3%
Country 2035
USA 16.9%
China 10.5%
Japan 8.0%
Germany 10.9%
UK 5.9%
India 4.8%

The Anti-Puffiness Agents Market in Germany is expected to expand at a CAGR of 15.2% between 2025 and 2035. Growth is anticipated to be reinforced by strict quality compliance, the rise of dermocosmetic positioning, and consumer trust in dermatologist-led formulations. Suppliers delivering clinically validated, irritation-minimized ingredients are likely to secure preference within German markets. Encapsulation and liposomal systems are expected to attract high demand, as efficacy, stability, and safety remain central purchasing criteria.
  • Dermocosmetic formulations are expected to drive consistent ingredient demand, supported by strong pharmacy-led distribution.
  • Regulatory compliance under EU frameworks is projected to provide an advantage for suppliers offering detailed dossiers.
  • Preference for sensitive-skin-compatible actives is expected to shape formulation innovation.
  • Supplier collaboration with European brands is likely to enhance market penetration through science-backed marketing campaigns.

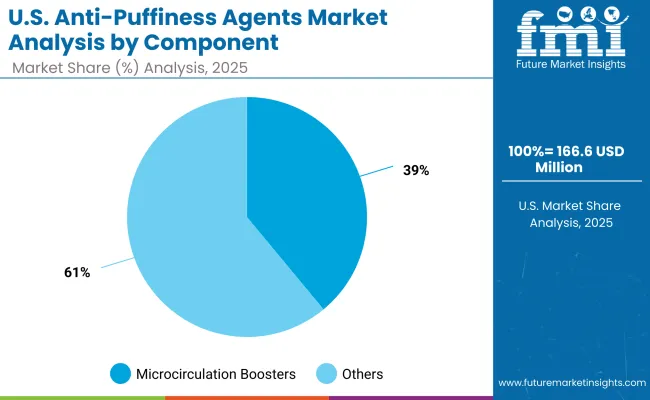
Growth Outlook for Anti-Puffiness Agents Market in USA

Anti Puffiness Agents Market United States

USA by Mode of Action Market Value Share, 2025
Microcirculation boosters 39%
Others 61.0%

The Anti-Puffiness Agents Market in the United States is projected at USD 166.6 million in 2025. Microcirculation boosters contribute 39%, while other mechanisms account for 61%, indicating a broader reliance on multi-pathway approaches to address under-eye puffiness. This distribution reflects the emphasis on efficacy diversification, where microcirculation is valued for its rapid visible impact, but complementary mechanisms ensure sustained results and consumer satisfaction. Formulators are expected to combine these pathways, creating multi-functional ingredient blends that align with clinical claims demanded in the USA market. The ability of suppliers to deliver proven efficacy across both immediate and long-term endpoints is anticipated to shape competitive positioning. Clinical dermatology and premium skincare are projected to be primary adoption channels, reinforcing the need for robust data packages.
  • The USA market is projected at USD 166.6 Mn in 2025 within global sales.
  • Microcirculation boosters account for 39% share, highlighting their visible-effect appeal.
  • Other mechanisms dominate at 61%, emphasizing multifunctional adoption.
  • Competitive advantage is expected for suppliers presenting transparent clinical validation and safety.

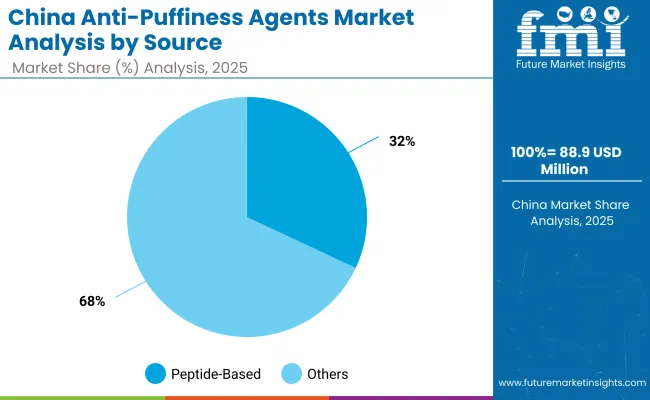
Opportunity Analysis of China Anti-Puffiness Agents Market

China Anti Puffiness Agents Market

China by source Market Value Share, 2025
Peptide-based 32%
Others 68.0%

The Anti-Puffiness Agents Market in China is projected at USD 88.9 million in 2025. Peptide-based actives contribute 32%, while other sources account for 68%, reflecting a market still dominated by broad-spectrum botanical and biotechnology-driven actives. Peptide adoption, however, is expected to accelerate as consumer demand for clinically supported and efficacy-focused formulations expands. International suppliers introducing proprietary peptide sequences are likely to benefit from growing brand emphasis on transparency, performance, and advanced delivery technologies. Meanwhile, cost competitiveness and scalability will continue to favor diversified sources, ensuring wide application across both mass-market and premium product lines. This dual sourcing structure is anticipated to define competitive dynamics, where brands balance affordability with innovation-led differentiation.
  • The Chinese market is estimated at USD 88.9 Mn in 2025.
  • Peptide-based actives hold 32% share, supported by rising clinical validation.
  • Other sources dominate with 68%, driven by cost-effective scaling and local supplier strength.
  • Competitive growth is expected through alignment with regulatory frameworks and e-commerce-driven ingredient storytelling.

Competitive Landscape of Anti-Puffiness Agents Market

Anti Puffiness Agents Market By Comapny

Company Global Value Share 2025
Lipotec (Lubrizol) 9.1%
Others 90.9%

The Anti-Puffiness Agents Market is moderately fragmented, with global ingredient leaders, mid-sized innovators, and niche specialists competing across diverse formulation needs. Global leaders such as Lipotec (Lubrizol) hold significant positions, driven by patented peptide technologies, advanced delivery systems, and longstanding partnerships with premium skincare and dermocosmetic brands. Their strategies are increasingly focused on clinical substantiation, encapsulation platforms, and scalable production processes that align with evolving regulatory standards.

Mid-sized innovators, including companies such as Givaudan, Mibelle Biochemistry, DSM-Firmenich, and Ashland, are building competitive strength through proprietary bioactives, multifunctional blends, and sustainability-focused portfolios. Their adoption is expected to rise as dermocosmetic players seek proven efficacy combined with clean-label and eco-compliant formulations.

Specialist suppliers such as Croda, Symrise, Clariant, Rahn, and Seppic are emphasizing differentiated technologies, ranging from botanical extractions to encapsulation carriers. Their strength lies in customization, flexible manufacturing, and regional adaptability, enabling them to serve diverse brand strategies across both mass-market and premium product lines.

Competitive differentiation is shifting away from single-function actives toward integrated portfolios where peptides, botanicals, and advanced carriers are combined to deliver multi-benefit outcomes. Suppliers demonstrating robust clinical validation, transparent safety data, and sustainable sourcing practices are expected to capture long-term partnerships and global scale.

Key Developments in Anti-Puffiness Agents Market

  • On May 7, 2025, DSM-Firmenich expanded its peptide portfolio for anti-puffiness formulations with a clinically validated bioactive launched at the In-Cosmetics Global event in Paris. The ingredient was positioned to enhance microcirculation and under-eye decongestion, reinforcing DSM-Firmenich’s role as a global leader in dermocosmetic actives.
  • On June 18, 2025, Givaudan Active Beauty introduced a liposomal delivery system optimized for sensitive eye-area actives. The innovation was unveiled in Shanghai, highlighting improved peptide stability and penetration. The launch was described as a milestone for enhancing efficacy in anti-puffiness ingredients while supporting sustainable formulation practices.

Scope of the Report

Item Value
Quantitative Value USD 923.6 Million (2025E); USD 2,153.4 Million (2035F); CAGR 8.8% (2025–2035)
Component (Ingredient Classes) Microcirculation boosters; Cooling/osmotic drainers; Anti-glycation systems
Source Peptide-based; Botanical; Biotechnology-derived; Mineral
Delivery System Liposomal/vesicular; Free form; Cyclodextrin-complexed; Gel dispersions
Physical Form Solution/concentrate; Powder
End Use Eye care within skincare; Dermocosmetic
Applications Eye serums; Eye creams; Eye patches & masks; Roll-ons
Regions Covered North America; Europe; East Asia; South Asia & Pacific; Latin America; Middle East & Africa
Countries Covered United States; China; Japan; India; Germany; United Kingdom
Key Companies Profiled Lipotec (Lubrizol); Givaudan; Mibelle Biochemistry; DSM-Firmenich; Ashland; Croda; Symrise; Clariant; Rahn; Seppic
Additional Attributes 2025 leading shares: Microcirculation boosters 41% (USD 588.9 Mn); Peptide-based 38% (USD 369 Mn); Liposomal/vesicular 47% (USD 533.3 Mn). USA value path: USD 166.59 Mn (2025) → USD 363.04 Mn (2035). Country CAGRs: India 28.3%, Japan 25.3%, UK 19.8%, Germany 15.2%, USA 13.5%, Europe 13.5%, China 8.3%.

Key Segments

By Mode of Action:

  • Microcirculation boosters
  • Decongestant/osmotic drainers
  • Cooling sensory modulators
  • Anti-glycation systems

By Source:

  • Botanical
  • Peptide-based
  • Biotechnology-derived
  • Mineral

By Delivery System:

  • Free form
  • Liposomal/vesicular
  • Cyclodextrin-complexed
  • Gel dispersions

By Physical Form:

  • Solution/concentrate
  • Powder

By Region:

  • North America
  • Latin America
  • Europe
  • East Asia
  • South Asia & Pacific
  • Middle East and Africa

Frequently Asked Questions

How big is the Anti-Puffiness Agents Market in 2025?

The global Anti-Puffiness Agents Market is estimated to be valued at USD 923.6 Million in 2025.

What will be the size of the Anti-Puffiness Agents Market in 2035?

The market size for the Anti-Puffiness Agents Market is projected to reach USD 2,153.4 Million by 2035.

How much will be the Anti-Puffiness Agents Market growth between 2025 and 2035?

The Anti-Puffiness Agents Market is expected to grow at a CAGR of 8.8% between 2025 and 2035.

What are the key ingredient types in the Anti-Puffiness Agents Market?

The key ingredient types in the Anti-Puffiness Agents Market are microcirculation boosters, cooling/osmotic drainers, anti-glycation systems, and others.

Which delivery system segment will contribute significant share in the Anti-Puffiness Agents Market in 2025?

In terms of delivery systems, the liposomal/vesicular segment is expected to command 47% share in the Anti-Puffiness Agents Market in 2025.

Table of Content

  1. Executive Summary
    • Global Market Outlook
    • Demand-side Trends
    • Supply-side Trends
    • Technology Roadmap Analysis
    • Analysis and Recommendations
  2. Market Overview
    • Market Coverage / Taxonomy
    • Market Definition / Scope / Limitations
  3. Market Background
    • Market Dynamics
      • Drivers
      • Restraints
      • Opportunity
      • Trends
    • Scenario Forecast
      • Demand in Optimistic Scenario
      • Demand in Likely Scenario
      • Demand in Conservative Scenario
    • Opportunity Map Analysis
    • Product Life Cycle Analysis
    • Supply Chain Analysis
      • Supply Side Participants and their Roles
        • Producers
        • Mid-Level Participants (Traders/ Agents/ Brokers)
        • Wholesalers and Distributors
      • Value Added and Value Created at Node in the Supply Chain
      • List of Raw Material Suppliers
      • List of Existing and Potential Buyer’s
    • Investment Feasibility Matrix
    • Value Chain Analysis
      • Profit Margin Analysis
      • Wholesalers and Distributors
      • Retailers
    • PESTLE and Porter’s Analysis
    • Regulatory Landscape
      • By Key Regions
      • By Key Countries
    • Regional Parent Market Outlook
    • Production and Consumption Statistics
    • Import and Export Statistics
  4. Global Market Analysis 2020 to 2024 and Forecast, 2025 to 2035
    • Historical Market Size Value (USD Million) & Volume (Units) Analysis, 2020 to 2024
    • Current and Future Market Size Value (USD Million) & Volume (Units) Projections, 2025 to 2035
      • Y-o-Y Growth Trend Analysis
      • Absolute $ Opportunity Analysis
  5. Global Market Analysis 2020 to 2024 and Forecast 2025 to 2035, By Mode of Action
    • Introduction / Key Findings
    • Historical Market Size Value (USD Million) & Volume (Units) Analysis By Mode of Action, 2020 to 2024
    • Current and Future Market Size Value (USD Million) & Volume (Units) Analysis and Forecast By Mode of Action, 2025 to 2035
      • Microcirculation boosters
      • Decongestant/osmotic drainers
      • Cooling sensory modulators
      • Anti-glycation systems
    • Y-o-Y Growth Trend Analysis By Mode of Action, 2020 to 2024
    • Absolute $ Opportunity Analysis By Mode of Action, 2025 to 2035
  6. Global Market Analysis 2020 to 2024 and Forecast 2025 to 2035, By Source
    • Introduction / Key Findings
    • Historical Market Size Value (USD Million) & Volume (Units) Analysis By Source, 2020 to 2024
    • Current and Future Market Size Value (USD Million) & Volume (Units) Analysis and Forecast By Source, 2025 to 2035
      • Botanical
      • Peptide-based
      • Biotechnology-derived
      • Mineral
    • Y-o-Y Growth Trend Analysis By Source, 2020 to 2024
    • Absolute $ Opportunity Analysis By Source, 2025 to 2035
  7. Global Market Analysis 2020 to 2024 and Forecast 2025 to 2035, By Delivery System
    • Introduction / Key Findings
    • Historical Market Size Value (USD Million) & Volume (Units) Analysis By Delivery System, 2020 to 2024
    • Current and Future Market Size Value (USD Million) & Volume (Units) Analysis and Forecast By Delivery System, 2025 to 2035
      • Free form
      • Liposomal/vesicular
      • Cyclodextrin-complexed
      • Gel dispersions
    • Y-o-Y Growth Trend Analysis By Delivery System, 2020 to 2024
    • Absolute $ Opportunity Analysis By Delivery System, 2025 to 2035
  8. Global Market Analysis 2020 to 2024 and Forecast 2025 to 2035, By Physical Form
    • Introduction / Key Findings
    • Historical Market Size Value (USD Million) & Volume (Units) Analysis By Physical Form, 2020 to 2024
    • Current and Future Market Size Value (USD Million) & Volume (Units) Analysis and Forecast By Physical Form, 2025 to 2035
      • Solution/concentrate
      • Powder
    • Y-o-Y Growth Trend Analysis By Physical Form, 2020 to 2024
    • Absolute $ Opportunity Analysis By Physical Form, 2025 to 2035
  9. Global Market Analysis 2020 to 2024 and Forecast 2025 to 2035, By Application
    • Introduction / Key Findings
    • Historical Market Size Value (USD Million) & Volume (Units) Analysis By Application, 2020 to 2024
    • Current and Future Market Size Value (USD Million) & Volume (Units) Analysis and Forecast By Application, 2025 to 2035
      • Eye serums
      • Eye creams
      • Eye patches & masks
      • Roll-ons
    • Y-o-Y Growth Trend Analysis By Application, 2020 to 2024
    • Absolute $ Opportunity Analysis By Application, 2025 to 2035
  10. Global Market Analysis 2020 to 2024 and Forecast 2025 to 2035, By End Use
    • Introduction / Key Findings
    • Historical Market Size Value (USD Million) & Volume (Units) Analysis By End Use, 2020 to 2024
    • Current and Future Market Size Value (USD Million) & Volume (Units) Analysis and Forecast By End Use, 2025 to 2035
      • Eye care within skincare
      • Dermocosmetic
    • Y-o-Y Growth Trend Analysis By End Use, 2020 to 2024
    • Absolute $ Opportunity Analysis By End Use, 2025 to 2035
  11. Global Market Analysis 2020 to 2024 and Forecast 2025 to 2035, By Region
    • Introduction
    • Historical Market Size Value (USD Million) & Volume (Units) Analysis By Region, 2020 to 2024
    • Current Market Size Value (USD Million) & Volume (Units) Analysis and Forecast By Region, 2025 to 2035
      • North America
      • Latin America
      • Europe
      • East Asia
      • South Asia & Pacific
      • Middle East and Africa
    • Market Attractiveness Analysis By Region
  12. North America Market Analysis 2020 to 2024 and Forecast 2025 to 2035, By Country
    • Historical Market Size Value (USD Million) & Volume (Units) Trend Analysis By Market Taxonomy, 2020 to 2024
    • Market Size Value (USD Million) & Volume (Units) Forecast By Market Taxonomy, 2025 to 2035
      • By Country
        • USA
        • Canada
      • By Mode of Action
      • By Source
      • By Delivery System
      • By Physical Form
      • By Application
      • By End Use
    • Market Attractiveness Analysis
      • By Country
      • By Mode of Action
      • By Source
      • By Delivery System
      • By Physical Form
      • By Application
      • By End Use
    • Key Takeaways
  13. Latin America Market Analysis 2020 to 2024 and Forecast 2025 to 2035, By Country
    • Historical Market Size Value (USD Million) & Volume (Units) Trend Analysis By Market Taxonomy, 2020 to 2024
    • Market Size Value (USD Million) & Volume (Units) Forecast By Market Taxonomy, 2025 to 2035
      • By Country
        • Brazil
        • Mexico
        • Colombia
        • Rest of Latin America
      • By Mode of Action
      • By Source
      • By Delivery System
      • By Physical Form
      • By Application
      • By End Use
    • Market Attractiveness Analysis
      • By Country
      • By Mode of Action
      • By Source
      • By Delivery System
      • By Physical Form
      • By Application
      • By End Use
    • Key Takeaways
  14. Europe Market Analysis 2020 to 2024 and Forecast 2025 to 2035, By Country
    • Historical Market Size Value (USD Million) & Volume (Units) Trend Analysis By Market Taxonomy, 2020 to 2024
    • Market Size Value (USD Million) & Volume (Units) Forecast By Market Taxonomy, 2025 to 2035
      • By Country
        • Germany
        • UK
        • France
        • Italy
        • Spain
        • Belgium
        • Netherlands
        • Nordic
        • Switzerland
        • Russia
        • Poland
        • Rest of Europe
      • By Mode of Action
      • By Source
      • By Delivery System
      • By Physical Form
      • By Application
      • By End Use
    • Market Attractiveness Analysis
      • By Country
      • By Mode of Action
      • By Source
      • By Delivery System
      • By Physical Form
      • By Application
      • By End Use
    • Key Takeaways
  15. East Asia Market Analysis 2020 to 2024 and Forecast 2025 to 2035, By Country
    • Historical Market Size Value (USD Million) & Volume (Units) Trend Analysis By Market Taxonomy, 2020 to 2024
    • Market Size Value (USD Million) & Volume (Units) Forecast By Market Taxonomy, 2025 to 2035
      • By Country
        • China
        • Japan
        • South Korea
      • By Mode of Action
      • By Source
      • By Delivery System
      • By Physical Form
      • By Application
      • By End Use
    • Market Attractiveness Analysis
      • By Country
      • By Mode of Action
      • By Source
      • By Delivery System
      • By Physical Form
      • By Application
      • By End Use
    • Key Takeaways
  16. South Asia & Pacific Market Analysis 2020 to 2024 and Forecast 2025 to 2035, By Country
    • Historical Market Size Value (USD Million) & Volume (Units) Trend Analysis By Market Taxonomy, 2020 to 2024
    • Market Size Value (USD Million) & Volume (Units) Forecast By Market Taxonomy, 2025 to 2035
      • By Country
        • India
        • Thailand
        • Malaysia
        • Indonesia
        • Singapore
        • Vietnam
        • Australia
        • New Zealand
        • Rest of South Asia
      • By Mode of Action
      • By Source
      • By Delivery System
      • By Physical Form
      • By Application
      • By End Use
    • Market Attractiveness Analysis
      • By Country
      • By Mode of Action
      • By Source
      • By Delivery System
      • By Physical Form
      • By Application
      • By End Use
    • Key Takeaways
  17. Middle East and Africa Market Analysis 2020 to 2024 and Forecast 2025 to 2035, By Country
    • Historical Market Size Value (USD Million) & Volume (Units) Trend Analysis By Market Taxonomy, 2020 to 2024
    • Market Size Value (USD Million) & Volume (Units) Forecast By Market Taxonomy, 2025 to 2035
      • By Country
        • Turkey
        • UAE
        • Saudi Arabia
        • Israel
        • Other GCC Countries
        • North Africa
        • South Africa
      • By Mode of Action
      • By Source
      • By Delivery System
      • By Physical Form
      • By Application
      • By End Use
    • Market Attractiveness Analysis
      • By Country
      • By Mode of Action
      • By Source
      • By Delivery System
      • By Physical Form
      • By Application
      • By End Use
    • Key Takeaways
  18. Key Countries Market Analysis
    • USA
      • Pricing Analysis
      • Market Share Analysis, 2024
        • By Mode of Action
        • By Source
        • By Delivery System
        • By Physical Form
        • By Application
        • By End Use
    • Canada
      • Pricing Analysis
      • Market Share Analysis, 2024
        • By Mode of Action
        • By Source
        • By Delivery System
        • By Physical Form
        • By Application
        • By End Use
    • Brazil
      • Pricing Analysis
      • Market Share Analysis, 2024
        • By Mode of Action
        • By Source
        • By Delivery System
        • By Physical Form
        • By Application
        • By End Use
    • Mexico
      • Pricing Analysis
      • Market Share Analysis, 2024
        • By Mode of Action
        • By Source
        • By Delivery System
        • By Physical Form
        • By Application
        • By End Use
    • Colombia
      • Pricing Analysis
      • Market Share Analysis, 2024
        • By Mode of Action
        • By Source
        • By Delivery System
        • By Physical Form
        • By Application
        • By End Use
    • Germany
      • Pricing Analysis
      • Market Share Analysis, 2024
        • By Mode of Action
        • By Source
        • By Delivery System
        • By Physical Form
        • By Application
        • By End Use
    • UK
      • Pricing Analysis
      • Market Share Analysis, 2024
        • By Mode of Action
        • By Source
        • By Delivery System
        • By Physical Form
        • By Application
        • By End Use
    • France
      • Pricing Analysis
      • Market Share Analysis, 2024
        • By Mode of Action
        • By Source
        • By Delivery System
        • By Physical Form
        • By Application
        • By End Use
    • Italy
      • Pricing Analysis
      • Market Share Analysis, 2024
        • By Mode of Action
        • By Source
        • By Delivery System
        • By Physical Form
        • By Application
        • By End Use
    • Spain
      • Pricing Analysis
      • Market Share Analysis, 2024
        • By Mode of Action
        • By Source
        • By Delivery System
        • By Physical Form
        • By Application
        • By End Use
    • Belgium
      • Pricing Analysis
      • Market Share Analysis, 2024
        • By Mode of Action
        • By Source
        • By Delivery System
        • By Physical Form
        • By Application
        • By End Use
    • Netherlands
      • Pricing Analysis
      • Market Share Analysis, 2024
        • By Mode of Action
        • By Source
        • By Delivery System
        • By Physical Form
        • By Application
        • By End Use
    • Nordic
      • Pricing Analysis
      • Market Share Analysis, 2024
        • By Mode of Action
        • By Source
        • By Delivery System
        • By Physical Form
        • By Application
        • By End Use
    • Switzerland
      • Pricing Analysis
      • Market Share Analysis, 2024
        • By Mode of Action
        • By Source
        • By Delivery System
        • By Physical Form
        • By Application
        • By End Use
    • Russia
      • Pricing Analysis
      • Market Share Analysis, 2024
        • By Mode of Action
        • By Source
        • By Delivery System
        • By Physical Form
        • By Application
        • By End Use
    • Poland
      • Pricing Analysis
      • Market Share Analysis, 2024
        • By Mode of Action
        • By Source
        • By Delivery System
        • By Physical Form
        • By Application
        • By End Use
    • China
      • Pricing Analysis
      • Market Share Analysis, 2024
        • By Mode of Action
        • By Source
        • By Delivery System
        • By Physical Form
        • By Application
        • By End Use
    • Japan
      • Pricing Analysis
      • Market Share Analysis, 2024
        • By Mode of Action
        • By Source
        • By Delivery System
        • By Physical Form
        • By Application
        • By End Use
    • South Korea
      • Pricing Analysis
      • Market Share Analysis, 2024
        • By Mode of Action
        • By Source
        • By Delivery System
        • By Physical Form
        • By Application
        • By End Use
    • India
      • Pricing Analysis
      • Market Share Analysis, 2024
        • By Mode of Action
        • By Source
        • By Delivery System
        • By Physical Form
        • By Application
        • By End Use
    • Thailand
      • Pricing Analysis
      • Market Share Analysis, 2024
        • By Mode of Action
        • By Source
        • By Delivery System
        • By Physical Form
        • By Application
        • By End Use
    • Indonesia
      • Pricing Analysis
      • Market Share Analysis, 2024
        • By Mode of Action
        • By Source
        • By Delivery System
        • By Physical Form
        • By Application
        • By End Use
    • Australia
      • Pricing Analysis
      • Market Share Analysis, 2024
        • By Mode of Action
        • By Source
        • By Delivery System
        • By Physical Form
        • By Application
        • By End Use
    • New Zealand
      • Pricing Analysis
      • Market Share Analysis, 2024
        • By Mode of Action
        • By Source
        • By Delivery System
        • By Physical Form
        • By Application
        • By End Use
    • Turkey
      • Pricing Analysis
      • Market Share Analysis, 2024
        • By Mode of Action
        • By Source
        • By Delivery System
        • By Physical Form
        • By Application
        • By End Use
    • UAE
      • Pricing Analysis
      • Market Share Analysis, 2024
        • By Mode of Action
        • By Source
        • By Delivery System
        • By Physical Form
        • By Application
        • By End Use
    • Saudi Arabia
      • Pricing Analysis
      • Market Share Analysis, 2024
        • By Mode of Action
        • By Source
        • By Delivery System
        • By Physical Form
        • By Application
        • By End Use
    • Israel
      • Pricing Analysis
      • Market Share Analysis, 2024
        • By Mode of Action
        • By Source
        • By Delivery System
        • By Physical Form
        • By Application
        • By End Use
    • North Africa
      • Pricing Analysis
      • Market Share Analysis, 2024
        • By Mode of Action
        • By Source
        • By Delivery System
        • By Physical Form
        • By Application
        • By End Use
    • South Africa
      • Pricing Analysis
      • Market Share Analysis, 2024
        • By Mode of Action
        • By Source
        • By Delivery System
        • By Physical Form
        • By Application
        • By End Use
  19. Market Structure Analysis
    • Competition Dashboard
    • Competition Benchmarking
    • Market Share Analysis of Top Players
      • By Regional
      • By Mode of Action
      • By Source
      • By Delivery System
      • By Physical Form
      • By Application
      • By End Use
  20. Competition Analysis
    • Competition Deep Dive
      • Lipotec (Lubrizol)
        • Overview
        • Product Portfolio
        • Profitability by Market Segments (Product/Age /Sales Channel/Region)
        • Sales Footprint
        • Strategy Overview
          • Marketing Strategy
          • Product Strategy
          • Channel Strategy
      • Givaudan
        • Overview
        • Product Portfolio
        • Profitability by Market Segments (Product/Age /Sales Channel/Region)
        • Sales Footprint
        • Strategy Overview
          • Marketing Strategy
          • Product Strategy
          • Channel Strategy
      • Mibelle Biochemistry
        • Overview
        • Product Portfolio
        • Profitability by Market Segments (Product/Age /Sales Channel/Region)
        • Sales Footprint
        • Strategy Overview
          • Marketing Strategy
          • Product Strategy
          • Channel Strategy
      • DSM-Firmenich
        • Overview
        • Product Portfolio
        • Profitability by Market Segments (Product/Age /Sales Channel/Region)
        • Sales Footprint
        • Strategy Overview
          • Marketing Strategy
          • Product Strategy
          • Channel Strategy
      • Ashland
        • Overview
        • Product Portfolio
        • Profitability by Market Segments (Product/Age /Sales Channel/Region)
        • Sales Footprint
        • Strategy Overview
          • Marketing Strategy
          • Product Strategy
          • Channel Strategy
      • Croda
        • Overview
        • Product Portfolio
        • Profitability by Market Segments (Product/Age /Sales Channel/Region)
        • Sales Footprint
        • Strategy Overview
          • Marketing Strategy
          • Product Strategy
          • Channel Strategy
      • Symrise
        • Overview
        • Product Portfolio
        • Profitability by Market Segments (Product/Age /Sales Channel/Region)
        • Sales Footprint
        • Strategy Overview
          • Marketing Strategy
          • Product Strategy
          • Channel Strategy
      • Clariant
        • Overview
        • Product Portfolio
        • Profitability by Market Segments (Product/Age /Sales Channel/Region)
        • Sales Footprint
        • Strategy Overview
          • Marketing Strategy
          • Product Strategy
          • Channel Strategy
      • Rahn
        • Overview
        • Product Portfolio
        • Profitability by Market Segments (Product/Age /Sales Channel/Region)
        • Sales Footprint
        • Strategy Overview
          • Marketing Strategy
          • Product Strategy
          • Channel Strategy
      • Seppic
        • Overview
        • Product Portfolio
        • Profitability by Market Segments (Product/Age /Sales Channel/Region)
        • Sales Footprint
        • Strategy Overview
          • Marketing Strategy
          • Product Strategy
          • Channel Strategy
      • Others
        • Overview
        • Product Portfolio
        • Profitability by Market Segments (Product/Age /Sales Channel/Region)
        • Sales Footprint
        • Strategy Overview
          • Marketing Strategy
          • Product Strategy
          • Channel Strategy
  21. Assumptions & Acronyms Used
  22. Research Methodology

List of Tables

  • Table 1: Global Market Value (USD Million) Forecast by Region, 2020-2035
  • Table 2: Global Market Volume (Units) Forecast by Region, 2020-2035
  • Table 3: Global Market Value (USD Million) Forecast by Mode of Action, 2020-2035
  • Table 4: Global Market Volume (Units) Forecast by Mode of Action, 2020-2035
  • Table 5: Global Market Value (USD Million) Forecast by Source, 2020-2035
  • Table 6: Global Market Volume (Units) Forecast by Source, 2020-2035
  • Table 7: Global Market Value (USD Million) Forecast by Delivery System, 2020-2035
  • Table 8: Global Market Volume (Units) Forecast by Delivery System, 2020-2035
  • Table 9: Global Market Value (USD Million) Forecast by Physical Form, 2020-2035
  • Table 10: Global Market Volume (Units) Forecast by Physical Form, 2020-2035
  • Table 11: Global Market Value (USD Million) Forecast by Application, 2020-2035
  • Table 12: Global Market Volume (Units) Forecast by Application, 2020-2035
  • Table 13: Global Market Value (USD Million) Forecast by End Use, 2020-2035
  • Table 14: Global Market Volume (Units) Forecast by End Use, 2020-2035
  • Table 15: North America Market Value (USD Million) Forecast by Country, 2020-2035
  • Table 16: North America Market Volume (Units) Forecast by Country, 2020-2035
  • Table 17: North America Market Value (USD Million) Forecast by Mode of Action, 2020-2035
  • Table 18: North America Market Volume (Units) Forecast by Mode of Action, 2020-2035
  • Table 19: North America Market Value (USD Million) Forecast by Source, 2020-2035
  • Table 20: North America Market Volume (Units) Forecast by Source, 2020-2035
  • Table 21: North America Market Value (USD Million) Forecast by Delivery System, 2020-2035
  • Table 22: North America Market Volume (Units) Forecast by Delivery System, 2020-2035
  • Table 23: North America Market Value (USD Million) Forecast by Physical Form, 2020-2035
  • Table 24: North America Market Volume (Units) Forecast by Physical Form, 2020-2035
  • Table 25: North America Market Value (USD Million) Forecast by Application, 2020-2035
  • Table 26: North America Market Volume (Units) Forecast by Application, 2020-2035
  • Table 27: North America Market Value (USD Million) Forecast by End Use, 2020-2035
  • Table 28: North America Market Volume (Units) Forecast by End Use, 2020-2035
  • Table 29: Latin America Market Value (USD Million) Forecast by Country, 2020-2035
  • Table 30: Latin America Market Volume (Units) Forecast by Country, 2020-2035
  • Table 31: Latin America Market Value (USD Million) Forecast by Mode of Action, 2020-2035
  • Table 32: Latin America Market Volume (Units) Forecast by Mode of Action, 2020-2035
  • Table 33: Latin America Market Value (USD Million) Forecast by Source, 2020-2035
  • Table 34: Latin America Market Volume (Units) Forecast by Source, 2020-2035
  • Table 35: Latin America Market Value (USD Million) Forecast by Delivery System, 2020-2035
  • Table 36: Latin America Market Volume (Units) Forecast by Delivery System, 2020-2035
  • Table 37: Latin America Market Value (USD Million) Forecast by Physical Form, 2020-2035
  • Table 38: Latin America Market Volume (Units) Forecast by Physical Form, 2020-2035
  • Table 39: Latin America Market Value (USD Million) Forecast by Application, 2020-2035
  • Table 40: Latin America Market Volume (Units) Forecast by Application, 2020-2035
  • Table 41: Latin America Market Value (USD Million) Forecast by End Use, 2020-2035
  • Table 42: Latin America Market Volume (Units) Forecast by End Use, 2020-2035
  • Table 43: Europe Market Value (USD Million) Forecast by Country, 2020-2035
  • Table 44: Europe Market Volume (Units) Forecast by Country, 2020-2035
  • Table 45: Europe Market Value (USD Million) Forecast by Mode of Action, 2020-2035
  • Table 46: Europe Market Volume (Units) Forecast by Mode of Action, 2020-2035
  • Table 47: Europe Market Value (USD Million) Forecast by Source, 2020-2035
  • Table 48: Europe Market Volume (Units) Forecast by Source, 2020-2035
  • Table 49: Europe Market Value (USD Million) Forecast by Delivery System, 2020-2035
  • Table 50: Europe Market Volume (Units) Forecast by Delivery System, 2020-2035
  • Table 51: Europe Market Value (USD Million) Forecast by Physical Form, 2020-2035
  • Table 52: Europe Market Volume (Units) Forecast by Physical Form, 2020-2035
  • Table 53: Europe Market Value (USD Million) Forecast by Application, 2020-2035
  • Table 54: Europe Market Volume (Units) Forecast by Application, 2020-2035
  • Table 55: Europe Market Value (USD Million) Forecast by End Use, 2020-2035
  • Table 56: Europe Market Volume (Units) Forecast by End Use, 2020-2035
  • Table 57: East Asia Market Value (USD Million) Forecast by Country, 2020-2035
  • Table 58: East Asia Market Volume (Units) Forecast by Country, 2020-2035
  • Table 59: East Asia Market Value (USD Million) Forecast by Mode of Action, 2020-2035
  • Table 60: East Asia Market Volume (Units) Forecast by Mode of Action, 2020-2035
  • Table 61: East Asia Market Value (USD Million) Forecast by Source, 2020-2035
  • Table 62: East Asia Market Volume (Units) Forecast by Source, 2020-2035
  • Table 63: East Asia Market Value (USD Million) Forecast by Delivery System, 2020-2035
  • Table 64: East Asia Market Volume (Units) Forecast by Delivery System, 2020-2035
  • Table 65: East Asia Market Value (USD Million) Forecast by Physical Form, 2020-2035
  • Table 66: East Asia Market Volume (Units) Forecast by Physical Form, 2020-2035
  • Table 67: East Asia Market Value (USD Million) Forecast by Application, 2020-2035
  • Table 68: East Asia Market Volume (Units) Forecast by Application, 2020-2035
  • Table 69: East Asia Market Value (USD Million) Forecast by End Use, 2020-2035
  • Table 70: East Asia Market Volume (Units) Forecast by End Use, 2020-2035
  • Table 71: South Asia & Pacific Market Value (USD Million) Forecast by Country, 2020-2035
  • Table 72: South Asia & Pacific Market Volume (Units) Forecast by Country, 2020-2035
  • Table 73: South Asia & Pacific Market Value (USD Million) Forecast by Mode of Action, 2020-2035
  • Table 74: South Asia & Pacific Market Volume (Units) Forecast by Mode of Action, 2020-2035
  • Table 75: South Asia & Pacific Market Value (USD Million) Forecast by Source, 2020-2035
  • Table 76: South Asia & Pacific Market Volume (Units) Forecast by Source, 2020-2035
  • Table 77: South Asia & Pacific Market Value (USD Million) Forecast by Delivery System, 2020-2035
  • Table 78: South Asia & Pacific Market Volume (Units) Forecast by Delivery System, 2020-2035
  • Table 79: South Asia & Pacific Market Value (USD Million) Forecast by Physical Form, 2020-2035
  • Table 80: South Asia & Pacific Market Volume (Units) Forecast by Physical Form, 2020-2035
  • Table 81: South Asia & Pacific Market Value (USD Million) Forecast by Application, 2020-2035
  • Table 82: South Asia & Pacific Market Volume (Units) Forecast by Application, 2020-2035
  • Table 83: South Asia & Pacific Market Value (USD Million) Forecast by End Use, 2020-2035
  • Table 84: South Asia & Pacific Market Volume (Units) Forecast by End Use, 2020-2035
  • Table 85: Middle East and Africa Market Value (USD Million) Forecast by Country, 2020-2035
  • Table 86: Middle East and Africa Market Volume (Units) Forecast by Country, 2020-2035
  • Table 87: Middle East and Africa Market Value (USD Million) Forecast by Mode of Action, 2020-2035
  • Table 88: Middle East and Africa Market Volume (Units) Forecast by Mode of Action, 2020-2035
  • Table 89: Middle East and Africa Market Value (USD Million) Forecast by Source, 2020-2035
  • Table 90: Middle East and Africa Market Volume (Units) Forecast by Source, 2020-2035
  • Table 91: Middle East and Africa Market Value (USD Million) Forecast by Delivery System, 2020-2035
  • Table 92: Middle East and Africa Market Volume (Units) Forecast by Delivery System, 2020-2035
  • Table 93: Middle East and Africa Market Value (USD Million) Forecast by Physical Form, 2020-2035
  • Table 94: Middle East and Africa Market Volume (Units) Forecast by Physical Form, 2020-2035
  • Table 95: Middle East and Africa Market Value (USD Million) Forecast by Application, 2020-2035
  • Table 96: Middle East and Africa Market Volume (Units) Forecast by Application, 2020-2035
  • Table 97: Middle East and Africa Market Value (USD Million) Forecast by End Use, 2020-2035
  • Table 98: Middle East and Africa Market Volume (Units) Forecast by End Use, 2020-2035

List of Figures

  • Figure 1: Global Market Value (USD Million) by Mode of Action, 2025-2035
  • Figure 2: Global Market Value (USD Million) by Source, 2025-2035
  • Figure 3: Global Market Value (USD Million) by Delivery System, 2025-2035
  • Figure 4: Global Market Value (USD Million) by Physical Form, 2025-2035
  • Figure 5: Global Market Value (USD Million) by Application, 2025-2035
  • Figure 6: Global Market Value (USD Million) by End Use, 2025-2035
  • Figure 7: Global Market Value (USD Million) by Region, 2025-2035
  • Figure 8: Global Market Value (USD Million) Analysis by Region, 2020-2035
  • Figure 9: Global Market Volume (Units) Analysis by Region, 2020-2035
  • Figure 10: Global Market Value Share (%) and BPS Analysis by Region, 2025-2035
  • Figure 11: Global Market Y-o-Y Growth (%) Projections by Region, 2025-2035
  • Figure 12: Global Market Value (USD Million) Analysis by Mode of Action, 2020-2035
  • Figure 13: Global Market Volume (Units) Analysis by Mode of Action, 2020-2035
  • Figure 14: Global Market Value Share (%) and BPS Analysis by Mode of Action, 2025-2035
  • Figure 15: Global Market Y-o-Y Growth (%) Projections by Mode of Action, 2025-2035
  • Figure 16: Global Market Value (USD Million) Analysis by Source, 2020-2035
  • Figure 17: Global Market Volume (Units) Analysis by Source, 2020-2035
  • Figure 18: Global Market Value Share (%) and BPS Analysis by Source, 2025-2035
  • Figure 19: Global Market Y-o-Y Growth (%) Projections by Source, 2025-2035
  • Figure 20: Global Market Value (USD Million) Analysis by Delivery System, 2020-2035
  • Figure 21: Global Market Volume (Units) Analysis by Delivery System, 2020-2035
  • Figure 22: Global Market Value Share (%) and BPS Analysis by Delivery System, 2025-2035
  • Figure 23: Global Market Y-o-Y Growth (%) Projections by Delivery System, 2025-2035
  • Figure 24: Global Market Value (USD Million) Analysis by Physical Form, 2020-2035
  • Figure 25: Global Market Volume (Units) Analysis by Physical Form, 2020-2035
  • Figure 26: Global Market Value Share (%) and BPS Analysis by Physical Form, 2025-2035
  • Figure 27: Global Market Y-o-Y Growth (%) Projections by Physical Form, 2025-2035
  • Figure 28: Global Market Value (USD Million) Analysis by Application, 2020-2035
  • Figure 29: Global Market Volume (Units) Analysis by Application, 2020-2035
  • Figure 30: Global Market Value Share (%) and BPS Analysis by Application, 2025-2035
  • Figure 31: Global Market Y-o-Y Growth (%) Projections by Application, 2025-2035
  • Figure 32: Global Market Value (USD Million) Analysis by End Use, 2020-2035
  • Figure 33: Global Market Volume (Units) Analysis by End Use, 2020-2035
  • Figure 34: Global Market Value Share (%) and BPS Analysis by End Use, 2025-2035
  • Figure 35: Global Market Y-o-Y Growth (%) Projections by End Use, 2025-2035
  • Figure 36: Global Market Attractiveness by Mode of Action, 2025-2035
  • Figure 37: Global Market Attractiveness by Source, 2025-2035
  • Figure 38: Global Market Attractiveness by Delivery System, 2025-2035
  • Figure 39: Global Market Attractiveness by Physical Form, 2025-2035
  • Figure 40: Global Market Attractiveness by Application, 2025-2035
  • Figure 41: Global Market Attractiveness by End Use, 2025-2035
  • Figure 42: Global Market Attractiveness by Region, 2025-2035
  • Figure 43: North America Market Value (USD Million) by Mode of Action, 2025-2035
  • Figure 44: North America Market Value (USD Million) by Source, 2025-2035
  • Figure 45: North America Market Value (USD Million) by Delivery System, 2025-2035
  • Figure 46: North America Market Value (USD Million) by Physical Form, 2025-2035
  • Figure 47: North America Market Value (USD Million) by Application, 2025-2035
  • Figure 48: North America Market Value (USD Million) by End Use, 2025-2035
  • Figure 49: North America Market Value (USD Million) by Country, 2025-2035
  • Figure 50: North America Market Value (USD Million) Analysis by Country, 2020-2035
  • Figure 51: North America Market Volume (Units) Analysis by Country, 2020-2035
  • Figure 52: North America Market Value Share (%) and BPS Analysis by Country, 2025-2035
  • Figure 53: North America Market Y-o-Y Growth (%) Projections by Country, 2025-2035
  • Figure 54: North America Market Value (USD Million) Analysis by Mode of Action, 2020-2035
  • Figure 55: North America Market Volume (Units) Analysis by Mode of Action, 2020-2035
  • Figure 56: North America Market Value Share (%) and BPS Analysis by Mode of Action, 2025-2035
  • Figure 57: North America Market Y-o-Y Growth (%) Projections by Mode of Action, 2025-2035
  • Figure 58: North America Market Value (USD Million) Analysis by Source, 2020-2035
  • Figure 59: North America Market Volume (Units) Analysis by Source, 2020-2035
  • Figure 60: North America Market Value Share (%) and BPS Analysis by Source, 2025-2035
  • Figure 61: North America Market Y-o-Y Growth (%) Projections by Source, 2025-2035
  • Figure 62: North America Market Value (USD Million) Analysis by Delivery System, 2020-2035
  • Figure 63: North America Market Volume (Units) Analysis by Delivery System, 2020-2035
  • Figure 64: North America Market Value Share (%) and BPS Analysis by Delivery System, 2025-2035
  • Figure 65: North America Market Y-o-Y Growth (%) Projections by Delivery System, 2025-2035
  • Figure 66: North America Market Value (USD Million) Analysis by Physical Form, 2020-2035
  • Figure 67: North America Market Volume (Units) Analysis by Physical Form, 2020-2035
  • Figure 68: North America Market Value Share (%) and BPS Analysis by Physical Form, 2025-2035
  • Figure 69: North America Market Y-o-Y Growth (%) Projections by Physical Form, 2025-2035
  • Figure 70: North America Market Value (USD Million) Analysis by Application, 2020-2035
  • Figure 71: North America Market Volume (Units) Analysis by Application, 2020-2035
  • Figure 72: North America Market Value Share (%) and BPS Analysis by Application, 2025-2035
  • Figure 73: North America Market Y-o-Y Growth (%) Projections by Application, 2025-2035
  • Figure 74: North America Market Value (USD Million) Analysis by End Use, 2020-2035
  • Figure 75: North America Market Volume (Units) Analysis by End Use, 2020-2035
  • Figure 76: North America Market Value Share (%) and BPS Analysis by End Use, 2025-2035
  • Figure 77: North America Market Y-o-Y Growth (%) Projections by End Use, 2025-2035
  • Figure 78: North America Market Attractiveness by Mode of Action, 2025-2035
  • Figure 79: North America Market Attractiveness by Source, 2025-2035
  • Figure 80: North America Market Attractiveness by Delivery System, 2025-2035
  • Figure 81: North America Market Attractiveness by Physical Form, 2025-2035
  • Figure 82: North America Market Attractiveness by Application, 2025-2035
  • Figure 83: North America Market Attractiveness by End Use, 2025-2035
  • Figure 84: North America Market Attractiveness by Country, 2025-2035
  • Figure 85: Latin America Market Value (USD Million) by Mode of Action, 2025-2035
  • Figure 86: Latin America Market Value (USD Million) by Source, 2025-2035
  • Figure 87: Latin America Market Value (USD Million) by Delivery System, 2025-2035
  • Figure 88: Latin America Market Value (USD Million) by Physical Form, 2025-2035
  • Figure 89: Latin America Market Value (USD Million) by Application, 2025-2035
  • Figure 90: Latin America Market Value (USD Million) by End Use, 2025-2035
  • Figure 91: Latin America Market Value (USD Million) by Country, 2025-2035
  • Figure 92: Latin America Market Value (USD Million) Analysis by Country, 2020-2035
  • Figure 93: Latin America Market Volume (Units) Analysis by Country, 2020-2035
  • Figure 94: Latin America Market Value Share (%) and BPS Analysis by Country, 2025-2035
  • Figure 95: Latin America Market Y-o-Y Growth (%) Projections by Country, 2025-2035
  • Figure 96: Latin America Market Value (USD Million) Analysis by Mode of Action, 2020-2035
  • Figure 97: Latin America Market Volume (Units) Analysis by Mode of Action, 2020-2035
  • Figure 98: Latin America Market Value Share (%) and BPS Analysis by Mode of Action, 2025-2035
  • Figure 99: Latin America Market Y-o-Y Growth (%) Projections by Mode of Action, 2025-2035
  • Figure 100: Latin America Market Value (USD Million) Analysis by Source, 2020-2035
  • Figure 101: Latin America Market Volume (Units) Analysis by Source, 2020-2035
  • Figure 102: Latin America Market Value Share (%) and BPS Analysis by Source, 2025-2035
  • Figure 103: Latin America Market Y-o-Y Growth (%) Projections by Source, 2025-2035
  • Figure 104: Latin America Market Value (USD Million) Analysis by Delivery System, 2020-2035
  • Figure 105: Latin America Market Volume (Units) Analysis by Delivery System, 2020-2035
  • Figure 106: Latin America Market Value Share (%) and BPS Analysis by Delivery System, 2025-2035
  • Figure 107: Latin America Market Y-o-Y Growth (%) Projections by Delivery System, 2025-2035
  • Figure 108: Latin America Market Value (USD Million) Analysis by Physical Form, 2020-2035
  • Figure 109: Latin America Market Volume (Units) Analysis by Physical Form, 2020-2035
  • Figure 110: Latin America Market Value Share (%) and BPS Analysis by Physical Form, 2025-2035
  • Figure 111: Latin America Market Y-o-Y Growth (%) Projections by Physical Form, 2025-2035
  • Figure 112: Latin America Market Value (USD Million) Analysis by Application, 2020-2035
  • Figure 113: Latin America Market Volume (Units) Analysis by Application, 2020-2035
  • Figure 114: Latin America Market Value Share (%) and BPS Analysis by Application, 2025-2035
  • Figure 115: Latin America Market Y-o-Y Growth (%) Projections by Application, 2025-2035
  • Figure 116: Latin America Market Value (USD Million) Analysis by End Use, 2020-2035
  • Figure 117: Latin America Market Volume (Units) Analysis by End Use, 2020-2035
  • Figure 118: Latin America Market Value Share (%) and BPS Analysis by End Use, 2025-2035
  • Figure 119: Latin America Market Y-o-Y Growth (%) Projections by End Use, 2025-2035
  • Figure 120: Latin America Market Attractiveness by Mode of Action, 2025-2035
  • Figure 121: Latin America Market Attractiveness by Source, 2025-2035
  • Figure 122: Latin America Market Attractiveness by Delivery System, 2025-2035
  • Figure 123: Latin America Market Attractiveness by Physical Form, 2025-2035
  • Figure 124: Latin America Market Attractiveness by Application, 2025-2035
  • Figure 125: Latin America Market Attractiveness by End Use, 2025-2035
  • Figure 126: Latin America Market Attractiveness by Country, 2025-2035
  • Figure 127: Europe Market Value (USD Million) by Mode of Action, 2025-2035
  • Figure 128: Europe Market Value (USD Million) by Source, 2025-2035
  • Figure 129: Europe Market Value (USD Million) by Delivery System, 2025-2035
  • Figure 130: Europe Market Value (USD Million) by Physical Form, 2025-2035
  • Figure 131: Europe Market Value (USD Million) by Application, 2025-2035
  • Figure 132: Europe Market Value (USD Million) by End Use, 2025-2035
  • Figure 133: Europe Market Value (USD Million) by Country, 2025-2035
  • Figure 134: Europe Market Value (USD Million) Analysis by Country, 2020-2035
  • Figure 135: Europe Market Volume (Units) Analysis by Country, 2020-2035
  • Figure 136: Europe Market Value Share (%) and BPS Analysis by Country, 2025-2035
  • Figure 137: Europe Market Y-o-Y Growth (%) Projections by Country, 2025-2035
  • Figure 138: Europe Market Value (USD Million) Analysis by Mode of Action, 2020-2035
  • Figure 139: Europe Market Volume (Units) Analysis by Mode of Action, 2020-2035
  • Figure 140: Europe Market Value Share (%) and BPS Analysis by Mode of Action, 2025-2035
  • Figure 141: Europe Market Y-o-Y Growth (%) Projections by Mode of Action, 2025-2035
  • Figure 142: Europe Market Value (USD Million) Analysis by Source, 2020-2035
  • Figure 143: Europe Market Volume (Units) Analysis by Source, 2020-2035
  • Figure 144: Europe Market Value Share (%) and BPS Analysis by Source, 2025-2035
  • Figure 145: Europe Market Y-o-Y Growth (%) Projections by Source, 2025-2035
  • Figure 146: Europe Market Value (USD Million) Analysis by Delivery System, 2020-2035
  • Figure 147: Europe Market Volume (Units) Analysis by Delivery System, 2020-2035
  • Figure 148: Europe Market Value Share (%) and BPS Analysis by Delivery System, 2025-2035
  • Figure 149: Europe Market Y-o-Y Growth (%) Projections by Delivery System, 2025-2035
  • Figure 150: Europe Market Value (USD Million) Analysis by Physical Form, 2020-2035
  • Figure 151: Europe Market Volume (Units) Analysis by Physical Form, 2020-2035
  • Figure 152: Europe Market Value Share (%) and BPS Analysis by Physical Form, 2025-2035
  • Figure 153: Europe Market Y-o-Y Growth (%) Projections by Physical Form, 2025-2035
  • Figure 154: Europe Market Value (USD Million) Analysis by Application, 2020-2035
  • Figure 155: Europe Market Volume (Units) Analysis by Application, 2020-2035
  • Figure 156: Europe Market Value Share (%) and BPS Analysis by Application, 2025-2035
  • Figure 157: Europe Market Y-o-Y Growth (%) Projections by Application, 2025-2035
  • Figure 158: Europe Market Value (USD Million) Analysis by End Use, 2020-2035
  • Figure 159: Europe Market Volume (Units) Analysis by End Use, 2020-2035
  • Figure 160: Europe Market Value Share (%) and BPS Analysis by End Use, 2025-2035
  • Figure 161: Europe Market Y-o-Y Growth (%) Projections by End Use, 2025-2035
  • Figure 162: Europe Market Attractiveness by Mode of Action, 2025-2035
  • Figure 163: Europe Market Attractiveness by Source, 2025-2035
  • Figure 164: Europe Market Attractiveness by Delivery System, 2025-2035
  • Figure 165: Europe Market Attractiveness by Physical Form, 2025-2035
  • Figure 166: Europe Market Attractiveness by Application, 2025-2035
  • Figure 167: Europe Market Attractiveness by End Use, 2025-2035
  • Figure 168: Europe Market Attractiveness by Country, 2025-2035
  • Figure 169: East Asia Market Value (USD Million) by Mode of Action, 2025-2035
  • Figure 170: East Asia Market Value (USD Million) by Source, 2025-2035
  • Figure 171: East Asia Market Value (USD Million) by Delivery System, 2025-2035
  • Figure 172: East Asia Market Value (USD Million) by Physical Form, 2025-2035
  • Figure 173: East Asia Market Value (USD Million) by Application, 2025-2035
  • Figure 174: East Asia Market Value (USD Million) by End Use, 2025-2035
  • Figure 175: East Asia Market Value (USD Million) by Country, 2025-2035
  • Figure 176: East Asia Market Value (USD Million) Analysis by Country, 2020-2035
  • Figure 177: East Asia Market Volume (Units) Analysis by Country, 2020-2035
  • Figure 178: East Asia Market Value Share (%) and BPS Analysis by Country, 2025-2035
  • Figure 179: East Asia Market Y-o-Y Growth (%) Projections by Country, 2025-2035
  • Figure 180: East Asia Market Value (USD Million) Analysis by Mode of Action, 2020-2035
  • Figure 181: East Asia Market Volume (Units) Analysis by Mode of Action, 2020-2035
  • Figure 182: East Asia Market Value Share (%) and BPS Analysis by Mode of Action, 2025-2035
  • Figure 183: East Asia Market Y-o-Y Growth (%) Projections by Mode of Action, 2025-2035
  • Figure 184: East Asia Market Value (USD Million) Analysis by Source, 2020-2035
  • Figure 185: East Asia Market Volume (Units) Analysis by Source, 2020-2035
  • Figure 186: East Asia Market Value Share (%) and BPS Analysis by Source, 2025-2035
  • Figure 187: East Asia Market Y-o-Y Growth (%) Projections by Source, 2025-2035
  • Figure 188: East Asia Market Value (USD Million) Analysis by Delivery System, 2020-2035
  • Figure 189: East Asia Market Volume (Units) Analysis by Delivery System, 2020-2035
  • Figure 190: East Asia Market Value Share (%) and BPS Analysis by Delivery System, 2025-2035
  • Figure 191: East Asia Market Y-o-Y Growth (%) Projections by Delivery System, 2025-2035
  • Figure 192: East Asia Market Value (USD Million) Analysis by Physical Form, 2020-2035
  • Figure 193: East Asia Market Volume (Units) Analysis by Physical Form, 2020-2035
  • Figure 194: East Asia Market Value Share (%) and BPS Analysis by Physical Form, 2025-2035
  • Figure 195: East Asia Market Y-o-Y Growth (%) Projections by Physical Form, 2025-2035
  • Figure 196: East Asia Market Value (USD Million) Analysis by Application, 2020-2035
  • Figure 197: East Asia Market Volume (Units) Analysis by Application, 2020-2035
  • Figure 198: East Asia Market Value Share (%) and BPS Analysis by Application, 2025-2035
  • Figure 199: East Asia Market Y-o-Y Growth (%) Projections by Application, 2025-2035
  • Figure 200: East Asia Market Value (USD Million) Analysis by End Use, 2020-2035
  • Figure 201: East Asia Market Volume (Units) Analysis by End Use, 2020-2035
  • Figure 202: East Asia Market Value Share (%) and BPS Analysis by End Use, 2025-2035
  • Figure 203: East Asia Market Y-o-Y Growth (%) Projections by End Use, 2025-2035
  • Figure 204: East Asia Market Attractiveness by Mode of Action, 2025-2035
  • Figure 205: East Asia Market Attractiveness by Source, 2025-2035
  • Figure 206: East Asia Market Attractiveness by Delivery System, 2025-2035
  • Figure 207: East Asia Market Attractiveness by Physical Form, 2025-2035
  • Figure 208: East Asia Market Attractiveness by Application, 2025-2035
  • Figure 209: East Asia Market Attractiveness by End Use, 2025-2035
  • Figure 210: East Asia Market Attractiveness by Country, 2025-2035
  • Figure 211: South Asia & Pacific Market Value (USD Million) by Mode of Action, 2025-2035
  • Figure 212: South Asia & Pacific Market Value (USD Million) by Source, 2025-2035
  • Figure 213: South Asia & Pacific Market Value (USD Million) by Delivery System, 2025-2035
  • Figure 214: South Asia & Pacific Market Value (USD Million) by Physical Form, 2025-2035
  • Figure 215: South Asia & Pacific Market Value (USD Million) by Application, 2025-2035
  • Figure 216: South Asia & Pacific Market Value (USD Million) by End Use, 2025-2035
  • Figure 217: South Asia & Pacific Market Value (USD Million) by Country, 2025-2035
  • Figure 218: South Asia & Pacific Market Value (USD Million) Analysis by Country, 2020-2035
  • Figure 219: South Asia & Pacific Market Volume (Units) Analysis by Country, 2020-2035
  • Figure 220: South Asia & Pacific Market Value Share (%) and BPS Analysis by Country, 2025-2035
  • Figure 221: South Asia & Pacific Market Y-o-Y Growth (%) Projections by Country, 2025-2035
  • Figure 222: South Asia & Pacific Market Value (USD Million) Analysis by Mode of Action, 2020-2035
  • Figure 223: South Asia & Pacific Market Volume (Units) Analysis by Mode of Action, 2020-2035
  • Figure 224: South Asia & Pacific Market Value Share (%) and BPS Analysis by Mode of Action, 2025-2035
  • Figure 225: South Asia & Pacific Market Y-o-Y Growth (%) Projections by Mode of Action, 2025-2035
  • Figure 226: South Asia & Pacific Market Value (USD Million) Analysis by Source, 2020-2035
  • Figure 227: South Asia & Pacific Market Volume (Units) Analysis by Source, 2020-2035
  • Figure 228: South Asia & Pacific Market Value Share (%) and BPS Analysis by Source, 2025-2035
  • Figure 229: South Asia & Pacific Market Y-o-Y Growth (%) Projections by Source, 2025-2035
  • Figure 230: South Asia & Pacific Market Value (USD Million) Analysis by Delivery System, 2020-2035
  • Figure 231: South Asia & Pacific Market Volume (Units) Analysis by Delivery System, 2020-2035
  • Figure 232: South Asia & Pacific Market Value Share (%) and BPS Analysis by Delivery System, 2025-2035
  • Figure 233: South Asia & Pacific Market Y-o-Y Growth (%) Projections by Delivery System, 2025-2035
  • Figure 234: South Asia & Pacific Market Value (USD Million) Analysis by Physical Form, 2020-2035
  • Figure 235: South Asia & Pacific Market Volume (Units) Analysis by Physical Form, 2020-2035
  • Figure 236: South Asia & Pacific Market Value Share (%) and BPS Analysis by Physical Form, 2025-2035
  • Figure 237: South Asia & Pacific Market Y-o-Y Growth (%) Projections by Physical Form, 2025-2035
  • Figure 238: South Asia & Pacific Market Value (USD Million) Analysis by Application, 2020-2035
  • Figure 239: South Asia & Pacific Market Volume (Units) Analysis by Application, 2020-2035
  • Figure 240: South Asia & Pacific Market Value Share (%) and BPS Analysis by Application, 2025-2035
  • Figure 241: South Asia & Pacific Market Y-o-Y Growth (%) Projections by Application, 2025-2035
  • Figure 242: South Asia & Pacific Market Value (USD Million) Analysis by End Use, 2020-2035
  • Figure 243: South Asia & Pacific Market Volume (Units) Analysis by End Use, 2020-2035
  • Figure 244: South Asia & Pacific Market Value Share (%) and BPS Analysis by End Use, 2025-2035
  • Figure 245: South Asia & Pacific Market Y-o-Y Growth (%) Projections by End Use, 2025-2035
  • Figure 246: South Asia & Pacific Market Attractiveness by Mode of Action, 2025-2035
  • Figure 247: South Asia & Pacific Market Attractiveness by Source, 2025-2035
  • Figure 248: South Asia & Pacific Market Attractiveness by Delivery System, 2025-2035
  • Figure 249: South Asia & Pacific Market Attractiveness by Physical Form, 2025-2035
  • Figure 250: South Asia & Pacific Market Attractiveness by Application, 2025-2035
  • Figure 251: South Asia & Pacific Market Attractiveness by End Use, 2025-2035
  • Figure 252: South Asia & Pacific Market Attractiveness by Country, 2025-2035
  • Figure 253: Middle East and Africa Market Value (USD Million) by Mode of Action, 2025-2035
  • Figure 254: Middle East and Africa Market Value (USD Million) by Source, 2025-2035
  • Figure 255: Middle East and Africa Market Value (USD Million) by Delivery System, 2025-2035
  • Figure 256: Middle East and Africa Market Value (USD Million) by Physical Form, 2025-2035
  • Figure 257: Middle East and Africa Market Value (USD Million) by Application, 2025-2035
  • Figure 258: Middle East and Africa Market Value (USD Million) by End Use, 2025-2035
  • Figure 259: Middle East and Africa Market Value (USD Million) by Country, 2025-2035
  • Figure 260: Middle East and Africa Market Value (USD Million) Analysis by Country, 2020-2035
  • Figure 261: Middle East and Africa Market Volume (Units) Analysis by Country, 2020-2035
  • Figure 262: Middle East and Africa Market Value Share (%) and BPS Analysis by Country, 2025-2035
  • Figure 263: Middle East and Africa Market Y-o-Y Growth (%) Projections by Country, 2025-2035
  • Figure 264: Middle East and Africa Market Value (USD Million) Analysis by Mode of Action, 2020-2035
  • Figure 265: Middle East and Africa Market Volume (Units) Analysis by Mode of Action, 2020-2035
  • Figure 266: Middle East and Africa Market Value Share (%) and BPS Analysis by Mode of Action, 2025-2035
  • Figure 267: Middle East and Africa Market Y-o-Y Growth (%) Projections by Mode of Action, 2025-2035
  • Figure 268: Middle East and Africa Market Value (USD Million) Analysis by Source, 2020-2035
  • Figure 269: Middle East and Africa Market Volume (Units) Analysis by Source, 2020-2035
  • Figure 270: Middle East and Africa Market Value Share (%) and BPS Analysis by Source, 2025-2035
  • Figure 271: Middle East and Africa Market Y-o-Y Growth (%) Projections by Source, 2025-2035
  • Figure 272: Middle East and Africa Market Value (USD Million) Analysis by Delivery System, 2020-2035
  • Figure 273: Middle East and Africa Market Volume (Units) Analysis by Delivery System, 2020-2035
  • Figure 274: Middle East and Africa Market Value Share (%) and BPS Analysis by Delivery System, 2025-2035
  • Figure 275: Middle East and Africa Market Y-o-Y Growth (%) Projections by Delivery System, 2025-2035
  • Figure 276: Middle East and Africa Market Value (USD Million) Analysis by Physical Form, 2020-2035
  • Figure 277: Middle East and Africa Market Volume (Units) Analysis by Physical Form, 2020-2035
  • Figure 278: Middle East and Africa Market Value Share (%) and BPS Analysis by Physical Form, 2025-2035
  • Figure 279: Middle East and Africa Market Y-o-Y Growth (%) Projections by Physical Form, 2025-2035
  • Figure 280: Middle East and Africa Market Value (USD Million) Analysis by Application, 2020-2035
  • Figure 281: Middle East and Africa Market Volume (Units) Analysis by Application, 2020-2035
  • Figure 282: Middle East and Africa Market Value Share (%) and BPS Analysis by Application, 2025-2035
  • Figure 283: Middle East and Africa Market Y-o-Y Growth (%) Projections by Application, 2025-2035
  • Figure 284: Middle East and Africa Market Value (USD Million) Analysis by End Use, 2020-2035
  • Figure 285: Middle East and Africa Market Volume (Units) Analysis by End Use, 2020-2035
  • Figure 286: Middle East and Africa Market Value Share (%) and BPS Analysis by End Use, 2025-2035
  • Figure 287: Middle East and Africa Market Y-o-Y Growth (%) Projections by End Use, 2025-2035
  • Figure 288: Middle East and Africa Market Attractiveness by Mode of Action, 2025-2035
  • Figure 289: Middle East and Africa Market Attractiveness by Source, 2025-2035
  • Figure 290: Middle East and Africa Market Attractiveness by Delivery System, 2025-2035
  • Figure 291: Middle East and Africa Market Attractiveness by Physical Form, 2025-2035
  • Figure 292: Middle East and Africa Market Attractiveness by Application, 2025-2035
  • Figure 293: Middle East and Africa Market Attractiveness by End Use, 2025-2035
  • Figure 294: Middle East and Africa Market Attractiveness by Country, 2025-2035
Dashboard
Dashboard
Dashboard
Dashboard
Dashboard
Dashboard

Full Research Suite comprises of:

Market outlook & trends analysis

Market outlook & trends analysis

Interviews & case studies

Interviews & case studies

Strategic recommendations

Strategic recommendations

Vendor profiles & capabilities analysis

Vendor profiles & capabilities analysis

5-year forecasts

5-year forecasts

8 regions and 60+ country-level data splits

8 regions and 60+ country-level data splits

Market segment data splits

Market segment data splits

12 months of continuous data updates

12 months of continuous data updates

DELIVERED AS:

PDF EXCEL ONLINE

Full Research Suite


$2000

$3500

$5000

Buy Report Now
Similar Industry Reports

Similar Industry Reports

Matting Agents Market

Matting Agents Market Size and Share Forecast Outlook 2025 to 2035

Healing Agents Market

Healing Agents Market (Skin Repair & Soothing Actives) Market Size and Share Forecast Outlook 2025 to 2035

Foaming Agents Market

Foaming Agents Market Size and Share Forecast Outlook 2025 to 2035

Firming Agents Botox-Like Market

Firming Agents Botox-Like Market Size and Share Forecast Outlook 2025 to 2035

Heating Agents Market

Heating Agents Market Size and Share Forecast Outlook 2025 to 2035

Cooling Agents Market

Cooling Agents Market Size and Share Forecast Outlook 2025 to 2035

Firming Agents Market

Firming Agents Market Growth – Product Innovations & Applications from 2025 to 2035

Raising Agents Market

Raising Agents Market Trends – Growth & Industry Forecast 2024 to 2034

Weighing Agents Market

Weighing Agents Market Size and Share Forecast Outlook 2025 to 2035

Draining Agents Market

Draining Agents Market Size and Share Forecast Outlook 2025 to 2035

Flatting Agents Market

Flatting Agents Market Size and Share Forecast Outlook 2025 to 2035

Clouding Agents Market

Clouding Agents Market Trends - Growth Factors & Industry Analysis

Cognitive Agents Market

Cognitive Agents Market Size and Share Forecast Outlook 2025 to 2035

Anti-Acne Agents Market

Anti-Acne Agents Market Size and Share Forecast Outlook 2025 to 2035

Flavoring Agents Market

Flavoring Agents Market Size and Share Forecast Outlook 2025 to 2035

Leavening Agents Market

Leavening Agents Market Analysis - Size, Growth, and Forecast 2025 to 2035

Anti-Slip Agents Market Share Analysis

Market Share Breakdown of Anti-Slip Agents Manufacturers

Coalescing Agents Market

Coalescing Agents Market Size and Share Forecast Outlook 2025 to 2035

Mattifying Agents Market

Mattifying Agents Market Size and Share Forecast Outlook 2025 to 2035

Biocontrol Agents Market

Biocontrol Agents Market Size and Share Forecast Outlook 2025 to 2035

Future Market Insights

Anti-Puffiness Agents Market

Chat With MaRIA

Chat With

MaRIA

Hi There, I am MaRIA, Your Market Research Intelligence Assistant. How may I help you?