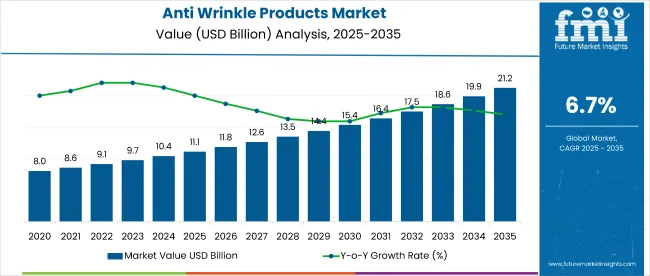
The Anti-Wrinkle Products Market is expected to record a valuation of USD 10,802.7 million in 2025 and USD 22,903.2 million in 2035, with an increase of USD 12,100.5 million, which equals a growth of 193% over the decade. The overall expansion represents a CAGR of 7.8% and a 2X increase in market size.
Anti-Wrinkle Products Market Key Takeaways
| Metric | Value |
|---|---|
| Anti-Wrinkle Products Market Estimated Value in (2025E) | USD 10,802.7 million |
| Anti-Wrinkle Products Market Forecast Value in (2035F) | USD 22,903.2 million |
| Forecast CAGR (2025 to 2035) | 7.8% |
During the first five-year period from 2025 to 2030, the market increases from USD 10,802.7 million to USD 15,729.5 million, adding USD 4,926.8 million, which accounts for 41% of the total decade growth. This phase records steady adoption of serums and creams, with serums leading at 44.3% share in 2025. Retinol & retinoids remain the dominant active ingredients, representing 42.3% of total value in 2025, driven by their proven efficacy in reducing fine lines.
The second half from 2030 to 2035 contributes USD 7,173.7 million, equal to 59% of total growth, as the market jumps from USD 15,729.5 million to USD 22,903.2 million. This acceleration is powered by Asia-Pacific demand, particularly China (13.7% CAGR) and India (15.4% CAGR), alongside digital-first retail adoption. Advanced formulations featuring peptides, hyaluronic acid, and vitamin C gain prominence, while e-commerce and specialty beauty retail expand their distribution share.
From 2020 to 2024, the Anti-Wrinkle Products Market expanded steadily as consumer adoption of creams and serums drove demand, particularly in North America and Europe. Global beauty multinationals such as Estée Lauder, L’Oréal, and Shiseido held strong positions, collectively shaping over 40% of branded revenues. Differentiation in this period relied on ingredient innovation (retinol, hyaluronic acid, peptides), dermatology-backed claims, and premium distribution through specialty beauty retail and department stores. Digital commerce began to gain traction but accounted for less than 20% of total sales.
By 2025, demand for Anti-Wrinkle Products is expected to reach USD 10.8 billion, with serums accounting for the largest share. The competitive mix is shifting as e-commerce and direct-to-consumer (D2C) channels expand, driving brand accessibility and consumer engagement. Traditional leaders are investing in AI-powered skin diagnostics, subscription-based skincare routines, and personalized formulations to defend share. New entrants, particularly Asian beauty brands and indie skincare innovators, are leveraging natural actives, clean-label positioning, and rapid digital scaling to disrupt incumbents. Competitive advantage is increasingly moving away from heritage branding alone toward ecosystem strength, personalization, and omnichannel distribution.
The market is expanding as younger demographics increasingly adopt concentrated serums for preventive skincare. Unlike traditional creams, serums offer higher active ingredient potency, with retinol and peptide-based solutions gaining preference. In 2025, serums already account for 44.3% of the global market, signaling a strong shift toward targeted, high-efficacy products. This transition reflects not only demand for treatment but also prevention, effectively widening the consumer base beyond mature skin segments.
China and India are driving structural market expansion, posting CAGRs of 13.7% and 15.4% respectively between 2025 and 2035. Rising disposable incomes, coupled with a cultural emphasis on youthful appearance, are fueling demand for anti-wrinkle solutions. Digital-first retail in these regions, particularly e-commerce beauty platforms, enhances accessibility and adoption rates. This regional acceleration contributes disproportionately to global growth, making Asia-Pacific the decisive driver of incremental revenue compared to mature Western markets.
The Anti-Wrinkle Products Market is segmented by product type, key ingredients, skin concern, distribution channel, end user, and region. Product types include serums, creams & lotions, ampoules, sheet masks, and overnight repair treatments, each addressing varying consumer routines. By key ingredients, the market covers retinol & retinoids, peptides, vitamin C, hyaluronic acid, and coenzyme Q10, driving efficacy differentiation. Skin concerns span fine lines, deep wrinkles, loss of elasticity, and photoaging. Distribution channels include e-commerce, pharmacies/drugstores, department stores, specialty beauty retail, and dermatology clinics. End users comprise women, men, unisex, and mature skin (50+). Regionally, the market is analyzed across North America, Latin America, Europe, East Asia, South Asia & Pacific, and the Middle East & Africa.
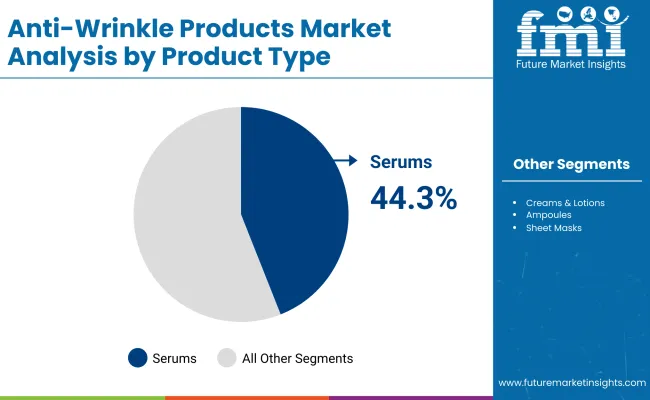
| Product Type | Value Share% 2025 |
|---|---|
| Serums | 44.3% |
| Others | 55.7% |
The serum segment is projected to contribute 44.3% of the Anti-Wrinkle Products Market revenue in 2025, maintaining its lead as the dominant product category. Growth is driven by strong consumer preference for high-concentration formulations offering targeted wrinkle treatment and preventive skincare benefits. Serums are increasingly adopted by younger consumers for early-age intervention, extending the addressable base beyond mature demographics.
The segment’s expansion is further supported by the integration of active ingredients such as retinol, peptides, and vitamin C, which enhance clinical efficacy and consumer trust. Additionally, premium positioning and higher price realization provide stronger revenue contribution compared to mass-market creams. With increasing personalization in skincare and e-commerce accessibility, the serum category is expected to retain its leadership as the core driver of value growth in the Anti-Wrinkle Products Market.
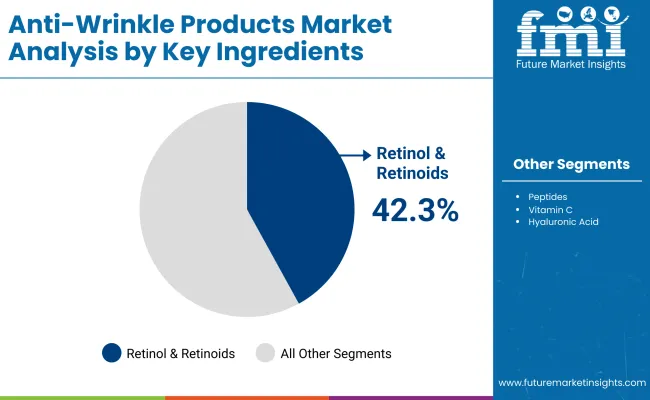
| Key Ingredients | Value Share% 2025 |
|---|---|
| Retinol & retinoids | 42.3% |
| Others | 57.7% |
The retinol & retinoids segment is forecasted to hold 42.3% of the market share in 2025, led by its proven clinical efficacy in reducing wrinkles, fine lines, and photoaging. Retinol-based formulations remain the most trusted choice among dermatologists and consumers alike, given their ability to accelerate skin renewal and collagen production.
Their broad integration across serums, creams, and overnight treatments has facilitated widespread adoption across both premium and mass-market brands. The segment’s growth is further supported by advancements in stabilized retinol formulations that minimize irritation while improving long-term effectiveness.
As consumer awareness of scientifically validated ingredients rises, retinol and retinoids are expected to retain their dominance as the gold-standard active in anti-wrinkle products, even as peptides and antioxidants gain share in complementary roles.
<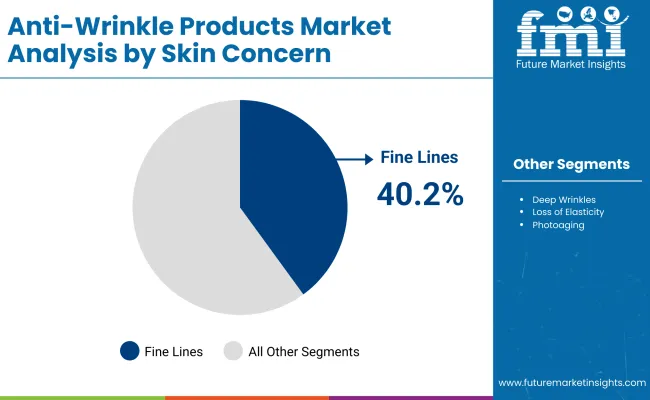
| Skin Concern | Value Share% 2025 |
|---|---|
| Fine lines | 40.2% |
| Others | 59.8% |
The fine lines segment is projected to account for 40.2% of the Anti-Wrinkle Products Market revenue in 2025, establishing it as the leading skin concern category. Fine lines represent the earliest visible signs of skin aging, prompting consumers to seek preventive and corrective solutions at a younger age. This concern is particularly addressed through serums and retinol-based formulations, which are positioned as high-efficacy treatments for delaying progression to deeper wrinkles. Increased adoption among consumers in their 20s and 30s has expanded the addressable market beyond mature demographics, fueling sustained demand.
With rising consumer awareness, early intervention skincare is becoming mainstream, making fine line management the entry point into the anti-wrinkle category. As preventive beauty continues to grow, fine lines are expected to remain the dominant driver of product adoption across all age groups.
Rising Demand for Preventive Skincare Among Younger Consumers
The Anti-Wrinkle Products Market is witnessing growth as consumers in their 20s and 30s increasingly adopt preventive skincare. Fine lines, representing 40.2% of concerns in 2025, drive early intervention with serums and retinol-based formulations. This shift expands the addressable market beyond mature demographics, creating sustained demand. The adoption of serums holding 44.3% share in 2025further strengthens this driver, as younger buyers seek targeted, high-potency products to maintain long-term skin health and delay visible signs of aging.
Rapid Expansion of Asia-Pacific Markets
China and India are fueling global growth, posting CAGRs of 13.7% and 15.4% respectively during 2025-2035. These economies benefit from rising disposable incomes, cultural emphasis on youthful appearance, and rapid e-commerce adoption. Digital-first beauty platforms in these markets increase accessibility and product discovery, amplifying adoption. With Western markets such as the USA and Europe growing at slower single-digit rates, Asia-Pacific becomes the largest incremental revenue contributor, reshaping competitive strategies and prioritizing regional product launches tailored to consumer preferences.
Regulatory and Formulation Challenges with Active Ingredients
Despite growth potential, the market faces headwinds from stringent regulatory frameworks around active ingredients such as retinol, peptides, and vitamin C. Variations in permissible concentrations across the USA, EU, and Asia complicate formulation standardization for global brands. This creates higher R&D costs, compliance complexity, and slower product rollout timelines. Additionally, consumer concerns over potential irritation and sensitivity to high-potency actives can limit adoption, particularly in first-time users, constraining uniform global scaling of anti-wrinkle product portfolios.
Personalization and AI-Powered Skin Diagnostics
A major trend shaping the Anti-Wrinkle Products Market is the rise of personalization powered by AI-driven skin analysis. Brands are increasingly offering diagnostic tools, both online and in dermatology clinics, to assess fine lines, elasticity, and photoaging in real time. These insights are used to recommend customized regimens combining serums, creams, and active ingredients like retinol or peptides. By aligning formulations with individual skin profiles, companies enhance consumer trust, increase repeat purchases, and differentiate from generic offerings in a competitive market.
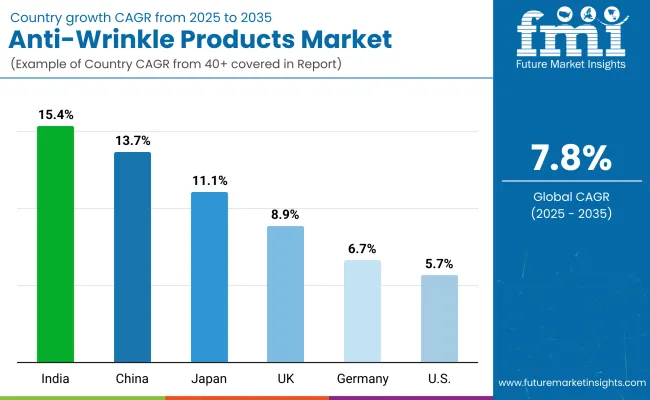
| Countries | Estimated CAGR (2025 to 2035) |
|---|---|
| China | 13.7% |
| USA | 5.7% |
| India | 15.4% |
| UK | 8.9% |
| Germany | 6.7% |
| Japan | 11.1% |
The global Anti-Wrinkle Products Market shows clear regional disparities in adoption speed, driven by income growth, consumer demographics, and channel dynamics.
Asia-Pacific emerges as the fastest-growing region, anchored by India at 15.4% CAGR and China at 13.7% CAGR. India’s surge is supported by rising middle-class incomes, rapid urbanization, and growing exposure to premium skincare via e-commerce platforms. China benefits from a mature beauty ecosystem, strong demand for serums, and consumer trust in retinol and peptide-based actives. Together, these two markets account for the largest incremental global revenue expansion through 2035.
Japan also demonstrates robust growth at 11.1% CAGR, reflecting its established beauty culture and rising adoption of hybrid formulations blending traditional botanicals with modern actives. Europe maintains a steady profile, led by the UK at 8.9% CAGR and Germany at 6.7% CAGR, driven by aging demographics, high per-capita spending on skincare, and strong penetration of dermatology-backed brands. Regulatory emphasis on ingredient safety and clean-label cosmetics further reinforces consumer confidence.
North America shows moderate expansion, with the USA growing at 5.7% CAGR, reflecting market maturity and strong competition among leading global brands. Growth here is increasingly driven by innovation in personalization, AI-based skin diagnostics, and digital-first retail strategies rather than pure volume expansion.
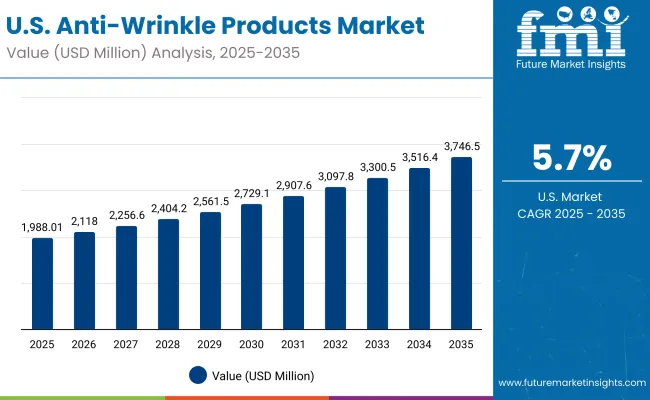
| Year | USA Anti-Wrinkle Products Market (USD Million) |
|---|---|
| 2025 | 1988.01 |
| 2026 | 2118.07 |
| 2027 | 2256.63 |
| 2028 | 2404.26 |
| 2029 | 2561.55 |
| 2030 | 2729.13 |
| 2031 | 2907.67 |
| 2032 | 3097.89 |
| 2033 | 3300.56 |
| 2034 | 3516.49 |
| 2035 | 3746.54 |
The Anti-Wrinkle Products Market in the United States is projected to grow at a CAGR of 5.7% between 2025 and 2035, expanding from USD 1.99 billion in 2025 to USD 3.75 billion in 2035. Growth is supported by a maturing aging population, rising consumer awareness of retinol- and peptide-based formulations, and increased demand for serums and overnight repair treatments.
E-commerce platforms and specialty beauty retail chains are reshaping distribution, while dermatology-backed brands continue to gain trust among older consumers. Younger demographics are driving preventive skincare adoption, especially for fine lines, which accounted for 40.2% of global concerns in 2025. Competition among established players such as Estée Lauder, Clinique, and Neutrogena is intensifying, with investments in personalization tools and AI-driven diagnostics strengthening their USA market strategies.
Key USA Market Insights
The Anti-Wrinkle Products Market in the United Kingdom is expected to grow at a CAGR of 8.9% between 2025 and 2035, supported by a rising aging population, strong consumer adoption of preventive skincare, and the growing presence of dermatology-endorsed brands. Demand is concentrated in serums and creams, particularly retinol and peptide-based formulations, as consumers prioritize clinically validated anti-aging solutions.
The expansion of specialty beauty retail chains and the rapid shift toward online skincare platforms are reshaping distribution, making premium brands more accessible across regions. The UK market also benefits from stringent cosmetic safety regulations, which enhance consumer trust and favor established players like L’Oréal, Estée Lauder, and Clinique. Younger demographics increasingly adopt preventive anti-wrinkle products, broadening the consumer base beyond the mature 50+ segment.
Key UK Market Insights
India is witnessing rapid growth in the Anti-Wrinkle Products Market, which is forecast to expand at a CAGR of 15.4% through 2035, making it the fastest-growing country globally. Rising disposable incomes, increased urbanization, and a growing aspirational middle class are driving demand for preventive and corrective skincare. Tier-2 and tier-3 cities are becoming major consumption hubs, supported by cost-effective product launches and expanded e-commerce penetration.
The Indian market is also shaped by young consumers embracing serums and retinol-based solutions earlier, reflecting rising awareness of anti-aging routines. Simultaneously, the 50+ demographic is increasingly investing in premium creams and treatments to maintain skin elasticity. Domestic and international brands are capitalizing on digital-first marketing and D2C models, enhancing reach across regions. Clean-label, Ayurvedic-inspired, and natural ingredient-based products are gaining traction, blending traditional remedies with modern efficacy.
Key India Market Insights
The Anti-Wrinkle Products Market in China is expected to grow at a CAGR of 13.7% between 2025 and 2035, the highest among leading economies. This momentum is fueled by rising disposable incomes, rapid urbanization, and the country’s strong beauty culture emphasizing youthful skin. Serums and retinol-based formulations are especially popular, supported by increasing dermatology endorsements and consumer preference for targeted, high-efficacy solutions.
China’s digital-first retail ecosystem is central to growth, with e-commerce platforms and social-commerce channels expanding accessibility and influencing purchase decisions. Domestic brands are gaining ground by offering cost-competitive products, while global leaders like L’Oréal and Estée Lauder continue to dominate the premium space. The blend of international prestige products and local innovation has created a highly competitive and dynamic market environment.
Key China Market Insights
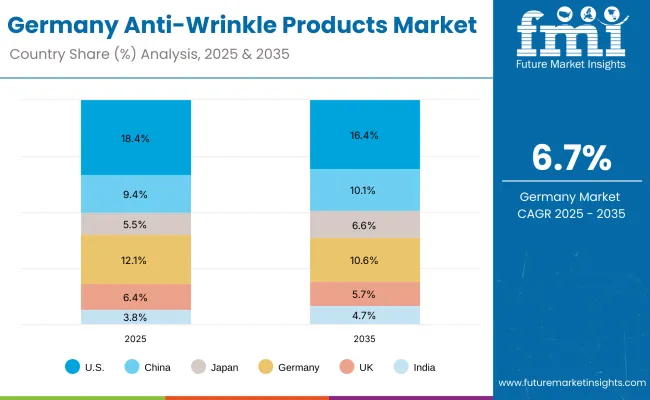
| Countries | 2025 Share (%) |
|---|---|
| USA | 18.4% |
| China | 9.4% |
| Japan | 5.5% |
| Germany | 12.1% |
| UK | 6.4% |
| India | 3.8% |
| Countries | 2035 Share (%) |
|---|---|
| USA | 16.4% |
| China | 10.1% |
| Japan | 6.6% |
| Germany | 10.6% |
| UK | 5.7% |
| India | 4.7% |
The Anti-Wrinkle Products Market in Germany is projected to grow at a CAGR of 6.7% from 2025 to 2035, reflecting steady but slower expansion compared to Asia-Pacific. Germany’s share of the global market is expected to decline slightly from 12.1% in 2025 to 10.6% in 2035, as faster-growing markets such as China and India capture more incremental revenue. Nonetheless, Germany remains a critical European hub due to its aging population, high skincare spending, and preference for premium, dermatology-endorsed products.
Consumer demand is strongly concentrated in creams and serums, with retinol and peptide-based formulations maintaining dominance. Growth is supported by rising awareness of preventive skincare among younger demographics, but the 50+ age group remains the core consumer base. Distribution is shifting toward pharmacies, specialty beauty retail, and e-commerce, where German consumers place high value on product safety, clinical validation, and sustainable packaging.
Key Germany Market Insights
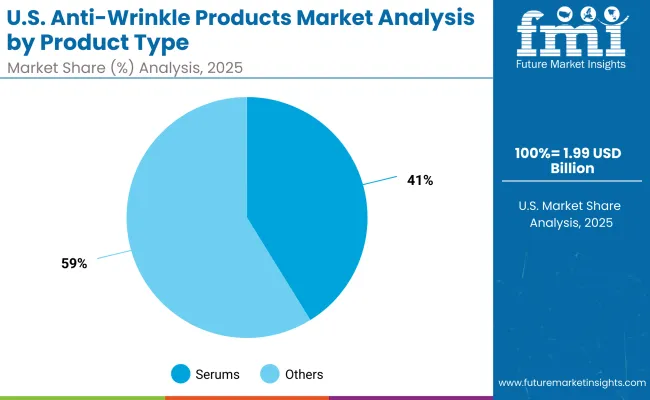
| USA By Product Type | Value Share% 2025 |
|---|---|
| Serums | 41.2% |
| Others | 58.8% |
The Anti-Wrinkle Products Market in the United States is projected to expand steadily, reaching USD 1.99 billion in 2025 and growing at a CAGR of 5.7% through 2035. Product segmentation highlights the strength of serums, which account for 41.2% of value share in 2025, driven by strong consumer trust in retinol- and peptide-based formulations. Other categories such as creams, overnight repair treatments, and masks collectively hold 58.8%, reflecting the breadth of consumer adoption across routines.
Market growth in the USA is anchored by an aging population, a shift toward preventive skincare among millennials and Gen Z, and continued dominance of global brands like Estée Lauder, Clinique, and Neutrogena. E-commerce platforms and specialty beauty retailers are accelerating reach, while dermatology-endorsed product claims remain a decisive purchase factor. Despite slower growth compared to Asia-Pacific, the USA retains its importance as a premium-driven and innovation-focused market.
Key USA Market Insights
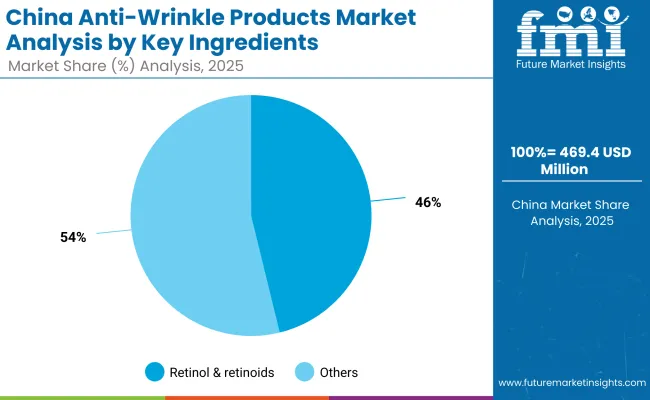
| China By Key Ingredients | Value Share% 2025 |
|---|---|
| Retinol & retinoids | 46.2% |
| Others | 53.8% |
The Anti-Wrinkle Products Market in China presents strong opportunities, with a projected CAGR of 13.7% from 2025 to 2035, making it one of the fastest-growing global markets. Retinol and retinoids, holding 46.2% share in 2025, remain the cornerstone of anti-wrinkle formulations, reflecting high consumer trust in clinically validated actives. Their widespread integration across serums, creams, and overnight treatments underscores their central role in product strategies.
China’s digital-first ecosystem creates a fertile ground for e-commerce and social-commerce expansion, with platforms such as Tmall and Douyin reshaping brand discovery and consumer engagement. Domestic players are seizing opportunities with competitively priced formulations, while global leaders such as Estée Lauder and L’Oréal dominate the premium space. Clean-label innovations and products tailored for sensitive skin are emerging as high-potential categories, particularly among younger consumers seeking preventive care.
Key China Market Opportunities
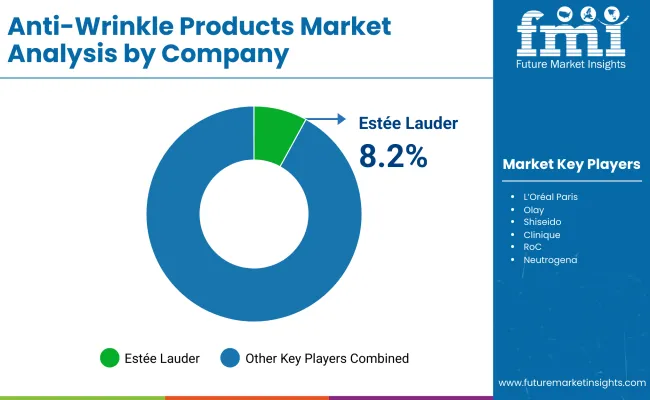
The Anti-Wrinkle Products Market is highly fragmented, with global multinationals, regional specialists, and emerging indie brands competing across segments. Estée Lauder leads globally with an 8.2% share in 2025, supported by strong brand equity in premium skincare, wide product portfolios, and global distribution networks. Its flagship brands such as Estée Lauder, Clinique, and La Mer continue to dominate the premium anti-wrinkle space.
L’Oréal, Shiseido, Olay, and Lancôme also hold significant positions, focusing on ingredient innovation (retinol, peptides, vitamin C) and digital-first retail strategies. These companies are expanding aggressively in Asia-Pacific, where rising consumer incomes and e-commerce adoption fuel double-digit growth. Neutrogena and RoC maintain competitive relevance in mid-market categories, leveraging dermatology-backed trust and pharmacy-based distribution.
At the same time, indie and local skincare brands are scaling rapidly through clean-label, natural formulations and direct-to-consumer (D2C) models. Their agility allows faster innovation cycles and strong resonance with younger consumers seeking transparency and affordability.
Competitive differentiation is shifting from legacy brand recognition toward personalization, AI-powered skin diagnostics, and e-commerce integration. Leaders are investing in customized formulations, subscription-based skincare regimens, and omnichannel distribution ecosystems, while challengers focus on affordability and authenticity.
Key Developments in Anti-Wrinkle Products Market
| Item | Value |
|---|---|
| Quantitative Units | USD 10,802.7 Million |
| Product Type | Serums, Creams & lotions, Ampoules, Sheet masks, Overnight repair treatments |
| Key Ingredients | Retinol & retinoids, Peptides, Vitamin C, Hyaluronic acid, Coenzyme Q10 |
| Skin Concern | Fine lines, Deep wrinkles, Loss of elasticity, Photoaging |
| Channel | E-commerce, Pharmacies/drugstores, Department stores, Specialty beauty retail, Dermatology clinics |
| End User | Women, Men, Unisex, Mature skin 50+ |
| Regions Covered | North America, Europe, Asia-Pacific, Latin America, Middle East & Africa |
| Country Covered | United States, Canada, Germany, France, United Kingdom, China, Japan, India, Brazil, South Africa |
| Key Companies Profiled | Estée Lauder, L’Oréal Paris, Olay, Shiseido, Clinique, RoC, Neutrogena, Lancôme, Kiehl’s, Elizabeth Arden |
| Additional Attributes | Dollar sales by product type and key ingredients, adoption trends in preventive skincare and dermatology-endorsed solutions, rising demand for serums and overnight repair treatments, segment-specific growth in fine lines and loss-of-elasticity categories, channel revenue segmentation across e-commerce, pharmacies, and specialty beauty retail, integration with AI-powered skin diagnostics and personalized regimens, regional trends influenced by income growth and digital-first retail in Asia-Pacific, and innovations in active formulations such as retinol, peptides, vitamin C, hyaluronic acid, and coenzyme Q10. |
The global Anti-Wrinkle Products Market is estimated to be valued at USD 10,802.7 million in 2025.
The market size for the Anti-Wrinkle Products Market is projected to reach USD 22,903.2 million by 2035.
The Anti-Wrinkle Products Market is expected to grow at a 7.8% CAGR between 2025 and 2035.
The key product types in the Anti-Wrinkle Products Market are serums, creams & lotions, ampoules, sheet masks, and overnight repair treatments. Among these, serums dominate due to their high concentration of active ingredients like retinol and peptides, holding a 44.3% value share in 2025.
In terms of product type, the serums segment is expected to command the most significant share, contributing 44.3% of total market value in 2025.


Full Research Suite comprises of:
Market outlook & trends analysis
Interviews & case studies
Strategic recommendations
Vendor profiles & capabilities analysis
5-year forecasts
8 regions and 60+ country-level data splits
Market segment data splits
12 months of continuous data updates
DELIVERED AS:
PDF EXCEL ONLINE
Western Europe Anti-wrinkle Products Market Analysis – Size, Share & Trends 2025 to 2035
Antimicrobial Hospital Textile Market Size and Share Forecast Outlook 2025 to 2035
Antibacterial Hydrophilic Aluminum Foil Market Forecast and Outlook 2025 to 2035
Antimicrobial Glass Powder Market Forecast and Outlook 2025 to 2035
Antimicrobial Cap Fitters Market Size and Share Forecast Outlook 2025 to 2035
Anti-aging Product Service and Device Market Size and Share Forecast Outlook 2025 to 2035
Antimony Trioxide Market Size and Share Forecast Outlook 2025 to 2035
Antimicrobial Powder Coating Market Size and Share Forecast Outlook 2025 to 2035
Antioxidant and Stabilizer Agents Market Size and Share Forecast Outlook 2025 to 2035
Antiperspirants and Deodorants Market Analysis - Size and Share Forecast Outlook 2025 to 2035
Antioxidant-Rich Skincare Market Analysis - Size and Share Forecast Outlook 2025 to 2035
Antimicrobial Skincare Market Analysis - Size and Share Forecast Outlook 2025 to 2035
Anti-Static Liners Market Size and Share Forecast Outlook 2025 to 2035
Anti-Fraud Management System Market Size and Share Forecast Outlook 2025 to 2035
Anti-Static Foam Pouch Market Size and Share Forecast Outlook 2025 to 2035
Antiepileptic Drug Market Size and Share Forecast Outlook 2025 to 2035
Antimycotics Market Size and Share Forecast Outlook 2025 to 2035
Anti-Creasing Agent Market Size and Share Forecast Outlook 2025 to 2035
Anti-Reflective Coatings Market Size and Share Forecast Outlook 2025 to 2035
Antibacterial Finishes Market Size and Share Forecast Outlook 2025 to 2035

Thank you!
You will receive an email from our Business Development Manager. Please be sure to check your SPAM/JUNK folder too.
Chat With
MaRIA