Artificial Ear Simulator Market Forecast and Outlook (2025–2035)

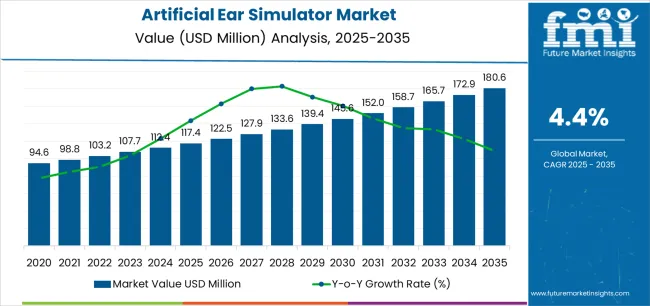
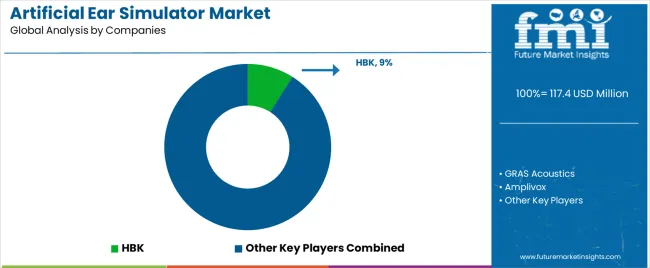
The global artificial ear simulator market is valued at USD 117.4 million in 2025 and is projected to reach USD 180.6 million by 2035, expanding at a CAGR of 4.4%. Rolling CAGR assessment shows gradual and sustained growth driven by continued advancements in acoustic measurement systems, hearing aid testing, and electroacoustic calibration standards. Artificial ear simulators are critical components in the evaluation of hearing instruments, headphones, and communication devices that replicate the human ear’s acoustic impedance characteristics with precision.

Manufacturing trends emphasize material consistency, precision machining, and digital signal integration to ensure accurate and repeatable measurements across wide frequency ranges. The increasing use of coupler-based and anthropometric simulators in R&D and compliance testing supports greater product standardization in both consumer audio and medical device industries.

North America and Europe continue to lead in adoption due to the presence of accredited testing laboratories and established electroacoustic certification procedures. Asia Pacific is displaying rising production capacity as regional firms expand calibration and testing capabilities. Component quality, dimensional stability, and standard conformity remain central to product acceptance. The market’s upward trajectory through 2035 reflects steady institutional investment in auditory measurement reliability and device validation infrastructure.
Quick Stats for the Artificial Ear Simulator Market

  • Artificial Ear Simulator Market Value (2025): USD 117.4 million
  • Artificial Ear Simulator Market Forecast Value (2035): USD 180.6 million
  • Artificial Ear Simulator Market Forecast CAGR (2025 to 2035): 4.4%
  • Leading Type in Artificial Ear Simulator Market: Standard Ear Simulator
  • Key Growth Regions: North America, Europe, and East Asia
  • Top Players: HBK, GRAS Acoustics, Amplivox, Brüel & Kjær (NSK Ltd), Larson Davis, Respond Technology, HEAD acoustics, Klippel GmbH, ACO Pacific, Durham Instruments, Starkey Hearing Technologies, BSWA Technology, CRYSOUND, Fangbo Technology (Shenzhen), Hangzhou AIHUA Instruments, Listen, Inc.

Artificial Ear Simulator Market Market Value Analysis

Artificial Ear Simulator Market Year-over-Year Forecast (2025–2035)

Between 2025 and 2030, the Artificial Ear Simulator Market is projected to expand from USD 117.4 million to USD 145.6 million, reflecting a 24.0% increase and accounting for 45.8% of the decade’s total growth. This expansion will be fueled by rising demand for precise acoustic measurement systems used in testing hearing aids, earphones, and audio devices. Increasing regulatory standards for electroacoustic performance validation, coupled with the growth of audiological research and hearing technology development, will accelerate adoption. Manufacturers are enhancing simulator accuracy through improved frequency response, better ear canal replication, and integration with advanced digital analysis software.

From 2030 to 2035, the market is forecast to grow from USD 145.6 million to USD 180.6 million, registering a 24.0% increase and contributing 54.2% of the decade’s overall expansion. Growth during this phase will be driven by advancements in calibration technology, automation, and hybrid simulation systems that combine physical and digital modeling. The proliferation of wireless audio devices, miniaturized hearing solutions, and personalized sound systems will further boost the demand for high-precision artificial ear simulators. Strategic partnerships between acoustic research institutions and measurement equipment manufacturers will foster innovation, standardization, and global market competitiveness across the audio testing industry.

Artificial Ear Simulator Market Key Takeaways

Metric Value
Market Value (2025) USD 117.4 million
Market Forecast Value (2035) USD 180.6 million
Forecast CAGR (2025–2035) 4.4%

Why Is the Artificial Ear Simulator Market Experiencing Steady Expansion Across Acoustic Testing Fields?

The artificial ear simulator market is expanding as precision requirements in acoustic measurement, hearing aid testing, and audio device certification increase. These simulators replicate the acoustic impedance and sound transmission characteristics of the human ear, allowing manufacturers and researchers to evaluate earphones, hearing aids, and communication headsets under standardized test conditions. The widespread implementation of international performance standards, such as IEC 60318, drives demand for calibrated and reproducible ear simulation systems that ensure measurement consistency across laboratories and production facilities.

Growth in the hearing aid and consumer audio sectors strengthens market adoption, particularly as miniaturized in-ear devices and true wireless products require accurate low-volume sound field assessment. Research institutions and acoustic engineering firms employ artificial ear systems for product validation, signal response optimization, and noise reduction analysis. Advancements in sensor technology and 3D ear geometry modeling improve simulation realism and measurement precision. Manufacturers prioritize durable materials, stable coupling mechanisms, and digital interface compatibility to streamline calibration and data acquisition. However, high equipment costs and the need for regular calibration limit accessibility among smaller testing entities. Continued progress in auditory modeling and rising emphasis on device performance verification support sustained market development across medical, industrial, and consumer acoustics domains.

How Is the Artificial Ear Simulator Market Segmented by Product Type, Application, and Region?

The artificial ear simulator market is segmented by product type, application, and region. By product type, the market is divided into standard ear simulator and occluded ear simulator. Based on application, it is categorized into consumer electronics industry, hearing aid industry, and acoustic research. Regionally, the market is segmented into North America, Europe, East Asia, South Asia, Latin America, and the Middle East & Africa. These divisions outline usage trends and technological adoption across diverse sectors involved in acoustic testing and device validation.
By Product Type, Which Segment Leads the Artificial Ear Simulator Market?

Artificial Ear Simulator Market Analysis By Product Type

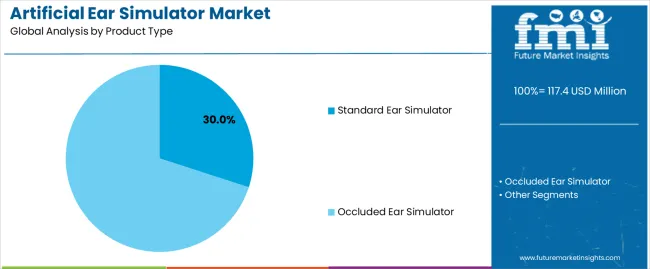
The standard ear simulator segment accounts for approximately 30.0% of the global artificial ear simulator market in 2025, representing the leading product category. Its dominance stems from its established use in the calibration and testing of audio devices, including headphones, microphones, and communication equipment. Standard ear simulators replicate the acoustic impedance and frequency response of the human ear canal, providing consistent reference conditions for electroacoustic measurements in laboratory and production environments.

These simulators are integral to performance evaluation within consumer electronics testing, ensuring compliance with international acoustic standards such as IEC 60318. Their broad applicability and ease of integration into automated testing setups contribute to their sustained demand. Manufacturers rely on standard ear simulators to verify device sound quality, sensitivity, and distortion characteristics across product lines. The segment also benefits from widespread acceptance by regulatory bodies and certification organizations, making it the default reference device for many testing protocols. Continued growth in portable audio and smart device production further supports the use of standard ear simulators, reinforcing their central role in maintaining measurement accuracy within global acoustic testing frameworks.
By Application, Which Segment Dominates Market Demand?

Artificial Ear Simulator Market Analysis By Application

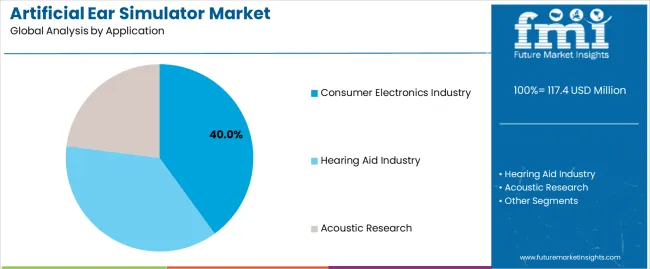
The consumer electronics industry segment represents about 40.0% of the total artificial ear simulator market in 2025, making it the largest application category. This leadership reflects the growing need for precise acoustic testing during the development and quality assurance of headphones, smartphones, earbuds, and other audio-enabled devices. Artificial ear simulators are essential tools in this sector, ensuring accurate measurement of sound pressure levels, frequency response, and distortion performance under conditions replicating human auditory characteristics.

Manufacturers in the consumer electronics industry use ear simulators to optimize acoustic designs and validate product performance in alignment with global measurement standards. The segment’s demand is reinforced by continuous expansion of audio device production in East Asia and rising product quality requirements across North American and European markets. Rapid product development cycles and miniaturization trends have increased reliance on standardized testing equipment capable of ensuring repeatable acoustic data. The segment’s prominence also reflects its direct connection to mass-market production, where consistent sound verification influences consumer experience and product reliability. As personal audio technologies evolve, the consumer electronics industry will continue to drive dominant demand for artificial ear simulators across global testing and manufacturing operations.

What are the Key Trends, Drivers, and Restraints in the Artificial Ear Simulator Market?

The artificial ear simulator market is expanding as auditory device testing, calibration and acoustic research demand greater accuracy. These simulators replicate human ear acoustics to assess headphones, hearing-aids and other transducers in controlled environments. Growth is supported by rising hearing impairment prevalence, increased headphone and wearable device usage, and stricter regulatory or industry standards for measurement performance. At the same time, high-precision equipment costs, calibration complexity and competition from alternative measurement methods restrict broader adoption. A notable trend is the move toward more automated, miniaturised and digitally integrated simulators, allowing higher throughput and remote or field-based testing.

What factors are driving growth in the artificial ear simulator market?

Growth is driven by the rising deployment of hearing aids, earbuds and other in-ear audio devices paired with the need for reliable testing of acoustic performance. As consumer audio consumption expands and hearing health receives greater attention, measurement accuracy becomes a priority for manufacturers and regulators alike. Furthermore, the aging global population and increase in hearing disorders elevate demand for audiometric equipment and quality control systems. The adoption of comprehensive test standards in audio and medical sectors also stimulates demand for ear simulators equipped to deliver compliant results.

What restraints are limiting market expansion?

Adoption is constrained by the high cost of advanced ear simulators and the operational demands of calibration and maintenance. These devices often require specialised labs, trained personnel and frequent calibration to ensure measurement validity. Some regions or smaller device manufacturers may lack resources or infrastructure to deploy advanced simulators. Additionally, alternative lower-cost measurement tools or less rigorous testing protocols may suffice for some applications, reducing the urgency to invest in premium simulators. These economic and implementation challenges hinder faster market penetration.

What key trends are shaping future market development?

The market is trending toward automation, modularity and digital connectivity in ear simulators. Systems with remote calibration capability, cloud-based data tracking and integration with test software simplify workflows and support higher throughput. Manufacturers are developing smaller footprint simulators suitable for rapid testing of earbuds, wearables and mobile devices. Growth in emerging regions is notable as audio-device manufacturing expands and regulatory frameworks evolve. As test requirements and device complexity increase, simulators that offer flexibility, reproducibility and integration with digital ecosystems are becoming increasingly preferred.
What is the Analysis of the Artificial Ear Simulator Market by Key Country?

Artificial Ear Simulator Market Cagr Analysis By Country

Country CAGR (%)
China 5.9%
India 5.5%
Germany 5.1%
Brazil 4.6%
USA 4.2%
UK 3.7%
Japan 3.3%

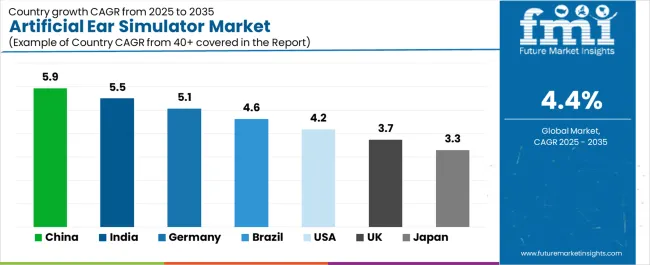
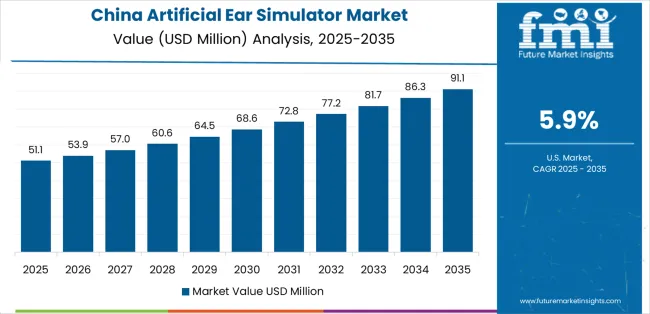
The artificial ear simulator market is showing steady global advancement, with China leading at a 5.9% CAGR through 2035, driven by expanding audiology research, domestic manufacturing growth, and increased clinical testing adoption. India follows at 5.5%, supported by rising healthcare investments, medical device innovation, and broader audiological awareness. Germany records 5.1%, leveraging engineering excellence and precision acoustics technology. Brazil grows at 4.6%, reflecting the development of healthcare infrastructure and diagnostic modernization. The USA, with a 4.2% CAGR, remains a mature market emphasizing R&D and calibration accuracy. The UK (3.7%) and Japan (3.3%) sustain steady growth through innovation in simulation equipment, product refinement, and adherence to international acoustic testing standards.

The report covers an in-depth analysis of 40+ countries top-performing countries are highlighted below.
How Is Acoustic Testing Infrastructure Advancing Market Growth in China?

Artificial Ear Simulator Market Country Value Analysis

Revenue from artificial ear simulators in China is projected to grow at a CAGR of 5.9% through 2035, supported by rapid development in electroacoustic testing, consumer electronics manufacturing, and hearing device calibration. Expanding production of smartphones, headsets, and hearing aids is driving consistent adoption of ear simulators for performance verification. Government initiatives promoting domestic acoustics research and laboratory accreditation are strengthening technical capacity. Domestic manufacturers are improving measurement accuracy and standard compliance to align with international benchmarks.

  • Expansion in audio device manufacturing supports testing equipment demand.
  • Growth in hearing aid production increases calibration system utilization.
  • Laboratory accreditation programs strengthen acoustic testing reliability.
  • Domestic innovation enhances measurement precision and reproducibility.

Why Is Medical Device Production Strengthening Market Expansion in India?

Revenue from artificial ear simulators in India is increasing at a CAGR of 5.5%, driven by growing production of hearing aids, communication devices, and medical testing systems. Expansion in healthcare technology manufacturing and diagnostic equipment testing facilities is promoting adoption. Government initiatives to advance local electronic component production and medical device standardization support consistent market development. Partnerships between academic institutions and technology suppliers are expanding access to measurement and calibration systems.

  • Growth in hearing aid and communication device production sustains demand.
  • Policy support encourages investment in diagnostic testing equipment.
  • Local manufacturing programs strengthen market accessibility.
  • Collaboration between academia and industry improves calibration practices.

How Does Engineering Precision Sustain Market Competitiveness in Germany?

Revenue from artificial ear simulators in Germany is advancing at a CAGR of 5.1%, supported by established acoustic research institutions, precision engineering culture, and regulatory compliance in electroacoustic testing. Manufacturers of hearing devices and consumer electronics maintain consistent testing requirements aligned with international standards. Continuous innovation in acoustic transducer design and material technology supports product advancement. Integration of digital data acquisition and calibration automation further enhances testing reliability.

  • Engineering precision ensures consistent acoustic performance verification.
  • Regulatory adherence maintains strict testing and calibration standards.
  • Integration of automation improves testing reproducibility and accuracy.
  • Ongoing innovation in transducer materials supports device advancement.

Why Is Industrial Modernization Encouraging Market Growth in Brazil?

Revenue from artificial ear simulators in Brazil is projected to grow at a CAGR of 4.6%, supported by modernization of medical device production and testing facilities. Expanding demand for certified hearing aids and consumer acoustic devices is creating steady procurement opportunities. Local distributors are enhancing partnerships with global equipment manufacturers to improve access to standardized testing systems. Investment in acoustic measurement laboratories across research institutions is strengthening regional capability.

  • Expansion of hearing device production sustains equipment demand.
  • Partnerships with international firms improve technology transfer.
  • Growth in accredited testing facilities strengthens local capacity.
  • Standardization initiatives enhance product validation consistency.

How Do Regulatory Standards Support Market Expansion in the United States?

Revenue from artificial ear simulators in the United States is increasing at a CAGR of 4.2%, supported by regulatory standards in medical device testing and consumer electronics performance verification. Manufacturers of hearing aids, headsets, and audio systems employ ear simulators for precise electroacoustic measurements. Federal laboratory certification programs maintain consistent demand for accredited testing systems. Ongoing R&D in miniaturized acoustic sensors continues to expand the functional scope of simulators.

  • Strict testing standards ensure continued product certification activity.
  • Growth in audio and hearing device manufacturing sustains utilization.
  • Research in miniaturized sensors promotes innovation in design.
  • Federal certification programs support stable equipment investment.

Why Is Research Collaboration Sustaining Market Stability in the United Kingdom?

Revenue from artificial ear simulators in the United Kingdom is advancing at a CAGR of 3.7%, supported by research collaboration among universities, testing laboratories, and medical device manufacturers. Standardized calibration practices across hearing and audio technology testing are ensuring steady market activity. Ongoing academic projects in acoustic measurement science contribute to incremental improvements in simulator accuracy. Stable demand from healthcare and consumer electronics testing sectors supports long-term utilization.

  • Academic collaboration strengthens innovation in acoustic calibration.
  • Standardized protocols maintain consistent laboratory utilization.
  • Healthcare and electronics testing sustain equipment demand.
  • Continuous research supports product accuracy improvement.

How Does Precision Manufacturing Maintain Market Consistency in Japan?

Revenue from artificial ear simulators in Japan is growing at a CAGR of 3.3%, supported by precision manufacturing standards and the country’s leadership in acoustic measurement technology. Demand from hearing device producers, electronics firms, and research institutions remains steady. Domestic manufacturers prioritize miniaturization, component reliability, and calibration accuracy. Continuous refinement in acoustic transducer design ensures high-quality data acquisition and long-term product stability.
  • Precision manufacturing enhances measurement reliability and reproducibility.
  • Steady demand from hearing and electronics sectors maintains usage.
  • Research in acoustic components supports incremental improvement.
  • Focus on accuracy and stability ensures long-term competitiveness.

How Competitive Is the Global Artificial Ear Simulator Market and What Defines Its Strategic Landscape?

Artificial Ear Simulator Market Analysis By Company

The global artificial ear simulator market shows moderate concentration, characterized by established acoustic instrumentation manufacturers and specialized hearing simulation system providers. HBK leads the market through its integrated product range combining GRAS Acoustics and Brüel & Kjær (NSK Ltd), offering precision ear simulators for audiometric, electroacoustic, and research applications. GRAS Acoustics contributes specialized expertise in ear coupler design and standardized acoustic impedance systems supporting IEC and ANSI compliance. Amplivox and Larson Davis provide portable and laboratory-grade simulators targeting audiometer calibration and hearing protection testing. Respond Technology and HEAD acoustics focus on psychoacoustic evaluation and binaural simulation platforms designed for audio device testing.

Klippel GmbH maintains a strong position in electroacoustic characterization systems with integration of ear simulator modules for loudspeaker and headphone performance assessment. ACO Pacific and Durham Instruments emphasize modular acoustic measurement hardware supporting industrial and laboratory environments. Starkey Hearing Technologies applies simulation technology within hearing aid R&D, aligning product validation with clinical performance standards. BSWA Technology, CRYSOUND, and Fangbo Technology (Shenzhen) strengthen regional competition in Asia through cost-effective precision manufacturing and digital acoustic calibration.

Hangzhou AIHUA Instruments and Listen, Inc. expand competitiveness through integrated measurement systems combining hardware, signal analysis, and calibration software. Market differentiation is driven by acoustic accuracy, repeatability, and conformity to international testing standards, while strategic advantage relies on innovation in digital signal modeling, multi-channel calibration, and compatibility with automated testing environments.

Key Players in the Market

  • HBK
  • GRAS Acoustics
  • Amplivox
  • Brüel & Kjær (NSK Ltd)
  • Larson Davis
  • Respond Technology
  • HEAD acoustics
  • Klippel GmbH
  • ACO Pacific
  • Durham Instruments
  • Starkey Hearing Technologies
  • BSWA Technology
  • CRYSOUND
  • Fangbo Technology (Shenzhen)
  • Hangzhou AIHUA Instruments
  • Listen, Inc.

Report Scope of the Artificial Ear Simulator Market

Items Values
Quantitative Units (2025) USD million
Type (Product Type) Standard Ear Simulator, Occluded Ear Simulator
Application Consumer Electronics Industry, Hearing Aid Industry, Acoustic Research
Regions Covered North America, Europe, East Asia, South Asia, Latin America, Middle East & Africa, Eastern Europe
Countries Covered China, India, USA, Germany, Brazil, UK, Japan, and 40+ countries
Key Companies Profiled HBK, GRAS Acoustics, Amplivox, Brüel & Kjær (NSK Ltd), Larson Davis, Respond Technology, HEAD acoustics, Klippel GmbH, ACO Pacific, Durham Instruments, Starkey Hearing Technologies, BSWA Technology, CRYSOUND, Fangbo Technology, Hangzhou AIHUA Instruments, Listen, Inc.
Additional Attributes Dollar sales by product type and application; regional adoption trends across East Asia, North America, and Europe; compliance with IEC/ANSI acoustic standards; integration with automated test sequences and digital data acquisition; calibration and maintenance requirements; drivers such as in-ear device miniaturization, stricter certification standards, and high-throughput production testing; restraints including equipment cost and lab infrastructure needs.

Artificial Ear Simulator Market by Segments

Product Type:

  • Standard Ear Simulator
  • Occluded Ear Simulator

Application:

  • Consumer Electronics Industry
  • Hearing Aid Industry,
  • Acoustic Research

Region:

East Asia

  • China
  • Japan
  • South Korea
  • Taiwan
  • Rest of East Asia

Europe

  • Germany
  • UK
  • France
  • Italy
  • Spain
  • Switzerland
  • Nordic
  • BENELUX
  • Rest of Europe

North America

  • USA
  • Canada
  • Mexico

South Asia

  • India
  • Pakistan
  • Bangladesh
  • Rest of South Asia

Latin America

  • Brazil
  • Argentina
  • Chile
  • Rest of Latin America

Middle East & Africa

  • Kingdom of Saudi Arabia
  • Other GCC Countries
  • Turkey
  • South Africa
  • Other African Union
  • Rest of Middle East & Africa

Eastern Europe

  • Russia
  • Poland
  • Czech Republic

Rest of Eastern Europe

Frequently Asked Questions

How big is the artificial ear simulator market in 2025?

The global artificial ear simulator market is estimated to be valued at USD 117.4 million in 2025.

What will be the size of artificial ear simulator market in 2035?

The market size for the artificial ear simulator market is projected to reach USD 180.6 million by 2035.

How much will be the artificial ear simulator market growth between 2025 and 2035?

The artificial ear simulator market is expected to grow at a 4.4% CAGR between 2025 and 2035.

What are the key product types in the artificial ear simulator market?

The key product types in artificial ear simulator market are standard ear simulator and occluded ear simulator.

Which application segment to contribute significant share in the artificial ear simulator market in 2025?

In terms of application, consumer electronics industry segment to command 40.0% share in the artificial ear simulator market in 2025.

Table of Content

  1. Executive Summary
    • Global Market Outlook
    • Demand to side Trends
    • Supply to side Trends
    • Technology Roadmap Analysis
    • Analysis and Recommendations
  2. Market Overview
    • Market Coverage / Taxonomy
    • Market Definition / Scope / Limitations
  3. Market Background
    • Market Dynamics
      • Drivers
      • Restraints
      • Opportunity
      • Trends
    • Scenario Forecast
      • Demand in Optimistic Scenario
      • Demand in Likely Scenario
      • Demand in Conservative Scenario
    • Opportunity Map Analysis
    • Product Life Cycle Analysis
    • Supply Chain Analysis
    • Investment Feasibility Matrix
    • Value Chain Analysis
    • PESTLE and Porter’s Analysis
    • Regulatory Landscape
    • Regional Parent Market Outlook
    • Production and Consumption Statistics
    • Import and Export Statistics
  4. Global Market Analysis 2020 to 2024 and Forecast, 2025 to 2035
    • Historical Market Size Value (USD Million) Analysis, 2020 to 2024
    • Current and Future Market Size Value (USD Million) Projections, 2025 to 2035
      • Y to o to Y Growth Trend Analysis
      • Absolute $ Opportunity Analysis
  5. Global Market Pricing Analysis 2020 to 2024 and Forecast 2025 to 2035
  6. Global Market Analysis 2020 to 2024 and Forecast 2025 to 2035, By Product Type
    • Introduction / Key Findings
    • Historical Market Size Value (USD Million) Analysis By Product Type , 2020 to 2024
    • Current and Future Market Size Value (USD Million) Analysis and Forecast By Product Type , 2025 to 2035
      • Standard Ear Simulator
      • Occluded Ear Simulator
    • Y to o to Y Growth Trend Analysis By Product Type , 2020 to 2024
    • Absolute $ Opportunity Analysis By Product Type , 2025 to 2035
  7. Global Market Analysis 2020 to 2024 and Forecast 2025 to 2035, By Application
    • Introduction / Key Findings
    • Historical Market Size Value (USD Million) Analysis By Application, 2020 to 2024
    • Current and Future Market Size Value (USD Million) Analysis and Forecast By Application, 2025 to 2035
      • Consumer Electronics Industry
      • Hearing Aid Industry
      • Acoustic Research
    • Y to o to Y Growth Trend Analysis By Application, 2020 to 2024
    • Absolute $ Opportunity Analysis By Application, 2025 to 2035
  8. Global Market Analysis 2020 to 2024 and Forecast 2025 to 2035, By Region
    • Introduction
    • Historical Market Size Value (USD Million) Analysis By Region, 2020 to 2024
    • Current Market Size Value (USD Million) Analysis and Forecast By Region, 2025 to 2035
      • North America
      • Latin America
      • Western Europe
      • Eastern Europe
      • East Asia
      • South Asia and Pacific
      • Middle East & Africa
    • Market Attractiveness Analysis By Region
  9. North America Market Analysis 2020 to 2024 and Forecast 2025 to 2035, By Country
    • Historical Market Size Value (USD Million) Trend Analysis By Market Taxonomy, 2020 to 2024
    • Market Size Value (USD Million) Forecast By Market Taxonomy, 2025 to 2035
      • By Country
        • USA
        • Canada
        • Mexico
      • By Product Type
      • By Application
    • Market Attractiveness Analysis
      • By Country
      • By Product Type
      • By Application
    • Key Takeaways
  10. Latin America Market Analysis 2020 to 2024 and Forecast 2025 to 2035, By Country
    • Historical Market Size Value (USD Million) Trend Analysis By Market Taxonomy, 2020 to 2024
    • Market Size Value (USD Million) Forecast By Market Taxonomy, 2025 to 2035
      • By Country
        • Brazil
        • Chile
        • Rest of Latin America
      • By Product Type
      • By Application
    • Market Attractiveness Analysis
      • By Country
      • By Product Type
      • By Application
    • Key Takeaways
  11. Western Europe Market Analysis 2020 to 2024 and Forecast 2025 to 2035, By Country
    • Historical Market Size Value (USD Million) Trend Analysis By Market Taxonomy, 2020 to 2024
    • Market Size Value (USD Million) Forecast By Market Taxonomy, 2025 to 2035
      • By Country
        • Germany
        • UK
        • Italy
        • Spain
        • France
        • Nordic
        • BENELUX
        • Rest of Western Europe
      • By Product Type
      • By Application
    • Market Attractiveness Analysis
      • By Country
      • By Product Type
      • By Application
    • Key Takeaways
  12. Eastern Europe Market Analysis 2020 to 2024 and Forecast 2025 to 2035, By Country
    • Historical Market Size Value (USD Million) Trend Analysis By Market Taxonomy, 2020 to 2024
    • Market Size Value (USD Million) Forecast By Market Taxonomy, 2025 to 2035
      • By Country
        • Russia
        • Poland
        • Hungary
        • Balkan & Baltic
        • Rest of Eastern Europe
      • By Product Type
      • By Application
    • Market Attractiveness Analysis
      • By Country
      • By Product Type
      • By Application
    • Key Takeaways
  13. East Asia Market Analysis 2020 to 2024 and Forecast 2025 to 2035, By Country
    • Historical Market Size Value (USD Million) Trend Analysis By Market Taxonomy, 2020 to 2024
    • Market Size Value (USD Million) Forecast By Market Taxonomy, 2025 to 2035
      • By Country
        • China
        • Japan
        • South Korea
      • By Product Type
      • By Application
    • Market Attractiveness Analysis
      • By Country
      • By Product Type
      • By Application
    • Key Takeaways
  14. South Asia and Pacific Market Analysis 2020 to 2024 and Forecast 2025 to 2035, By Country
    • Historical Market Size Value (USD Million) Trend Analysis By Market Taxonomy, 2020 to 2024
    • Market Size Value (USD Million) Forecast By Market Taxonomy, 2025 to 2035
      • By Country
        • India
        • ASEAN
        • Australia & New Zealand
        • Rest of South Asia and Pacific
      • By Product Type
      • By Application
    • Market Attractiveness Analysis
      • By Country
      • By Product Type
      • By Application
    • Key Takeaways
  15. Middle East & Africa Market Analysis 2020 to 2024 and Forecast 2025 to 2035, By Country
    • Historical Market Size Value (USD Million) Trend Analysis By Market Taxonomy, 2020 to 2024
    • Market Size Value (USD Million) Forecast By Market Taxonomy, 2025 to 2035
      • By Country
        • Kingdom of Saudi Arabia
        • Other GCC Countries
        • Turkiye
        • South Africa
        • Other African Union
        • Rest of Middle East & Africa
      • By Product Type
      • By Application
    • Market Attractiveness Analysis
      • By Country
      • By Product Type
      • By Application
    • Key Takeaways
  16. Key Countries Market Analysis
    • USA
      • Pricing Analysis
      • Market Share Analysis, 2024
        • By Product Type
        • By Application
    • Canada
      • Pricing Analysis
      • Market Share Analysis, 2024
        • By Product Type
        • By Application
    • Mexico
      • Pricing Analysis
      • Market Share Analysis, 2024
        • By Product Type
        • By Application
    • Brazil
      • Pricing Analysis
      • Market Share Analysis, 2024
        • By Product Type
        • By Application
    • Chile
      • Pricing Analysis
      • Market Share Analysis, 2024
        • By Product Type
        • By Application
    • Germany
      • Pricing Analysis
      • Market Share Analysis, 2024
        • By Product Type
        • By Application
    • UK
      • Pricing Analysis
      • Market Share Analysis, 2024
        • By Product Type
        • By Application
    • Italy
      • Pricing Analysis
      • Market Share Analysis, 2024
        • By Product Type
        • By Application
    • Spain
      • Pricing Analysis
      • Market Share Analysis, 2024
        • By Product Type
        • By Application
    • France
      • Pricing Analysis
      • Market Share Analysis, 2024
        • By Product Type
        • By Application
    • India
      • Pricing Analysis
      • Market Share Analysis, 2024
        • By Product Type
        • By Application
    • ASEAN
      • Pricing Analysis
      • Market Share Analysis, 2024
        • By Product Type
        • By Application
    • Australia & New Zealand
      • Pricing Analysis
      • Market Share Analysis, 2024
        • By Product Type
        • By Application
    • China
      • Pricing Analysis
      • Market Share Analysis, 2024
        • By Product Type
        • By Application
    • Japan
      • Pricing Analysis
      • Market Share Analysis, 2024
        • By Product Type
        • By Application
    • South Korea
      • Pricing Analysis
      • Market Share Analysis, 2024
        • By Product Type
        • By Application
    • Russia
      • Pricing Analysis
      • Market Share Analysis, 2024
        • By Product Type
        • By Application
    • Poland
      • Pricing Analysis
      • Market Share Analysis, 2024
        • By Product Type
        • By Application
    • Hungary
      • Pricing Analysis
      • Market Share Analysis, 2024
        • By Product Type
        • By Application
    • Kingdom of Saudi Arabia
      • Pricing Analysis
      • Market Share Analysis, 2024
        • By Product Type
        • By Application
    • Turkiye
      • Pricing Analysis
      • Market Share Analysis, 2024
        • By Product Type
        • By Application
    • South Africa
      • Pricing Analysis
      • Market Share Analysis, 2024
        • By Product Type
        • By Application
  17. Market Structure Analysis
    • Competition Dashboard
    • Competition Benchmarking
    • Market Share Analysis of Top Players
      • By Regional
      • By Product Type
      • By Application
  18. Competition Analysis
    • Competition Deep Dive
      • HBK
        • Overview
        • Product Portfolio
        • Profitability by Market Segments (Product/Age /Sales Channel/Region)
        • Sales Footprint
        • Strategy Overview
          • Marketing Strategy
          • Product Strategy
          • Channel Strategy
      • GRAS Acoustics
      • Amplivox
      • Bruel & Kjaer (NSK Ltd)
      • Larson Davis
      • Respond Technology
      • HEAD acoustics
      • Klippel GmbH
      • ACO Pacific
      • Durham Instruments
      • Starkey Hearing Technologies
      • BSWA Technology
      • CRYSOUND
      • Fangbo Technology (Shenzhen)
      • Hangzhou AIHUA Instruments
      • Listen, Inc
  19. Assumptions & Acronyms Used
  20. Research Methodology

List of Tables

  • Table 1: Global Market Value (USD Million) Forecast by Region, 2020 to 2035
  • Table 2: Global Market Value (USD Million) Forecast by Product Type , 2020 to 2035
  • Table 3: Global Market Value (USD Million) Forecast by Application, 2020 to 2035
  • Table 4: North America Market Value (USD Million) Forecast by Country, 2020 to 2035
  • Table 5: North America Market Value (USD Million) Forecast by Product Type , 2020 to 2035
  • Table 6: North America Market Value (USD Million) Forecast by Application, 2020 to 2035
  • Table 7: Latin America Market Value (USD Million) Forecast by Country, 2020 to 2035
  • Table 8: Latin America Market Value (USD Million) Forecast by Product Type , 2020 to 2035
  • Table 9: Latin America Market Value (USD Million) Forecast by Application, 2020 to 2035
  • Table 10: Western Europe Market Value (USD Million) Forecast by Country, 2020 to 2035
  • Table 11: Western Europe Market Value (USD Million) Forecast by Product Type , 2020 to 2035
  • Table 12: Western Europe Market Value (USD Million) Forecast by Application, 2020 to 2035
  • Table 13: Eastern Europe Market Value (USD Million) Forecast by Country, 2020 to 2035
  • Table 14: Eastern Europe Market Value (USD Million) Forecast by Product Type , 2020 to 2035
  • Table 15: Eastern Europe Market Value (USD Million) Forecast by Application, 2020 to 2035
  • Table 16: East Asia Market Value (USD Million) Forecast by Country, 2020 to 2035
  • Table 17: East Asia Market Value (USD Million) Forecast by Product Type , 2020 to 2035
  • Table 18: East Asia Market Value (USD Million) Forecast by Application, 2020 to 2035
  • Table 19: South Asia and Pacific Market Value (USD Million) Forecast by Country, 2020 to 2035
  • Table 20: South Asia and Pacific Market Value (USD Million) Forecast by Product Type , 2020 to 2035
  • Table 21: South Asia and Pacific Market Value (USD Million) Forecast by Application, 2020 to 2035
  • Table 22: Middle East & Africa Market Value (USD Million) Forecast by Country, 2020 to 2035
  • Table 23: Middle East & Africa Market Value (USD Million) Forecast by Product Type , 2020 to 2035
  • Table 24: Middle East & Africa Market Value (USD Million) Forecast by Application, 2020 to 2035

List of Figures

  • Figure 1: Global Market Pricing Analysis
  • Figure 2: Global Market Value (USD Million) Forecast 2020-2035
  • Figure 3: Global Market Value Share and BPS Analysis by Product Type , 2025 and 2035
  • Figure 4: Global Market Y-o-Y Growth Comparison by Product Type , 2025-2035
  • Figure 5: Global Market Attractiveness Analysis by Product Type
  • Figure 6: Global Market Value Share and BPS Analysis by Application, 2025 and 2035
  • Figure 7: Global Market Y-o-Y Growth Comparison by Application, 2025-2035
  • Figure 8: Global Market Attractiveness Analysis by Application
  • Figure 9: Global Market Value (USD Million) Share and BPS Analysis by Region, 2025 and 2035
  • Figure 10: Global Market Y-o-Y Growth Comparison by Region, 2025-2035
  • Figure 11: Global Market Attractiveness Analysis by Region
  • Figure 12: North America Market Incremental Dollar Opportunity, 2025-2035
  • Figure 13: Latin America Market Incremental Dollar Opportunity, 2025-2035
  • Figure 14: Western Europe Market Incremental Dollar Opportunity, 2025-2035
  • Figure 15: Eastern Europe Market Incremental Dollar Opportunity, 2025-2035
  • Figure 16: East Asia Market Incremental Dollar Opportunity, 2025-2035
  • Figure 17: South Asia and Pacific Market Incremental Dollar Opportunity, 2025-2035
  • Figure 18: Middle East & Africa Market Incremental Dollar Opportunity, 2025-2035
  • Figure 19: North America Market Value Share and BPS Analysis by Country, 2025 and 2035
  • Figure 20: North America Market Value Share and BPS Analysis by Product Type , 2025 and 2035
  • Figure 21: North America Market Y-o-Y Growth Comparison by Product Type , 2025-2035
  • Figure 22: North America Market Attractiveness Analysis by Product Type
  • Figure 23: North America Market Value Share and BPS Analysis by Application, 2025 and 2035
  • Figure 24: North America Market Y-o-Y Growth Comparison by Application, 2025-2035
  • Figure 25: North America Market Attractiveness Analysis by Application
  • Figure 26: Latin America Market Value Share and BPS Analysis by Country, 2025 and 2035
  • Figure 27: Latin America Market Value Share and BPS Analysis by Product Type , 2025 and 2035
  • Figure 28: Latin America Market Y-o-Y Growth Comparison by Product Type , 2025-2035
  • Figure 29: Latin America Market Attractiveness Analysis by Product Type
  • Figure 30: Latin America Market Value Share and BPS Analysis by Application, 2025 and 2035
  • Figure 31: Latin America Market Y-o-Y Growth Comparison by Application, 2025-2035
  • Figure 32: Latin America Market Attractiveness Analysis by Application
  • Figure 33: Western Europe Market Value Share and BPS Analysis by Country, 2025 and 2035
  • Figure 34: Western Europe Market Value Share and BPS Analysis by Product Type , 2025 and 2035
  • Figure 35: Western Europe Market Y-o-Y Growth Comparison by Product Type , 2025-2035
  • Figure 36: Western Europe Market Attractiveness Analysis by Product Type
  • Figure 37: Western Europe Market Value Share and BPS Analysis by Application, 2025 and 2035
  • Figure 38: Western Europe Market Y-o-Y Growth Comparison by Application, 2025-2035
  • Figure 39: Western Europe Market Attractiveness Analysis by Application
  • Figure 40: Eastern Europe Market Value Share and BPS Analysis by Country, 2025 and 2035
  • Figure 41: Eastern Europe Market Value Share and BPS Analysis by Product Type , 2025 and 2035
  • Figure 42: Eastern Europe Market Y-o-Y Growth Comparison by Product Type , 2025-2035
  • Figure 43: Eastern Europe Market Attractiveness Analysis by Product Type
  • Figure 44: Eastern Europe Market Value Share and BPS Analysis by Application, 2025 and 2035
  • Figure 45: Eastern Europe Market Y-o-Y Growth Comparison by Application, 2025-2035
  • Figure 46: Eastern Europe Market Attractiveness Analysis by Application
  • Figure 47: East Asia Market Value Share and BPS Analysis by Country, 2025 and 2035
  • Figure 48: East Asia Market Value Share and BPS Analysis by Product Type , 2025 and 2035
  • Figure 49: East Asia Market Y-o-Y Growth Comparison by Product Type , 2025-2035
  • Figure 50: East Asia Market Attractiveness Analysis by Product Type
  • Figure 51: East Asia Market Value Share and BPS Analysis by Application, 2025 and 2035
  • Figure 52: East Asia Market Y-o-Y Growth Comparison by Application, 2025-2035
  • Figure 53: East Asia Market Attractiveness Analysis by Application
  • Figure 54: South Asia and Pacific Market Value Share and BPS Analysis by Country, 2025 and 2035
  • Figure 55: South Asia and Pacific Market Value Share and BPS Analysis by Product Type , 2025 and 2035
  • Figure 56: South Asia and Pacific Market Y-o-Y Growth Comparison by Product Type , 2025-2035
  • Figure 57: South Asia and Pacific Market Attractiveness Analysis by Product Type
  • Figure 58: South Asia and Pacific Market Value Share and BPS Analysis by Application, 2025 and 2035
  • Figure 59: South Asia and Pacific Market Y-o-Y Growth Comparison by Application, 2025-2035
  • Figure 60: South Asia and Pacific Market Attractiveness Analysis by Application
  • Figure 61: Middle East & Africa Market Value Share and BPS Analysis by Country, 2025 and 2035
  • Figure 62: Middle East & Africa Market Value Share and BPS Analysis by Product Type , 2025 and 2035
  • Figure 63: Middle East & Africa Market Y-o-Y Growth Comparison by Product Type , 2025-2035
  • Figure 64: Middle East & Africa Market Attractiveness Analysis by Product Type
  • Figure 65: Middle East & Africa Market Value Share and BPS Analysis by Application, 2025 and 2035
  • Figure 66: Middle East & Africa Market Y-o-Y Growth Comparison by Application, 2025-2035
  • Figure 67: Middle East & Africa Market Attractiveness Analysis by Application
  • Figure 68: Global Market - Tier Structure Analysis
  • Figure 69: Global Market - Company Share Analysis
Dashboard
Dashboard
Dashboard
Dashboard
Dashboard
Dashboard

Our Research Products

Full Research Suite

The "Full Research Suite" delivers actionable market intel, deep dives on markets or technologies, so clients act faster, cut risk, and unlock growth.

Competitor Leaderboard Report

The Leaderboard benchmarks and ranks top vendors, classifying them as Established Leaders, Leading Challengers, or Disruptors & Challengers.

Future Leaders Index

Locates where complements amplify value and substitutes erode it, forecasting net impact by horizon

Market Data & Forecasts

We deliver granular, decision-grade intel: market sizing, 5-year forecasts, pricing, adoption, usage, revenue, and operational KPIs—plus competitor tracking, regulation, and value chains—across 60 countries broadly.

Market Focus Report

Spot the shifts before they hit your P&L. We track inflection points, adoption curves, pricing moves, and ecosystem plays to show where demand is heading, why it is changing, and what to do next across high-growth markets and disruptive tech

Survey Report

Real-time reads of user behavior. We track shifting priorities, perceptions of today’s and next-gen services, and provider experience, then pace how fast tech moves from trial to adoption, blending buyer, consumer, and channel inputs with social signals (#WhySwitch, #UX).

Bespoke Reports

Partner with our analyst team to build a custom report designed around your business priorities. From analysing market trends to assessing competitors or crafting bespoke datasets, we tailor insights to your needs.

Supplier Intelligence

Discovery & Profiling

Capacity & Footprint

Performance & Risk

Compliance & Governance

Commercial Readiness

Who Supplies Whom

Scorecards & Shortlists

Playbooks & Docs

Category Intelligence

Definition & Scope

Demand & Use Cases

Cost Drivers

Market Structure

Supply Chain Map

Trade & Policy

Operating Norms

Deliverables

Buyer Intelligence

Account Basics

Spend & Scope

Procurement Model

Vendor Requirements

Terms & Policies

Entry Strategy

Pain Points & Triggers

Outputs

Pricing Analysis

Benchmarks

Trends

Should-Cost

Indexation

Landed Cost

Commercial Terms

Deliverables

Brand Analysis

Positioning & Value Prop

Share & Presence

Customer Evidence

Go-to-Market

Digital & Reputation

Compliance & Trust

KPIs & Gaps

Outputs

Full Research Suite comprises of:

Market outlook & trends analysis

Market outlook & trends analysis

Interviews & case studies

Interviews & case studies

Strategic recommendations

Strategic recommendations

Vendor profiles & capabilities analysis

Vendor profiles & capabilities analysis

5-year forecasts

5-year forecasts

8 regions and 60+ country-level data splits

8 regions and 60+ country-level data splits

Market segment data splits

Market segment data splits

12 months of continuous data updates

12 months of continuous data updates

DELIVERED AS:

PDF EXCEL ONLINE

Full Research Suite


$5000

$7500

$10000

Buy Report Now
Similar Industry Reports

Similar Industry Reports

Artificial Intelligence (chipset) Market

Artificial Intelligence (chipset) Market Forecast and Outlook 2025 to 2035

Artificial Insemination Market

Artificial Insemination Market Size and Share Forecast Outlook 2025 to 2035

Artificial Intelligence in Construction Market

Artificial Intelligence in Construction Market Size and Share Forecast Outlook 2025 to 2035

Artificial Intelligence in Telecommunication Market

Artificial Intelligence in Telecommunication Market Size and Share Forecast Outlook 2025 to 2035

Artificial Urinary Sphincter Market

Artificial Urinary Sphincter Market Size and Share Forecast Outlook 2025 to 2035

Artificial Lift Systems Market

Artificial Lift Systems Market Size and Share Forecast Outlook 2025 to 2035

Artificial Intelligence in Retail Market

Artificial Intelligence in Retail Market Size and Share Forecast Outlook 2025 to 2035

Artificial Intelligence (AI) in Automotive Market

Artificial Intelligence (AI) in Automotive Market Size and Share Forecast Outlook 2025 to 2035

Artificial Intelligent Packaging Market

Artificial Intelligent Packaging Market Size and Share Forecast Outlook 2025 to 2035

Artificial Intelligence in Healthcare Market

Artificial Intelligence in Healthcare Market Size, Growth, and Forecast for 2025 to 2035

Artificial Ventilation and Anaesthesia Masks Market

Artificial Ventilation and Anaesthesia Masks Market Size and Share Forecast Outlook 2025 to 2035

Artificial Intelligence In Cybersecurity Market

Artificial Intelligence In Cybersecurity Market Size and Share Forecast Outlook 2025 to 2035

Artificial Pancreas Device Market

Artificial Pancreas Device Market Size and Share Forecast Outlook 2025 to 2035

Artificial Flower Market

Artificial Flower Market Analysis by Growth, Trends and Forecast from 2025 to 2035

Artificial Preservative Market

Artificial Preservative Market Outlook by Product, Type, Form, End Use Application and Others Through 2035

Artificial Hair Integration Market

Artificial Hair Integration Market Growth - Trends & Forecast 2025 to 2035

Artificial Intelligence in Military Market

Artificial Intelligence in Military Market Analysis - Size & Forecast 2025 to 2035

Artificial Sweetener Market

Analysis and Growth Projections for Artificial Sweetener Business

Artificial Turf Market

Artificial Turf Market Growth & Trends 2024-2034

Artificial Plants Market

Artificial Plants Market

Future Market Insights

Artificial Ear Simulator Market

Chat With MaRIA

Chat With

MaRIA

Hi There, I am MaRIA, Your Market Research Intelligence Assistant. How may I help you?