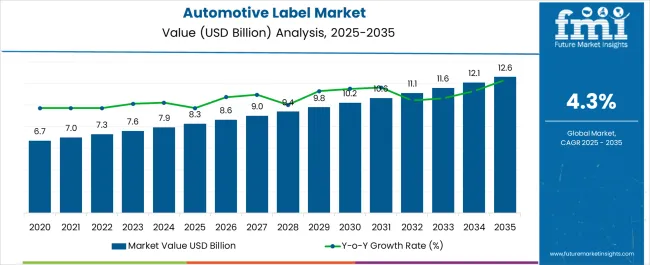
The global automotive labels market is likely to be valued at USD 7,603.99 million in 2023 and is predicted to secure a slow-paced CAGR of 4.3% during the forecast period. The market is expected to be worth USD 11,584.7 million by 2033. A historical CAGR of 3.5% has been recorded during the analysis by Future Market Insights.
Report Attribute | Details |
---|---|
Automotive Labels Market Value (2023) | USD 7,603.99 million |
Automotive Labels Anticipated Value (2033) | USD 11,584.7 million |
Automotive Labels Projected Growth Rate (2023 to 2033) | 4.3% |
Labeling is identified to be the procedure of assigning short names to the products for differentiating them from one another or other brands. Automotive labels are used in automotive for brand recognition to differentiate them from others and create a brand image in the market.
Custom automotive labels are also being used for the identification of the different parts for information and safety concerns. There is a rising demand for smart labels like RFID and bar codes for automotive’s part identification.
Moreover, the rising usage of automobiles and the increase in tagging and security markets to secure the products are the prime factors driving the growth of the automotive labels market. Therefore, it is anticipated that the automotive labels market is likely to witness significant growth during the forecast period.
Many factors are contributing majorly to the expansion of the automotive labels market, which is likely to fuel a steady growth of the concerned market in the coming years.
Recognition of information: Automobile labels are used for recognizing information written or printed on a cloth, polymer, paper, or other material attached to a particular vehicle’s parts. These labels are manufactured to withstand harsh weather conditions and provide identification, safety, usage information, and dating for consumer verification.
These labels are manufactured with acrylic films available in white lettering or black lettering. Thus, the ability of these labels to withstand any weather and the customized design requirements are anticipated to bring extensive growth to the automotive labels market.
Rising Disposable Income: There is a rise in the disposable income of many individuals around the globe, which has accelerated the sales of vehicles across the globe, further bolstering the demand for automotive labels.
Furthermore, the expanding urbanization among the various regions is also pushing the growth of the automotive labels market to a great extent.
Expanding Vehicle Adoption: The expanding demand for vehicles among the global populace, coupled with an increase in security and tagging for securing products from various brands, may bring considerable demand for the automotive labels market during the forecast period.
Demand for Eco-friendly Labels: The high adoption of eco-friendly labels is expected to drive the growth of the automotive labels market. Automobile manufacturers are aiming towards minimal harm to the planet with the use of eco-friendly materials.
This factor is pushing the manufacturers in the automotive labels market to research more on manufacturing automotive labels using eco-friendly materials, which may bring a substantial expansion in the automotive labels market.
Although several market drivers have been identified for the automotive labels market, some aspects are projected to curb the market growth during the forecast period. They are:
High Cost of Label Manufacturing: It is anticipated by the experts of FMI that there is a very high cost associated with the manufacturing of automotive labels, which may serve as a hindrance to the propelling market. Due to their expensive price tags, small and medium-sized automobile manufacturers cannot afford these labels.
Errors While Printing: In certain instances, errors occur during the printing of material and human errors during input, coupled with changes in the technological changes in industry, which is expected to slow down the pace of market growth for automotive labels.
North America:
Region | North America |
---|---|
Market Share | North America is projected to hold the maximum shares and dominate the automotive labels market in the upcoming years. Current Market Share Holding: 34% |
Factors Responsible for Growth |
|
Europe:
Region | Europe |
---|---|
Market Share | Europe is expected to follow North America and hold the second-leading share in the global automotive labels market, with a slow and steady rise over the period. Current Market Share Holding: 28% |
Factors Responsible for Growth |
|
The new entrants to the automotive labels market are indulging in collaborations and continually making innovations to the materials and manufacturing procedures of automotive labels to further fuel the adoption of the labels on a wide scale.
Top Start-up to Watch
Localize
Canada-based Start-up
Consumers are demanding more information about what they are buying but seeking less on-pack clutter that confuses their purchasing decisions. QR codes, RFID, NFC tags, and other examples of embedded electronics provide all the necessary information about a product in an interactive form: where it has come from, how it was produced, its nutritional value, etc.
Localize develops a system of managing, capturing, and delivering traceable and certified product information. Their shelf tags enable manufacturers to provide consumers with affordable, smart, and adaptable labels.
Avery Dennison
United States-based Start-up
With the rising need for intelligent labels, sustainability, compliance, and functional labels increased. For today’s fast-paced automotive industry, Avery Dennison is manufacturing durable RFID labels that can meet the requirements and rigors of manufacturing, coupled with long-term use. They offer a full suite of labeling solutions for the automotive industry.
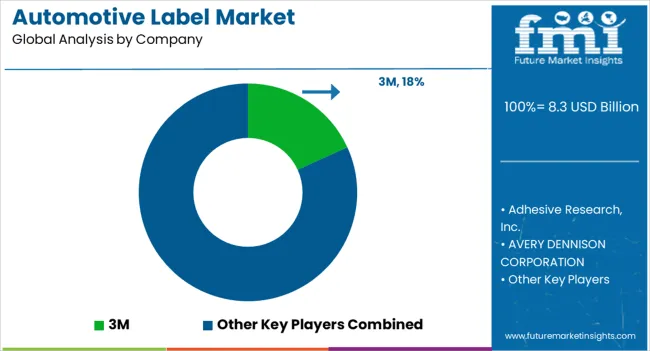
The automotive labels market has numerous players involved in fierce competition for clenching a sizeable consumer base. The players invest extensively in research and development activities for increasing their consumer base by introducing labels with new and advanced materials.
The players are indulging in these collaborations to expand their influence across untapped regions.
Recent Development Identified in the Automotive Labels Market:
Some Biggies Revolutionizing the Market are:
Report Attribute | Details |
---|---|
Growth Rate | CAGR of 4.3% from 2023 to 2033 |
Base Year for Estimation | 2022 |
Historical Data | 2018 to 2022 |
Forecast Period | 2023 to 2033 |
Quantitative Units | Revenue in USD million and CAGR from 2023 to 2033 |
Report Coverage | Revenue Forecast, Volume Forecast, Company Ranking, Competitive Landscape, Growth Factors, Trends, and Pricing Analysis |
Segments Covered |
Material Type, Mechanism, Application, Region |
Regions Covered |
North America; Latin America; Europe; East Asia; South Asia; Oceania; The Middle East and Africa |
Key Countries Profiled | United States of America, Canada, Brazil, Argentina, Germany, United Kingdom, France, Spain, Italy, Nordics, BENELUX, Australia & New Zealand, China, India, ASIAN, GCC Countries, South Africa |
Key Companies Profiled |
3M; Adhesive Research, Inc.; AVERY DENNISON CORPORATION; CCL Industries; Dunmore; H.B. Fuller Company; Imagetek Labels; Lewis Label Products Corporation; Sika AG; UPM Raflatac |
Customization | Available Upon Request |
Table 1: Global Market Value (US$ Million) Forecast by Region, 2018 to 2033
Table 2: Global Market Volume (Units) Forecast by Region, 2018 to 2033
Table 3: Global Market Value (US$ Million) Forecast by Material Type, 2018 to 2033
Table 4: Global Market Volume (Units) Forecast by Material Type, 2018 to 2033
Table 5: Global Market Value (US$ Million) Forecast by Mechanism, 2018 to 2033
Table 6: Global Market Volume (Units) Forecast by Mechanism, 2018 to 2033
Table 7: Global Market Value (US$ Million) Forecast by Application, 2018 to 2033
Table 8: Global Market Volume (Units) Forecast by Application, 2018 to 2033
Table 9: North America Market Value (US$ Million) Forecast by Country, 2018 to 2033
Table 10: North America Market Volume (Units) Forecast by Country, 2018 to 2033
Table 11: North America Market Value (US$ Million) Forecast by Material Type, 2018 to 2033
Table 12: North America Market Volume (Units) Forecast by Material Type, 2018 to 2033
Table 13: North America Market Value (US$ Million) Forecast by Mechanism, 2018 to 2033
Table 14: North America Market Volume (Units) Forecast by Mechanism, 2018 to 2033
Table 15: North America Market Value (US$ Million) Forecast by Application, 2018 to 2033
Table 16: North America Market Volume (Units) Forecast by Application, 2018 to 2033
Table 17: Latin America Market Value (US$ Million) Forecast by Country, 2018 to 2033
Table 18: Latin America Market Volume (Units) Forecast by Country, 2018 to 2033
Table 19: Latin America Market Value (US$ Million) Forecast by Material Type, 2018 to 2033
Table 20: Latin America Market Volume (Units) Forecast by Material Type, 2018 to 2033
Table 21: Latin America Market Value (US$ Million) Forecast by Mechanism, 2018 to 2033
Table 22: Latin America Market Volume (Units) Forecast by Mechanism, 2018 to 2033
Table 23: Latin America Market Value (US$ Million) Forecast by Application, 2018 to 2033
Table 24: Latin America Market Volume (Units) Forecast by Application, 2018 to 2033
Table 25: Western Europe Market Value (US$ Million) Forecast by Country, 2018 to 2033
Table 26: Western Europe Market Volume (Units) Forecast by Country, 2018 to 2033
Table 27: Western Europe Market Value (US$ Million) Forecast by Material Type, 2018 to 2033
Table 28: Western Europe Market Volume (Units) Forecast by Material Type, 2018 to 2033
Table 29: Western Europe Market Value (US$ Million) Forecast by Mechanism, 2018 to 2033
Table 30: Western Europe Market Volume (Units) Forecast by Mechanism, 2018 to 2033
Table 31: Western Europe Market Value (US$ Million) Forecast by Application, 2018 to 2033
Table 32: Western Europe Market Volume (Units) Forecast by Application, 2018 to 2033
Table 33: Eastern Europe Market Value (US$ Million) Forecast by Country, 2018 to 2033
Table 34: Eastern Europe Market Volume (Units) Forecast by Country, 2018 to 2033
Table 35: Eastern Europe Market Value (US$ Million) Forecast by Material Type, 2018 to 2033
Table 36: Eastern Europe Market Volume (Units) Forecast by Material Type, 2018 to 2033
Table 37: Eastern Europe Market Value (US$ Million) Forecast by Mechanism, 2018 to 2033
Table 38: Eastern Europe Market Volume (Units) Forecast by Mechanism, 2018 to 2033
Table 39: Eastern Europe Market Value (US$ Million) Forecast by Application, 2018 to 2033
Table 40: Eastern Europe Market Volume (Units) Forecast by Application, 2018 to 2033
Table 41: South Asia and Pacific Market Value (US$ Million) Forecast by Country, 2018 to 2033
Table 42: South Asia and Pacific Market Volume (Units) Forecast by Country, 2018 to 2033
Table 43: South Asia and Pacific Market Value (US$ Million) Forecast by Material Type, 2018 to 2033
Table 44: South Asia and Pacific Market Volume (Units) Forecast by Material Type, 2018 to 2033
Table 45: South Asia and Pacific Market Value (US$ Million) Forecast by Mechanism, 2018 to 2033
Table 46: South Asia and Pacific Market Volume (Units) Forecast by Mechanism, 2018 to 2033
Table 47: South Asia and Pacific Market Value (US$ Million) Forecast by Application, 2018 to 2033
Table 48: South Asia and Pacific Market Volume (Units) Forecast by Application, 2018 to 2033
Table 49: East Asia Market Value (US$ Million) Forecast by Country, 2018 to 2033
Table 50: East Asia Market Volume (Units) Forecast by Country, 2018 to 2033
Table 51: East Asia Market Value (US$ Million) Forecast by Material Type, 2018 to 2033
Table 52: East Asia Market Volume (Units) Forecast by Material Type, 2018 to 2033
Table 53: East Asia Market Value (US$ Million) Forecast by Mechanism, 2018 to 2033
Table 54: East Asia Market Volume (Units) Forecast by Mechanism, 2018 to 2033
Table 55: East Asia Market Value (US$ Million) Forecast by Application, 2018 to 2033
Table 56: East Asia Market Volume (Units) Forecast by Application, 2018 to 2033
Table 57: Middle East and Africa Market Value (US$ Million) Forecast by Country, 2018 to 2033
Table 58: Middle East and Africa Market Volume (Units) Forecast by Country, 2018 to 2033
Table 59: Middle East and Africa Market Value (US$ Million) Forecast by Material Type, 2018 to 2033
Table 60: Middle East and Africa Market Volume (Units) Forecast by Material Type, 2018 to 2033
Table 61: Middle East and Africa Market Value (US$ Million) Forecast by Mechanism, 2018 to 2033
Table 62: Middle East and Africa Market Volume (Units) Forecast by Mechanism, 2018 to 2033
Table 63: Middle East and Africa Market Value (US$ Million) Forecast by Application, 2018 to 2033
Table 64: Middle East and Africa Market Volume (Units) Forecast by Application, 2018 to 2033
Figure 1: Global Market Value (US$ Million) by Material Type, 2023 to 2033
Figure 2: Global Market Value (US$ Million) by Mechanism, 2023 to 2033
Figure 3: Global Market Value (US$ Million) by Application, 2023 to 2033
Figure 4: Global Market Value (US$ Million) by Region, 2023 to 2033
Figure 5: Global Market Value (US$ Million) Analysis by Region, 2018 to 2033
Figure 6: Global Market Volume (Units) Analysis by Region, 2018 to 2033
Figure 7: Global Market Value Share (%) and BPS Analysis by Region, 2023 to 2033
Figure 8: Global Market Y-o-Y Growth (%) Projections by Region, 2023 to 2033
Figure 9: Global Market Value (US$ Million) Analysis by Material Type, 2018 to 2033
Figure 10: Global Market Volume (Units) Analysis by Material Type, 2018 to 2033
Figure 11: Global Market Value Share (%) and BPS Analysis by Material Type, 2023 to 2033
Figure 12: Global Market Y-o-Y Growth (%) Projections by Material Type, 2023 to 2033
Figure 13: Global Market Value (US$ Million) Analysis by Mechanism, 2018 to 2033
Figure 14: Global Market Volume (Units) Analysis by Mechanism, 2018 to 2033
Figure 15: Global Market Value Share (%) and BPS Analysis by Mechanism, 2023 to 2033
Figure 16: Global Market Y-o-Y Growth (%) Projections by Mechanism, 2023 to 2033
Figure 17: Global Market Value (US$ Million) Analysis by Application, 2018 to 2033
Figure 18: Global Market Volume (Units) Analysis by Application, 2018 to 2033
Figure 19: Global Market Value Share (%) and BPS Analysis by Application, 2023 to 2033
Figure 20: Global Market Y-o-Y Growth (%) Projections by Application, 2023 to 2033
Figure 21: Global Market Attractiveness by Material Type, 2023 to 2033
Figure 22: Global Market Attractiveness by Mechanism, 2023 to 2033
Figure 23: Global Market Attractiveness by Application, 2023 to 2033
Figure 24: Global Market Attractiveness by Region, 2023 to 2033
Figure 25: North America Market Value (US$ Million) by Material Type, 2023 to 2033
Figure 26: North America Market Value (US$ Million) by Mechanism, 2023 to 2033
Figure 27: North America Market Value (US$ Million) by Application, 2023 to 2033
Figure 28: North America Market Value (US$ Million) by Country, 2023 to 2033
Figure 29: North America Market Value (US$ Million) Analysis by Country, 2018 to 2033
Figure 30: North America Market Volume (Units) Analysis by Country, 2018 to 2033
Figure 31: North America Market Value Share (%) and BPS Analysis by Country, 2023 to 2033
Figure 32: North America Market Y-o-Y Growth (%) Projections by Country, 2023 to 2033
Figure 33: North America Market Value (US$ Million) Analysis by Material Type, 2018 to 2033
Figure 34: North America Market Volume (Units) Analysis by Material Type, 2018 to 2033
Figure 35: North America Market Value Share (%) and BPS Analysis by Material Type, 2023 to 2033
Figure 36: North America Market Y-o-Y Growth (%) Projections by Material Type, 2023 to 2033
Figure 37: North America Market Value (US$ Million) Analysis by Mechanism, 2018 to 2033
Figure 38: North America Market Volume (Units) Analysis by Mechanism, 2018 to 2033
Figure 39: North America Market Value Share (%) and BPS Analysis by Mechanism, 2023 to 2033
Figure 40: North America Market Y-o-Y Growth (%) Projections by Mechanism, 2023 to 2033
Figure 41: North America Market Value (US$ Million) Analysis by Application, 2018 to 2033
Figure 42: North America Market Volume (Units) Analysis by Application, 2018 to 2033
Figure 43: North America Market Value Share (%) and BPS Analysis by Application, 2023 to 2033
Figure 44: North America Market Y-o-Y Growth (%) Projections by Application, 2023 to 2033
Figure 45: North America Market Attractiveness by Material Type, 2023 to 2033
Figure 46: North America Market Attractiveness by Mechanism, 2023 to 2033
Figure 47: North America Market Attractiveness by Application, 2023 to 2033
Figure 48: North America Market Attractiveness by Country, 2023 to 2033
Figure 49: Latin America Market Value (US$ Million) by Material Type, 2023 to 2033
Figure 50: Latin America Market Value (US$ Million) by Mechanism, 2023 to 2033
Figure 51: Latin America Market Value (US$ Million) by Application, 2023 to 2033
Figure 52: Latin America Market Value (US$ Million) by Country, 2023 to 2033
Figure 53: Latin America Market Value (US$ Million) Analysis by Country, 2018 to 2033
Figure 54: Latin America Market Volume (Units) Analysis by Country, 2018 to 2033
Figure 55: Latin America Market Value Share (%) and BPS Analysis by Country, 2023 to 2033
Figure 56: Latin America Market Y-o-Y Growth (%) Projections by Country, 2023 to 2033
Figure 57: Latin America Market Value (US$ Million) Analysis by Material Type, 2018 to 2033
Figure 58: Latin America Market Volume (Units) Analysis by Material Type, 2018 to 2033
Figure 59: Latin America Market Value Share (%) and BPS Analysis by Material Type, 2023 to 2033
Figure 60: Latin America Market Y-o-Y Growth (%) Projections by Material Type, 2023 to 2033
Figure 61: Latin America Market Value (US$ Million) Analysis by Mechanism, 2018 to 2033
Figure 62: Latin America Market Volume (Units) Analysis by Mechanism, 2018 to 2033
Figure 63: Latin America Market Value Share (%) and BPS Analysis by Mechanism, 2023 to 2033
Figure 64: Latin America Market Y-o-Y Growth (%) Projections by Mechanism, 2023 to 2033
Figure 65: Latin America Market Value (US$ Million) Analysis by Application, 2018 to 2033
Figure 66: Latin America Market Volume (Units) Analysis by Application, 2018 to 2033
Figure 67: Latin America Market Value Share (%) and BPS Analysis by Application, 2023 to 2033
Figure 68: Latin America Market Y-o-Y Growth (%) Projections by Application, 2023 to 2033
Figure 69: Latin America Market Attractiveness by Material Type, 2023 to 2033
Figure 70: Latin America Market Attractiveness by Mechanism, 2023 to 2033
Figure 71: Latin America Market Attractiveness by Application, 2023 to 2033
Figure 72: Latin America Market Attractiveness by Country, 2023 to 2033
Figure 73: Western Europe Market Value (US$ Million) by Material Type, 2023 to 2033
Figure 74: Western Europe Market Value (US$ Million) by Mechanism, 2023 to 2033
Figure 75: Western Europe Market Value (US$ Million) by Application, 2023 to 2033
Figure 76: Western Europe Market Value (US$ Million) by Country, 2023 to 2033
Figure 77: Western Europe Market Value (US$ Million) Analysis by Country, 2018 to 2033
Figure 78: Western Europe Market Volume (Units) Analysis by Country, 2018 to 2033
Figure 79: Western Europe Market Value Share (%) and BPS Analysis by Country, 2023 to 2033
Figure 80: Western Europe Market Y-o-Y Growth (%) Projections by Country, 2023 to 2033
Figure 81: Western Europe Market Value (US$ Million) Analysis by Material Type, 2018 to 2033
Figure 82: Western Europe Market Volume (Units) Analysis by Material Type, 2018 to 2033
Figure 83: Western Europe Market Value Share (%) and BPS Analysis by Material Type, 2023 to 2033
Figure 84: Western Europe Market Y-o-Y Growth (%) Projections by Material Type, 2023 to 2033
Figure 85: Western Europe Market Value (US$ Million) Analysis by Mechanism, 2018 to 2033
Figure 86: Western Europe Market Volume (Units) Analysis by Mechanism, 2018 to 2033
Figure 87: Western Europe Market Value Share (%) and BPS Analysis by Mechanism, 2023 to 2033
Figure 88: Western Europe Market Y-o-Y Growth (%) Projections by Mechanism, 2023 to 2033
Figure 89: Western Europe Market Value (US$ Million) Analysis by Application, 2018 to 2033
Figure 90: Western Europe Market Volume (Units) Analysis by Application, 2018 to 2033
Figure 91: Western Europe Market Value Share (%) and BPS Analysis by Application, 2023 to 2033
Figure 92: Western Europe Market Y-o-Y Growth (%) Projections by Application, 2023 to 2033
Figure 93: Western Europe Market Attractiveness by Material Type, 2023 to 2033
Figure 94: Western Europe Market Attractiveness by Mechanism, 2023 to 2033
Figure 95: Western Europe Market Attractiveness by Application, 2023 to 2033
Figure 96: Western Europe Market Attractiveness by Country, 2023 to 2033
Figure 97: Eastern Europe Market Value (US$ Million) by Material Type, 2023 to 2033
Figure 98: Eastern Europe Market Value (US$ Million) by Mechanism, 2023 to 2033
Figure 99: Eastern Europe Market Value (US$ Million) by Application, 2023 to 2033
Figure 100: Eastern Europe Market Value (US$ Million) by Country, 2023 to 2033
Figure 101: Eastern Europe Market Value (US$ Million) Analysis by Country, 2018 to 2033
Figure 102: Eastern Europe Market Volume (Units) Analysis by Country, 2018 to 2033
Figure 103: Eastern Europe Market Value Share (%) and BPS Analysis by Country, 2023 to 2033
Figure 104: Eastern Europe Market Y-o-Y Growth (%) Projections by Country, 2023 to 2033
Figure 105: Eastern Europe Market Value (US$ Million) Analysis by Material Type, 2018 to 2033
Figure 106: Eastern Europe Market Volume (Units) Analysis by Material Type, 2018 to 2033
Figure 107: Eastern Europe Market Value Share (%) and BPS Analysis by Material Type, 2023 to 2033
Figure 108: Eastern Europe Market Y-o-Y Growth (%) Projections by Material Type, 2023 to 2033
Figure 109: Eastern Europe Market Value (US$ Million) Analysis by Mechanism, 2018 to 2033
Figure 110: Eastern Europe Market Volume (Units) Analysis by Mechanism, 2018 to 2033
Figure 111: Eastern Europe Market Value Share (%) and BPS Analysis by Mechanism, 2023 to 2033
Figure 112: Eastern Europe Market Y-o-Y Growth (%) Projections by Mechanism, 2023 to 2033
Figure 113: Eastern Europe Market Value (US$ Million) Analysis by Application, 2018 to 2033
Figure 114: Eastern Europe Market Volume (Units) Analysis by Application, 2018 to 2033
Figure 115: Eastern Europe Market Value Share (%) and BPS Analysis by Application, 2023 to 2033
Figure 116: Eastern Europe Market Y-o-Y Growth (%) Projections by Application, 2023 to 2033
Figure 117: Eastern Europe Market Attractiveness by Material Type, 2023 to 2033
Figure 118: Eastern Europe Market Attractiveness by Mechanism, 2023 to 2033
Figure 119: Eastern Europe Market Attractiveness by Application, 2023 to 2033
Figure 120: Eastern Europe Market Attractiveness by Country, 2023 to 2033
Figure 121: South Asia and Pacific Market Value (US$ Million) by Material Type, 2023 to 2033
Figure 122: South Asia and Pacific Market Value (US$ Million) by Mechanism, 2023 to 2033
Figure 123: South Asia and Pacific Market Value (US$ Million) by Application, 2023 to 2033
Figure 124: South Asia and Pacific Market Value (US$ Million) by Country, 2023 to 2033
Figure 125: South Asia and Pacific Market Value (US$ Million) Analysis by Country, 2018 to 2033
Figure 126: South Asia and Pacific Market Volume (Units) Analysis by Country, 2018 to 2033
Figure 127: South Asia and Pacific Market Value Share (%) and BPS Analysis by Country, 2023 to 2033
Figure 128: South Asia and Pacific Market Y-o-Y Growth (%) Projections by Country, 2023 to 2033
Figure 129: South Asia and Pacific Market Value (US$ Million) Analysis by Material Type, 2018 to 2033
Figure 130: South Asia and Pacific Market Volume (Units) Analysis by Material Type, 2018 to 2033
Figure 131: South Asia and Pacific Market Value Share (%) and BPS Analysis by Material Type, 2023 to 2033
Figure 132: South Asia and Pacific Market Y-o-Y Growth (%) Projections by Material Type, 2023 to 2033
Figure 133: South Asia and Pacific Market Value (US$ Million) Analysis by Mechanism, 2018 to 2033
Figure 134: South Asia and Pacific Market Volume (Units) Analysis by Mechanism, 2018 to 2033
Figure 135: South Asia and Pacific Market Value Share (%) and BPS Analysis by Mechanism, 2023 to 2033
Figure 136: South Asia and Pacific Market Y-o-Y Growth (%) Projections by Mechanism, 2023 to 2033
Figure 137: South Asia and Pacific Market Value (US$ Million) Analysis by Application, 2018 to 2033
Figure 138: South Asia and Pacific Market Volume (Units) Analysis by Application, 2018 to 2033
Figure 139: South Asia and Pacific Market Value Share (%) and BPS Analysis by Application, 2023 to 2033
Figure 140: South Asia and Pacific Market Y-o-Y Growth (%) Projections by Application, 2023 to 2033
Figure 141: South Asia and Pacific Market Attractiveness by Material Type, 2023 to 2033
Figure 142: South Asia and Pacific Market Attractiveness by Mechanism, 2023 to 2033
Figure 143: South Asia and Pacific Market Attractiveness by Application, 2023 to 2033
Figure 144: South Asia and Pacific Market Attractiveness by Country, 2023 to 2033
Figure 145: East Asia Market Value (US$ Million) by Material Type, 2023 to 2033
Figure 146: East Asia Market Value (US$ Million) by Mechanism, 2023 to 2033
Figure 147: East Asia Market Value (US$ Million) by Application, 2023 to 2033
Figure 148: East Asia Market Value (US$ Million) by Country, 2023 to 2033
Figure 149: East Asia Market Value (US$ Million) Analysis by Country, 2018 to 2033
Figure 150: East Asia Market Volume (Units) Analysis by Country, 2018 to 2033
Figure 151: East Asia Market Value Share (%) and BPS Analysis by Country, 2023 to 2033
Figure 152: East Asia Market Y-o-Y Growth (%) Projections by Country, 2023 to 2033
Figure 153: East Asia Market Value (US$ Million) Analysis by Material Type, 2018 to 2033
Figure 154: East Asia Market Volume (Units) Analysis by Material Type, 2018 to 2033
Figure 155: East Asia Market Value Share (%) and BPS Analysis by Material Type, 2023 to 2033
Figure 156: East Asia Market Y-o-Y Growth (%) Projections by Material Type, 2023 to 2033
Figure 157: East Asia Market Value (US$ Million) Analysis by Mechanism, 2018 to 2033
Figure 158: East Asia Market Volume (Units) Analysis by Mechanism, 2018 to 2033
Figure 159: East Asia Market Value Share (%) and BPS Analysis by Mechanism, 2023 to 2033
Figure 160: East Asia Market Y-o-Y Growth (%) Projections by Mechanism, 2023 to 2033
Figure 161: East Asia Market Value (US$ Million) Analysis by Application, 2018 to 2033
Figure 162: East Asia Market Volume (Units) Analysis by Application, 2018 to 2033
Figure 163: East Asia Market Value Share (%) and BPS Analysis by Application, 2023 to 2033
Figure 164: East Asia Market Y-o-Y Growth (%) Projections by Application, 2023 to 2033
Figure 165: East Asia Market Attractiveness by Material Type, 2023 to 2033
Figure 166: East Asia Market Attractiveness by Mechanism, 2023 to 2033
Figure 167: East Asia Market Attractiveness by Application, 2023 to 2033
Figure 168: East Asia Market Attractiveness by Country, 2023 to 2033
Figure 169: Middle East and Africa Market Value (US$ Million) by Material Type, 2023 to 2033
Figure 170: Middle East and Africa Market Value (US$ Million) by Mechanism, 2023 to 2033
Figure 171: Middle East and Africa Market Value (US$ Million) by Application, 2023 to 2033
Figure 172: Middle East and Africa Market Value (US$ Million) by Country, 2023 to 2033
Figure 173: Middle East and Africa Market Value (US$ Million) Analysis by Country, 2018 to 2033
Figure 174: Middle East and Africa Market Volume (Units) Analysis by Country, 2018 to 2033
Figure 175: Middle East and Africa Market Value Share (%) and BPS Analysis by Country, 2023 to 2033
Figure 176: Middle East and Africa Market Y-o-Y Growth (%) Projections by Country, 2023 to 2033
Figure 177: Middle East and Africa Market Value (US$ Million) Analysis by Material Type, 2018 to 2033
Figure 178: Middle East and Africa Market Volume (Units) Analysis by Material Type, 2018 to 2033
Figure 179: Middle East and Africa Market Value Share (%) and BPS Analysis by Material Type, 2023 to 2033
Figure 180: Middle East and Africa Market Y-o-Y Growth (%) Projections by Material Type, 2023 to 2033
Figure 181: Middle East and Africa Market Value (US$ Million) Analysis by Mechanism, 2018 to 2033
Figure 182: Middle East and Africa Market Volume (Units) Analysis by Mechanism, 2018 to 2033
Figure 183: Middle East and Africa Market Value Share (%) and BPS Analysis by Mechanism, 2023 to 2033
Figure 184: Middle East and Africa Market Y-o-Y Growth (%) Projections by Mechanism, 2023 to 2033
Figure 185: Middle East and Africa Market Value (US$ Million) Analysis by Application, 2018 to 2033
Figure 186: Middle East and Africa Market Volume (Units) Analysis by Application, 2018 to 2033
Figure 187: Middle East and Africa Market Value Share (%) and BPS Analysis by Application, 2023 to 2033
Figure 188: Middle East and Africa Market Y-o-Y Growth (%) Projections by Application, 2023 to 2033
Figure 189: Middle East and Africa Market Attractiveness by Material Type, 2023 to 2033
Figure 190: Middle East and Africa Market Attractiveness by Mechanism, 2023 to 2033
Figure 191: Middle East and Africa Market Attractiveness by Application, 2023 to 2033
Figure 192: Middle East and Africa Market Attractiveness by Country, 2023 to 2033
The projected revenue of the market by 2033 is USD 11,584.7 million.
The market CAGR for 2033 is projected to be 4.3%.
The market is valued at USD 7,603.99 million in 2023.
North America holds the largest market share.
The increasing complexity of automotive labels is a challenge for the automotive label market.
Explore Similar Insights
Thank you!
You will receive an email from our Business Development Manager. Please be sure to check your SPAM/JUNK folder too.