The Automotive Tape Market is estimated to be valued at USD 4154.6 million in 2025 and is projected to reach USD 6209.3 million by 2035, registering a compound annual growth rate (CAGR) of 4.1% over the forecast period.
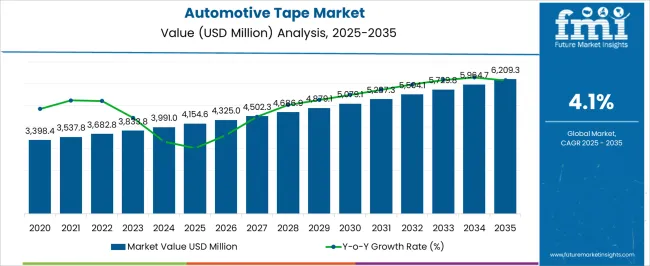
| Metric | Value |
|---|---|
| Automotive Tape Market Estimated Value in (2025 E) | USD 4154.6 million |
| Automotive Tape Market Forecast Value in (2035 F) | USD 6209.3 million |
| Forecast CAGR (2025 to 2035) | 4.1% |
The automotive tape market is experiencing consistent growth, driven by the rising complexity of vehicle manufacturing, demand for lightweight materials, and the transition toward electric vehicles. Automotive tapes provide multifunctional benefits including insulation, bonding, vibration damping, and weight reduction, which are critical in modern vehicle design.
Regulatory emphasis on fuel efficiency and safety has further accelerated the adoption of specialized tapes that replace traditional fasteners. The current market is supported by robust production in both passenger and commercial vehicles, with manufacturers seeking cost-effective and durable solutions for assembly and component integration.
Growth opportunities are also emerging from the expansion of electric and hybrid vehicles, where tapes play a vital role in battery insulation and cable management. Looking forward, technological advancements in adhesives and eco-friendly materials are expected to further strengthen market adoption across global automotive supply chains.
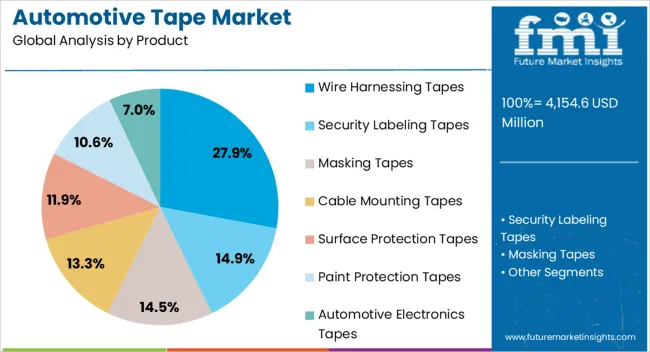
The wire harnessing tapes segment holds approximately 27.9% share in the product category, reflecting its critical role in managing complex vehicle wiring systems. These tapes provide insulation, abrasion resistance, and organizational benefits, ensuring long-term reliability and safety in electrical systems.
The segment benefits from the increasing integration of advanced electronics in vehicles, which has significantly expanded wiring complexity and density. Demand is reinforced by electric vehicle growth, where high-voltage cable management requires specialized harnessing solutions.
With ongoing innovation in heat-resistant and noise-damping materials, the wire harnessing tapes segment is expected to retain its leadership in the forecast period.
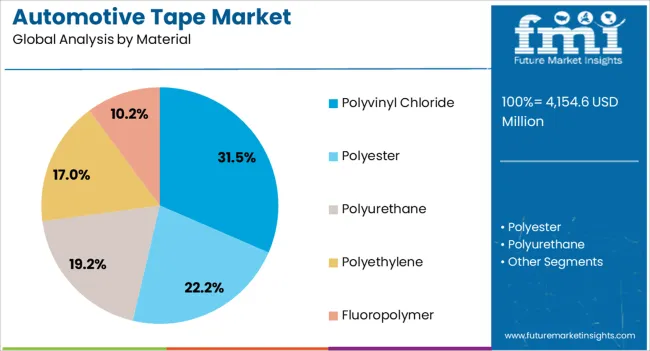
The polyvinyl chloride (PVC) segment dominates the material category with approximately 31.5% share, supported by its flexibility, cost-effectiveness, and proven performance in automotive applications. PVC tapes offer excellent electrical insulation, flame resistance, and durability, making them the preferred material for harnessing, sealing, and surface protection.
Their adaptability across temperature variations and mechanical stress conditions has further reinforced widespread adoption. Continued reliance on PVC in both ICE and EV vehicle platforms ensures consistent demand.
Despite rising interest in eco-friendly alternatives, the PVC segment is expected to maintain its leadership due to its established manufacturing infrastructure and cost advantages.
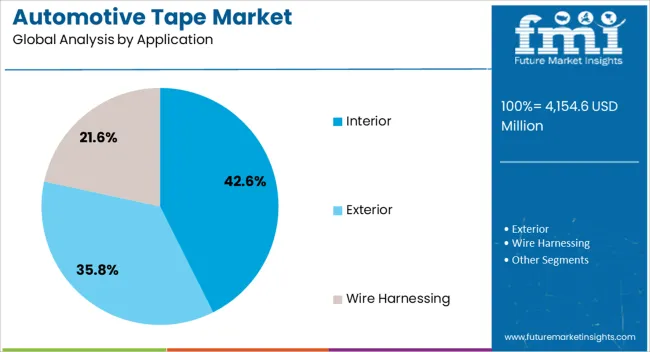
The interior segment leads the application category with approximately 42.6% share, reflecting the growing use of tapes in bonding, noise reduction, and component fastening within vehicle cabins. Automotive interior designs increasingly demand lightweight and durable solutions to support comfort, aesthetics, and acoustic performance.
Tapes have replaced mechanical fasteners in many areas, reducing weight and improving assembly efficiency. The segment also benefits from the demand for premium interiors in passenger vehicles, where advanced adhesive technologies enable customization and enhanced durability.
With continued emphasis on fuel efficiency, EV-friendly design, and consumer comfort, the interior segment is projected to sustain its dominant position in the automotive tape market.
Global automotive tape sales recorded a CAGR of 2.1% during the historical period. Total market valuation at the end of 2025 reached around USD 3,845.7 million. Over the assessment period, the global automotive tape industry is set to expand at a 4.1% CAGR.
The future of vehicle manufacturing is security by sustainability and efficiency, and in this context, the adoption of adhesion tapes, among other things, plays a significant role. They are used for several applications in vehicles.
Automotive tapes are expected to witness steady demand during the forecast period. This is due to their usage as an effective and efficient bonding solution in lean assembly procedures in the automotive industry.
Automotive tapes are quicker and simpler to use than conventional fastening techniques like screws, welds, and rivets. They are more successful at bonding modern materials. High adhesive strength and superior material attachment are expected to fuel the demand for automotive tapes in interior applications.
The automotive sector is embracing lightweight and affordable materials more and more. This will likely uplift demand for automotive tapes during the forecast period.
Automotive tapes are used in the automotive industry for a variety of tasks. These include masking, mirror assembly, mounting parts inside, covering holes, and wire harnessing. High usage in these applications will likely fuel sales of automotive tapes through 2035.
Automobile adhesive tapes are anticipated to have a significant future influence on the automotive industry. This is because they can hold and unite a variety of substrates utilized in lightweight vehicles.
In most regions, however, the use of VOC-containing products can hinder market growth due to government regulations on non-recyclable plastics. To comply with these regulations, manufacturers are required to develop environmentally friendly tapes.
High Demand for Vehicles
The demand for vehicles is increasing globally, leading to the growing need for automotive tapes for various applications. The application of tapes in the automotive industry is huge as they are being used in bonding, vibration damping, noise reduction, and increasing the vehicle's overall performance.
Tapes were traditionally used in automobile manufacturing for the attachment of emblems and molding. However, they are now also used in batteries and other parts to reduce the vehicle's overall weight and improve fuel efficiency.
The evolution of electric vehicles has further expanded the automotive tape applications. Advancements in automobile manufacturing require specialized adhesive solutions for various components, including sensors, wires, and batteries. The demand for automotive tapes is envisioned to grow at a steady rate, driven by continued innovation and transformation of the automobile industry.
Growing Need for Corrosion-Resistant Tapes to Meet Rigorous Standards
The need for corrosion-resistant tapes is uplifting the demand for specialized tapes in the industry. Corrosion-resistant tapes provide long-term protection, which is an important factor in the automotive manufacturing industry because of exposure to various environmental factors such as moisture, salt, and chemicals.
Anti-corrosive tapes ensure the structural integrity and longevity of automotive components by effectively preventing corrosion and contributing to vehicle safety and reliability. Stringent requirements for corrosion resistance in automobile manufacturing in critical areas such as body panels, chassis, and underbody components will positively impact the market.
Corrosion-resistant tapes are made using special materials and coatings that aid in offering superior protection against rust and degradation in harsh conditions. These tapes are specially engineered to withstand temperature variations and mechanical stresses, which enhances reliability in automotive applications.
Usage of Sustainable and Eco-friendly Tapes
The increased emphasis on environmental sustainability and the adoption of sustainable practices is prompting manufacturers to develop eco-friendly automotive tapes. As a result, companies are using bio-based materials, recyclable tapes, and adhesives with less volatile organic compounds.
Growing eco-consciousness in manufacturers as well as consumers is expected to uplift demand for automotive tapes throughout the forecast period. Similarly, the rising innovation and investment in developing sustainable automotive tapes will benefit the market.
| Particular | Value CAGR |
|---|---|
| H1 | 4.2% (2025 to 2035) |
| H2 | 3.7% (2025 to 2035) |
| H1 | 3.9% (2025 to 2035) |
| H2 | 2.6% (2025 to 2035) |
North America, spearheaded by the United States, is anticipated to remain the leading consumer of automotive tapes during the forecast period. This is attributable to the booming automotive sector and the growing adoption of electric & autonomous vehicles. As per the latest analysis, North America’s automotive tape market will likely attain a valuation of USD 1,234.4 million in 2035.
East Asia and South Asia & Pacific are emerging as highly lucrative markets for automotive tape manufacturers. This can be attributed to rising vehicle production and growing demand for automotive masking tapes and other solutions. As per the report, the East Asia automotive tape market will likely expand at 6.2% CAGR, While the South Asia & Pacific automotive tape industry is set to exhibit a CAGR of 7.0% through 2035.
| Countries | Value (CAGR) |
|---|---|
| United States | 2.6% |
| Canada | 3.6% |
| Brazil | 2.8% |
| Mexico | 3.7% |
| Germany | 1.3% |
| France | 2.2% |
| United Kingdom | 1.9% |
| China | 6.2% |
| India | 7.7% |
| Japan | 5.6% |
| GCC countries | 3.7% |
| South Africa | 6.4% |
Despite a sluggish CAGR of 1.3%, Germany is expected to remain the leading consumer of automotive tapes across Europe during the forecast period. By 2035, Germany’s automotive tape market value is set to total USD 199.2 million. It will likely hold 19.8% of the Western Europe automotive tape market share, driven by factors like:
India’s automotive tape market size is anticipated to expand from USD 4154.6 million in 2025 to USD 438.0 million by 2035. Over the forecast period, demand for automotive tapes in India will likely rise at 7.7% CAGR, making it a highly lucrative market for automotive tape manufacturers. This is due to factors like:
The below section shows the security labeling tapes segment dominating the market. It is estimated to account for a value share of 30.1% in 2035. Based on material, the polyester segment is expected to hold a market share of 28.9% in 2035.
| Product | Value CAGR (2025 to 2035) |
|---|---|
| Security Labeling Tapes | 2.7% |
| Auto Masking Tapes | 3.6% |
As per the latest analysis, security tapes are expected to generate significant revenue in the market. Increased focus on safety, quality control, and compliance with industry standards is driving the demand for security labeling tapes.
The security labeling tapes segment is expected to grow at a 2.7% CAGR during the assessment period, totaling USD 1,721.4 million in 2035. It will likely contribute a revenue share of 30.1% by the end of 2035.
Security labeling tapes are widely used in the automotive industry for different applications, including:
Security labeling tapes are specially designed to ensure the integrity of automotive parts and components. A high emphasis on quality control and ensuring the components meet the specific standards is essential in automobile manufacturing. For this purpose, manufacturers use security labeling tapes.
| Material | Value CAGR (2025 to 2035) |
|---|---|
| Polyester | 3.0% |
| Polyethylene | 5.1% |
Several materials are used for making automotive tapes, including polyurethane, fluoropolymer, polyester, and polyurethane. Among these, automotive tape manufacturers prefer polyester owing to its properties like:
Polyester can withstand high temperatures and maintain its physical integrity, which makes it suitable for the automotive industry. Polyester tapes offer resistance against solvents and chemicals such as oils, grease, and other automotive fluids, making them ideal for these automotive applications.
Automotive manufacturers are also showing a keen inclination towards using polyester tapes, owing to their several advantages. For instance, they are easy to apply and remove, flexible, and can withstand a wide range of temperatures. This will prompt companies to expand their polyester tape portfolio.
As per the latest report, the polyester segment is poised to exhibit a CAGR of 3.0% during the forecast period. It will likely total USD 1,651.9 million in 2035, holding 28.9% of the automotive tape market share.
Leading manufacturers of automotive tapes are concentrating on developing innovative products from sustainable and eco-friendly materials. This will not only help them boost sales in the automotive sector but also comply with stringent environmental regulations.
Companies are constantly introducing new tapes with enhanced features like improved strength, chemical resistance, and heat resistance to cater to the diverse needs of different automotive applications. New 3m automotive double-sided tapes are gaining traction.
Several automotive tape manufacturing companies are also using other strategies to expand their presence and boost revenues. These strategies include partnerships, distribution agreements, acquisitions, mergers, collaborations, facility expansions, and alliances.
Recent Developments in the Automotive Tape Market
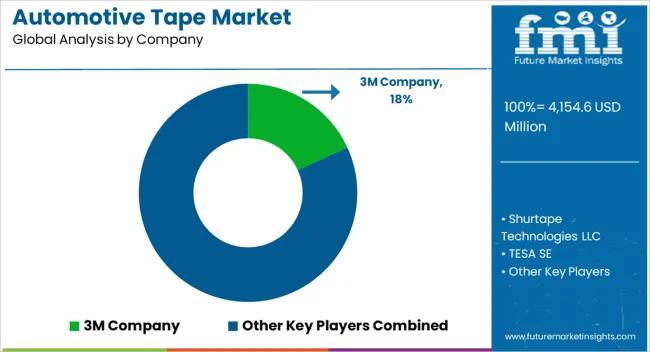
The global automotive tape market is estimated to be valued at USD 4,154.6 million in 2025.
The market size for the automotive tape market is projected to reach USD 6,209.3 million by 2035.
The automotive tape market is expected to grow at a 4.1% CAGR between 2025 and 2035.
The key product types in automotive tape market are wire harnessing tapes, security labeling tapes, masking tapes, cable mounting tapes, surface protection tapes, paint protection tapes and automotive electronics tapes.
In terms of material, polyvinyl chloride segment to command 31.5% share in the automotive tape market in 2025.


Full Research Suite comprises of:
Market outlook & trends analysis
Interviews & case studies
Strategic recommendations
Vendor profiles & capabilities analysis
5-year forecasts
8 regions and 60+ country-level data splits
Market segment data splits
12 months of continuous data updates
DELIVERED AS:
PDF EXCEL ONLINE
Automotive Seating Market Size and Share Forecast Outlook 2025 to 2035
Automotive Appearance Chemical Market Size and Share Forecast Outlook 2025 to 2035
Automotive Remote Diagnostic Market Size and Share Forecast Outlook 2025 to 2035
Automotive-grade Inertial Navigation System Market Size and Share Forecast Outlook 2025 to 2035
Automotive Thin IGBT Module Market Size and Share Forecast Outlook 2025 to 2035
Automotive Hydrogen Leak Detection Sensors Market Size and Share Forecast Outlook 2025 to 2035
Automotive Hybrid IGBTs Market Size and Share Forecast Outlook 2025 to 2035
Automotive Exhaust Extraction Hose Reels Market Size and Share Forecast Outlook 2025 to 2035
Automotive Electroplating Service Market Size and Share Forecast Outlook 2025 to 2035
Automotive Manufacturing Equipment Market Size and Share Forecast Outlook 2025 to 2035
Automotive Pressure Sensor Market Size and Share Forecast Outlook 2025 to 2035
Automotive Vacuum Brake Booster Market Size and Share Forecast Outlook 2025 to 2035
Automotive Smart Antenna Market Size and Share Forecast Outlook 2025 to 2035
Automotive Actuator Market Size and Share Forecast Outlook 2025 to 2035
Automotive Exhaust Manifold Market Size and Share Forecast Outlook 2025 to 2035
Automotive Roof Rails Market Size and Share Forecast Outlook 2025 to 2035
Automotive Resonator Market Size and Share Forecast Outlook 2025 to 2035
Automotive Counter Shaft Market Size and Share Forecast Outlook 2025 to 2035
Automotive Wheel Coating Market Size and Share Forecast Outlook 2025 to 2035
Automotive Water Separation Systems Market Size and Share Forecast Outlook 2025 to 2035

Thank you!
You will receive an email from our Business Development Manager. Please be sure to check your SPAM/JUNK folder too.
Chat With
MaRIA