Reports

- Global Locations -

Headquarters

Future Market Insights, Inc.

Christiana Corporate, 200
Continental Drive, Suite 401,
Newark, Delaware - 19713,
United States

T: +1-845-579-5705

Americas

Future Market Insights, Inc.

616 Corporate Way, Suite 2-9018,
Valley Cottage, NY 10989, United States

T: +1-347-918-3531

MEA

Future Market Insights

1602-6 Jumeirah Bay X2 Tower, Plot No: JLT-PH2-X2A,
Jumeirah Lakes Towers, Dubai,
United Arab Emirates

Europe

Future Market Insights

3rd Floor, 207 Regent Street,
W1B 3HH London
United Kingdom

T: + 44 (0) 20 8123 9659
D: +44 (0) 20 3287 4268

Asia Pacific

Future Market Insights

IndiaLand Global Tech Park, Unit UG-1, Behind Grand HighStreet, Phase 1, Hinjawadi, MH, Pune – 411057, India

Axillary Hyperhidrosis Treatment Market Snapshot

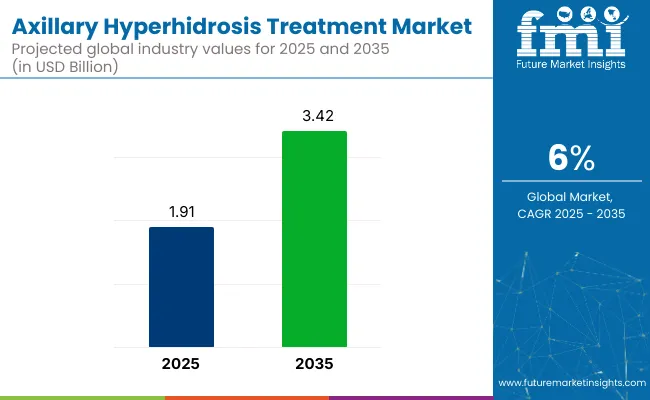
According to Future Market Insights (FMI) analysis in a recent market survey, the global axillary hyperhidrosis treatment market was valued at US$ 1.6 Billion in 2022 and is expected to reach US$ 3.3 Billion by 2033.

Market Outlook:

Data Points Market Insights
Market Value 2022 US$ 1.6 Billion
Market Value 2023 US$ 1.8 Billion
Market Value 2033 US$ 3.3 Billion
CAGR 2023 to 2033 6.7%
Share of Top 5 Countries 53.6%
Key Players The key players in the axillary hyperhidrosis treatment market are Allergan plc. (AbbVie), Journey Medical Corporation (Dermira, Inc.), Riemann A/S (Orkla), SweatBlock, Certain Dri, miraDry, Inc. (Sientra), STRATUS PHARMACEUTICALS INC, Duradry, Pers?n & Covey, GlaxoSmithKline Plc., Carpe, SweatStop® International, CORAD Healthcare, ZeroSweat

Anti-sweat injections are nowadays considered to be the best option for treating axillary hyperhidrosis as these don't require any incisions.

Doctors are now employing Botox as a successful alternative to treat hyperhidrosis for individuals who want long-lasting results or for whom conventional antiperspirants are ineffective. The FDA has licensed Botox for the treatment of axillary hyperhidrosis in individuals who frequently perspire.

  • The less invasive aspect of Botox injections, the less pain when administered into the armpits, and the generally safe technique are factors that have driven people to select Botox treatment for long-term results. Further growth is anticipated for this trend, which will help the market flourish.

Medicated wipes and gels are also effective substitutes. These products contain active ingredients such as aluminum chloride or aluminum zirconium tetrachlorohydrex glycine, which work by blocking sweat ducts and reducing the amount of sweat produced. One advantage of medicated wipes and gels is that they are non-invasive and do not require any medical procedures. However, another advantage is that they can be more effective than other traditional treatment options. Medicated wipes and gels contain higher concentrations of active ingredients, which can provide longer-lasting and more reliable results.

Overall, the increasing use of medicated wipes and gels in the treatment of hyperhidrosis is likely due to their convenience, efficacy, and safety, which will boost the market in the coming years.

Don't pay for what you don't need

Customize your report by selecting specific countries or regions and save 30%!

Sales Analysis of Axillary Hyperhidrosis Treatment Market from 2017 to 2022 Vs Market Outlook for 2023 to 2033

Sales of the axillary hyperhidrosis treatment market grew at a CAGR of 7.2% between 2017 to 2022. Axillary hyperhidrosis treatment market contributes 5.1% revenue share to the global dermatology therapeutics market in 2022.

The increasing availability of over-the-counter and labelled medications for the treatment of axillary hyperhidrosis will further result in higher uptake of various treatment options such as antiperspirants, thus leading to market expansion. Because of their easy availability and affordability, antiperspirants are typically the first form of treatment recommended by a dermatologist worldwide for axillary hyperhidrosis.

  • Dermatologists recommend clinical-strength antiperspirants or regular antiperspirants to their axillary hyperhidrosis patients as they are simple to use, well tolerated by patients, and have minimalistic side effects. The market will continue to grow as a result of the strong recommendation for antiperspirants as the first-line treatment for hyperhidrosis.
  • As per the statistics provided by Sweathelp Organization, 2022, a significant percentage of the overall global population has hyperhidrosis. Of these, more than 60% of people suffer from sweating localized to the armpits (axillary diseases).

With the advancement of therapies such as iontophoresis and antiperspirants, axillary hyperhidrosis can now be treated more successfully than in the past. For the treatment of hyperhidrosis, more recent treatment options like miraDry, Botox injections, and lasers have significantly increased patient satisfaction and emerged as effective treatment options for axillary hyperhidrosis, which has led to the higher adoption of such products and therapies in the global market.

Prevalence of diabetes and obesity increases the chances of secondary hyperhidrosis in patients. Diabetes can lead to nerve damage that can affect the body's ability to regulate sweating. Menopause can also lead to hormonal changes that affect sweating. Obesity can lead to excessive sweating due to increased body mass and associated heat production.

  • According to a study in the 9th edition of the International Diabetes Federation Diabetes Atlas, 463 million people worldwide were living with diabetes in 2019. Prevalence is expected to increase to 578 million in 2030 and 700 million in 2045. Consequently, the increasing prevalence of diabetes will lead to an increase in hyperhidrosis disorders such as axillary hyperhidrosis in patients, which will result in more patients seeking hyperhidrosis treatment.

Considering this, FMI expects the global axillary hyperhidrosis treatment market to grow at a CAGR of 6.7% through the forecasted years.

What are the Key Opportunities in the Axillary Hyperhidrosis Treatment Market?

There is a lack of awareness regarding axillary hyperhidrosis, which is excessive sweating in the armpits Many people who suffer from this condition may not realize that it is a medical condition that can be treated. They may be embarrassed to talk about it, or believe it is just a normal reaction of their body to heat or stress.

As a result, many people with axillary hyperhidrosis do not seek treatment, which can lead to social isolation, anxiety, and low self-esteem. Secondly, healthcare providers may not recognize the condition or may not know how to effectively treat it.

Healthcare professionals are also experimenting with various combination therapies/treatments and seeing positive results in their patients, especially with oral medications. Oral medications are generally not a viable, long-term, sole option due to their side effects. Instead, other treatments can be combined with them to achieve the best results, and new formulations can make them easier for more patients.

  • Botulinum toxin injections and oral medications are an example of combined treatment for hyperhidrosis. Botulinum toxin injections are a common treatment for hyperhidrosis, but they may not be effective for axillary hyperhidrosis or in all patients. Oral medications such as anticholinergics or beta blockers may be used in combination with botulinum toxin injections to reduce sweating.

Increased testing of combination therapies in patients will pave the way for new drug discoveries and treatment options, ultimately leading to the introduction of new products into the market.

Sabyasachi Ghosh
Sabyasachi Ghosh

Principal Consultant

Talk to Analyst

Find your sweet spots for generating winning opportunities in this market.

Which Factors Could Possibly Restrain the Growth of Axillary Hyperhidrosis Treatment Market?

Many people suffering from axillary hyperhidrosis are not aware that there are treatments available for their condition. This lack of awareness could result in fewer patients seeking treatment, thereby limiting the growth of the market.

Some of the treatments for axillary hyperhidrosis, such as antiperspirants and botox injections, may have side effects that could discourage patients to seek treatment and pursue alternative therapies, such as herbal remedies or acupuncture, instead of conventional medical treatments, which could limit the growth of the market for conventional treatments.

  • While antiperspirants are generally considered safe and effective, some people may experience skin irritation, redness, or itching, particularly if they have sensitive skin. In rare cases, antiperspirants may cause an allergic reaction, which could lead to more severe symptoms such as hives, difficulty breathing, or swelling of the face, lips, tongue, or throat.
  • Botox injections work by blocking the nerve signals that cause sweating in the underarms. While generally safe, they can cause side effects such as pain or bruising at the injection site, headache, flu-like symptoms, or dry mouth. In rare cases, Botox injections may cause more serious side effects such as muscle weakness, difficulty breathing, or difficulty swallowing.

The potential side effects of antiperspirants and Botox injections may deter some patients from using these treatments, and could limit their uptake.

These factors are expected to hamper revenue growth of the axillary hyperhidrosis treatment market over the forecast period.

Country-wise Insights

What Makes the USA the Dominating Country in the Axillary Hyperhidrosis Treatment Market?

The USA axillary hyperhidrosis treatment market is expected to register a CAGR of 5.0% during the forecast period.

The high prevalence of primary and secondary hyperhidrosis in the United States will accelerate the acceptance of various treatment alternatives.

  • According to the American Journal of Clinical Dermatology, hyperhidrosis affects over 4.8% of the USA population, or more than 15 million people. Of those 15 million people, more than 10 million suffer from axillary hyperhidrosis, and the majority of those affected report that it negatively impacts their social life, well-being, and mental health. Hyperhidrosis is most common in people between the ages of 20 and 60.

Due to the high prevalence, more treatments, including over-the-counter products such as antiperspirants and wipes, will experience a high adoption rate among patients. The demand for axillary hyperhidrosis treatment will increase due to high prevalence, which will drive the expansion of the market.

Why is Germany considered to be a Lucrative Segment for Axillary Hyperhidrosis Treatment Market in Europe?

Germany dominated the European market for axillary hyperhidrosis treatment and accounted for around 22.2% of the market share in 2022.

Over the years, miraDry has completely overshadowed these invasive procedures owing to its non-invasive nature while providing the treatment.

Since 2014, Munich’s German Hyperhidrosis Center (DHHZ) has been offering this treatment and is the first miraDry treatment facility certified in Germany and Europe. Since 2015, miraDry has also been further developed and improved for the treatment of excessive sweating in the groin, buttocks, and trunk.

The safe and successful use of miraDry treatments in Germany will influence other European countries to also opt for this treatment method, ultimately expanding the overall market.

What Makes China an Emerging Market for Axillary Hyperhidrosis Treatment?

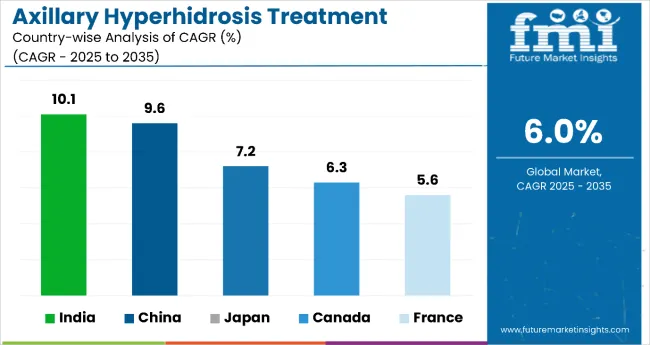
China is projected to be the most attractive market in the axillary hyperhidrosis treatment, and is expected to grow over a significant CAGR of 8.3%.

The axillary hyperhidrosis treatment market in China is expected to grow significantly in the coming years due to several factors.

One of the main factors driving the growth of the axillary hyperhidrosis treatment market in China is the increasing awareness of the condition among the general public and healthcare professionals. As more people become aware of the condition, they are more likely to seek treatment, which is leading to increased demand for treatments for axillary hyperhidrosis.

Another factor contributing to the growth of the axillary hyperhidrosis treatment market in China is the increasing availability of advanced medical technologies and treatments. China has made significant investments in its healthcare infrastructure, and many new hospitals and clinics have been built in recent years. This has allowed for the introduction of advanced treatments such as botox injections and surgery, which were not widely available in the past.

Get the data you need at a Fraction of the cost

Personalize your report by choosing insights you need
and save 40%!

Category-wise Insights

Why Drug Therapy Is Largely Adopted Treatment Option for Axillary Hyperhidrosis?

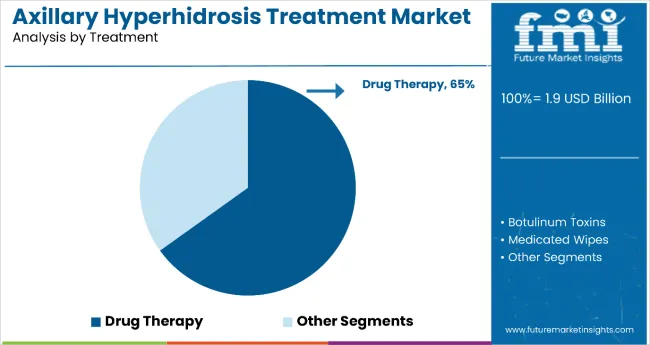
The drug therapy segment held the major chunk of about 62.7% in global market by the end of 2022.

Drug therapy is a non-invasive treatment option that does not require any surgical procedures or injections. This makes it a less risky and more comfortable option for patients who may be apprehensive about more invasive treatments.

Certain medications, such as antiperspirants and oral anticholinergic drugs, have been shown to be effective in reducing excessive sweating in patients with axillary hyperhidrosis. These medications can be effective in reducing sweat production with minimal side effects. This makes it a safer and more tolerable option for patients who may be concerned about potential side effects.

Overall, drug therapy is a widely adopted treatment option for axillary hyperhidrosis due to its non-invasive nature, efficacy, accessibility, cost-effectiveness, and minimal side effects.

Which Distribution Channel Dominates the Global Market in 2022?

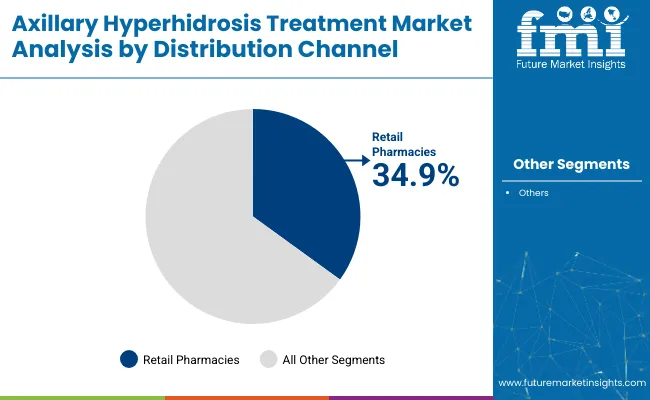
The retail pharmacy segment accounted for revenue share of 34.2% in the global market at the end of 2022.

Retail pharmacies offer convenient access to treatment options, with many providing over-the-counter and prescription medications for a range of conditions, including axillary hyperhidrosis. Patients can typically purchase these treatments without an appointment, making it more convenient for them to manage their condition.

Overall, retail pharmacy offers a convenient and accessible distribution channel for axillary hyperhidrosis treating products, making it the largest channel for these treatments.

Competitive Landscape

Key players in the market are focused on increase their product portfolio to strengthen their position in the axillary hyperhidrosis treatment market, and also to expand their footprint in emerging markets. The key strategy adopted by manufacturers to gain competitive edge in the market are the pricing strategies, market strategies, technological advancements, regulatory compliance and acquisition & distribution agreement of other companies to expand their business.

For instance

  • In April 2021, Journey Medical Corporation and Dermira, Inc subsidiary of Eli Lilly and Company, entered into an agreement to acquire QBREXZA®.
  • In May 2020, AbbVie announced that it had completed the acquisition of Allergan Plc after obtaining all regulatory approvals required under the transaction agreement and obtaining the approval of the Irish High Court.

Similarly, recent developments have been tracked by the team at Future Market Insights related to companies in the axillary hyperhidrosis treatment market space, which are available in the full report

Scope of the Axillary Hyperhidrosis Treatment Report

Attribute Details
Forecast Period 2023 to 2033
Historical Data Available for 2017 to 2022
Market Analysis USD Million for Value
Key Regions Covered North America, Latin America, Europe, South Asia, East Asia, Oceania, Middle East and Africa (MEA)
Key Countries Covered USA, Canada, Brazil, Mexico, Argentina, Germany, United kingdom, France, Italy, Spain, Russia, BENELUX, Nordics, China, Japan, South Korea, India, Thailand, Indonesia, Malaysia, Australia, New Zealand, Türkiye, South Africa, North Africa and GCC Countries
Key Segments Covered Treatment, Distribution Channel, and Region
Key Companies Profiled
  • Allergan plc. (AbbVie)
  • Journey Medical Corporation (Dermira, Inc.)
  • Riemann A/S (Orkla)
  • SweatBlock
  • Certain Dri
  • miraDry, Inc. (Sientra)
  • STRATUS PHARMACEUTICALS INC
  • Duradry
  • Persn & Covey
  • GlaxoSmithKline Plc.
  • Carpe
  • SweatStop® International
  • CORAD Healthcare
  • ZeroSweat
Report Coverage Market Forecast, Competition Intelligence, DROT Analysis, Market Dynamics and Challenges, Strategic Growth Initiatives
Customization & Pricing Available upon Request

Key Segments Covered in Axillary Hyperhidrosis Treatment Industry Research

By Treatment:

  • Drug Therapy
    • Antiperspirants (Both OTC & Rx)
      • Antiperspirants Spray
      • Antiperspirants Roll-On
      • Antiperspirants Wipes
      • Antiperspirants Lotion & Gel
    • Antihypertensive Drugs
    • Anticholinergic Agents
    • Alpha-Adrenergic Agonists
  • Botulinum Toxins
  • Medicated Wipes
  • Microwave Therapy

By Distribution Channel:

  • Hospitals
  • General Physician’s Clinics
  • Retail Pharmacy Chains
  • Drug Stores
    • Online Sales
    • Manufacturer websites

By Region:

  • North America
  • Latin America
  • Europe
  • South Asia
  • East Asia
  • Oceania
  • Middle East and Africa (MEA)

Frequently Asked Questions

How Big is the Axillary Hyperhidrosis Treatment Market?

The global market might create a revenue of around US$ 1.8 billion in 2023.

Which is the Dominant Country for Adoption of Axillary Hyperhidrosis Treatment?

Adoption of such treatments in the United States may increase at 5% CAGR through 2033.

Which is the Leading Regional Market for Axillary Hyperhidrosis Treatment in Europe?

Germany dominates the region and accounted for 22.2% market share in 2022.

How Much Popular is Drug Therapy in Axillary Hyperhidrosis Treatment?

Drug therapy segment held 62.7% of the global market in 2022.

What is the Leading Sales Channel for Axillary Hyperhidrosis Treatment Products?

Retail pharmacies achieved 34.2% of the global sales in 2022.

Table of Content

1. Executive Summary | Axillary Hyperhidrosis Treatment Market

    1.1. Global Market Outlook

    1.2. Demand Side Trends

    1.3. Supply-Side Side Trends

    1.4. Analysis and Recommendations

2. Market Overview

    2.1. Market Coverage / Taxonomy

    2.2. Market Definition / Scope / Limitations

    2.3. Inclusions and Exclusions

3. Key Market Trends

    3.1. Key Trends Impacting the Market

    3.2. Innovation / Development Trends

4. Value Added Insights

    4.1. Disease Epidemiology

    4.2. Patent Analysis

    4.3. Pipeline Assessment

    4.4. Value Chain Analysis

    4.5. Regulatory Scenario

    4.6. PESTLE Analysis

    4.7. Porter’s Analysis

5. Market Background

    5.1. Macro-Economic Factors

        5.1.1. Global GDP Growth Outlook

        5.1.2. Global Healthcare Spending Outlook

        5.1.3. Global Dermatology Therapeutics Market Overview

    5.2. Forecast Factors - Relevance & Impact

        5.2.1. Increasing Prevalence of Axillary Hyperhidrosis

        5.2.2. Treatment Seeking Rate (%)

        5.2.3. Adoption of Various Treatment Modalities

        5.2.4. Greater Demand for Non-Invasive Procedures

        5.2.5. Increasing Initiatives by Manufacturers to Educate the General Population

        5.2.6. Products in Pipeline

        5.2.7. Availability of Products

    5.3. Market Dynamics

        5.3.1. Drivers

        5.3.2. Restraints

        5.3.3. Opportunity Analysis

6. COVID-19 Crisis Analysis

    6.1. COVID-19 and Impact Analysis

        6.1.1. By Treatment

        6.1.2. By Distribution Channel

        6.1.3. By Country

    6.2. 2022 Market Scenario

7. Global Market Demand (in Value or Size in US$ Million) Analysis 2017 to 2022 and Forecast, 2023 to 2033

    7.1. Historical Market Value (US$ Million) Analysis 2017 to 2022

    7.2. Current and Future Market Value (US$ Million) Projections, 2023 to 2033

        7.2.1. Y-o-Y Growth Trend Analysis

        7.2.2. Absolute $ Opportunity Analysis

8. Global Market Analysis 2017 to 2022 and Forecast 2023 to 2033, By Treatment

    8.1. Introduction / Key Findings

    8.2. Historical Market Size (US$ Million) Analysis By Treatment, 2017 to 2022

    8.3. Current and Future Market Size (US$ Million) Analysis and Forecast, By Treatment, 2023 to 2033

        8.3.1. Drug Therapy

            8.3.1.1. Antiperspirants (Both OTC & Rx)

                8.3.1.1.1. Antiperspirants Spray

                8.3.1.1.2. Antiperspirants Roll-On

                8.3.1.1.3. Antiperspirants Wipes

                8.3.1.1.4. Antiperspirants Lotion & Gel

            8.3.1.2. Antihypertensive Drugs

            8.3.1.3. Anticholinergic Agents

            8.3.1.4. Alpha-Adrenergic Agonists

        8.3.2. Botulinum Toxins

        8.3.3. Medicated Wipes

        8.3.4. Microwave Therapy

    8.4. Market Attractiveness Analysis By Treatment

9. Global Market Analysis 2017 to 2022 and Forecast 2023 to 2033, By Distribution Channel

    9.1. Introduction

    9.2. Historical Market Size (US$ Million) Analysis By Distribution Channel, 2017 to 2022

    9.3. Current and Future Market Size (US$ Million) Analysis and Forecast By Distribution Channel, 2023 to 2033

        9.3.1. Hospitals

        9.3.2. General Physician’s Clinics

        9.3.3. Retail Pharmacy Chains

        9.3.4. Drug Stores

            9.3.4.1. Online Sales

            9.3.4.2. Manufacturer websites

    9.4. Market Attractiveness Analysis By Distribution Channel

10. Global Market Analysis 2017 to 2022 and Forecast 2023 to 2033, By Region

    10.1. Introduction

    10.2. Historical Market Value (US$ Million) Analysis By Region, 2017 to 2022

    10.3. Current and Future Market Size (US$ Million) Analysis and Forecast, By Region, 2023 to 2033

        10.3.1. North America

        10.3.2. Latin America

        10.3.3. Europe

        10.3.4. South Asia

        10.3.5. East Asia

        10.3.6. Oceania

        10.3.7. Middle East & Africa

    10.4. Market Attractiveness Analysis By Region

11. North America Market Analysis 2017 to 2022 and Forecast 2023 to 2033

    11.1. Introduction

    11.2. Historical Market Value (US$ Million) Analysis, By Market Taxonomy 2017 to 2022

    11.3. Current and Future Market Size (US$ Million) Analysis and Forecast, By Market Taxonomy, 2023 to 2033

        11.3.1. By Country

            11.3.1.1. USA

            11.3.1.2. Canada

        11.3.2. By Treatment

        11.3.3. By Distribution Channel

    11.4. Market Attractiveness Analysis

        11.4.1. By Country

        11.4.2. By Treatment

        11.4.3. By Distribution Channel

    11.5. Market Trends

    11.6. Key Market Participants - Intensity Mapping

    11.7. Drivers and Restraints - Impact Analysis

    11.8. Country Level Analysis & Forecast

        11.8.1. USA Market

            11.8.1.1. Introduction

            11.8.1.2. Market Analysis and Forecast by Market Taxonomy

                11.8.1.2.1. By Treatment

                11.8.1.2.2. By Distribution Channel

        11.8.2. Canada Market

        11.8.3. Introduction

        11.8.4. Market Analysis and Forecast by Market Taxonomy

                11.8.4.1.1. By Treatment

                11.8.4.1.2. By Distribution Channel

12. Latin America Market Analysis 2017 to 2022 and Forecast 2023 to 2033

    12.1. Introduction

    12.2. Historical Market Value (US$ Million) Analysis, By Market Taxonomy 2017 to 2022

    12.3. Current and Future Market Size (US$ Million) Analysis and Forecast, By Market Taxonomy, 2023 to 2033

        12.3.1. By Country

            12.3.1.1. Brazil

            12.3.1.2. Mexico

            12.3.1.3. Argentina

            12.3.1.4. Rest of Latin America

        12.3.2. By Treatment

        12.3.3. By Distribution Channel

    12.4. Market Attractiveness Analysis

        12.4.1. By Country

        12.4.2. By Treatment

        12.4.3. By Distribution Channel

    12.5. Market Trends

    12.6. Key Market Participants - Intensity Mapping

    12.7. Drivers and Restraints - Impact Analysis

    12.8. Country Level Analysis & Forecast

        12.8.1. Brazil Market

            12.8.1.1. Introduction

            12.8.1.2. Market Analysis and Forecast by Market Taxonomy

                12.8.1.2.1. By Treatment

                12.8.1.2.2. By Distribution Channel

        12.8.2. Mexico Market

            12.8.2.1. Introduction

            12.8.2.2. Market Analysis and Forecast by Market Taxonomy

                12.8.2.2.1. By Treatment

                12.8.2.2.2. By Distribution Channel

        12.8.3. Argentina Market

        12.8.4. Introduction

        12.8.5. Market Analysis and Forecast by Market Taxonomy

                12.8.5.1.1. By Treatment

                12.8.5.1.2. By Distribution Channel

13. Europe Market Analysis 2017 to 2022 and Forecast 2023 to 2033

    13.1. Introduction

    13.2. Historical Market Value (US$ Million) Analysis, By Market Taxonomy 2017 to 2022

    13.3. Current and Future Market Size (US$ Million) Analysis and Forecast, By Market Taxonomy, 2023 to 2033

        13.3.1. By Country

            13.3.1.1. Germany

            13.3.1.2. Italy

            13.3.1.3. France

            13.3.1.4. United kingdom

            13.3.1.5. Spain

            13.3.1.6. BENELUX

            13.3.1.7. Russia

            13.3.1.8. Nordic Countries

            13.3.1.9. Rest of Europe

        13.3.2. By Treatment

        13.3.3. By Distribution Channel

    13.4. Market Attractiveness Analysis

        13.4.1. By Country

        13.4.2. By Treatment

        13.4.3. By Distribution Channel

    13.5. Market Trends

    13.6. Key Market Participants - Intensity Mapping

    13.7. Drivers and Restraints - Impact Analysis

    13.8. Country Level Analysis & Forecast

        13.8.1. Germany Market

            13.8.1.1. Introduction

            13.8.1.2. Market Analysis and Forecast by Market Taxonomy

                13.8.1.2.1. By Treatment

                13.8.1.2.2. By Distribution Channel

        13.8.2. Italy Market

            13.8.2.1. Introduction

            13.8.2.2. Market Analysis and Forecast by Market Taxonomy

                13.8.2.2.1. By Treatment

                13.8.2.2.2. By Distribution Channel

        13.8.3. France Market

            13.8.3.1. Introduction

            13.8.3.2. Market Analysis and Forecast by Market Taxonomy

                13.8.3.2.1. By Treatment

                13.8.3.2.2. By Distribution Channel

        13.8.4. United kingdom Market

            13.8.4.1. Introduction

            13.8.4.2. Market Analysis and Forecast by Market Taxonomy

                13.8.4.2.1. By Treatment

                13.8.4.2.2. By Distribution Channel

        13.8.5. Spain Market

            13.8.5.1. Introduction

            13.8.5.2. Market Analysis and Forecast by Market Taxonomy

                13.8.5.2.1. By Treatment

                13.8.5.2.2. By Distribution Channel

        13.8.6. BENELUX Market

            13.8.6.1. Introduction

            13.8.6.2. Market Analysis and Forecast by Market Taxonomy

                13.8.6.2.1. By Treatment

                13.8.6.2.2. By Distribution Channel

        13.8.7. Russia Market

            13.8.7.1. Introduction

            13.8.7.2. Market Analysis and Forecast by Market Taxonomy

                13.8.7.2.1. By Treatment

                13.8.7.2.2. By Distribution Channel

        13.8.8. Nordic Countries Market

            13.8.8.1. Introduction

            13.8.8.2. Market Analysis and Forecast by Market Taxonomy

                13.8.8.2.1. By Treatment

                13.8.8.2.2. By Distribution Channel

14. East Asia Market Analysis 2017 to 2022 and Forecast 2023 to 2033

    14.1. Introduction

    14.2. Historical Market Value (US$ Million) Analysis, By Market Taxonomy 2017 to 2022

    14.3. Current and Future Market Size (US$ Million) Analysis and Forecast, By Market Taxonomy, 2023 to 2033

        14.3.1. By Country

            14.3.1.1. China

            14.3.1.2. Japan

            14.3.1.3. South Korea

        14.3.2. By Treatment

        14.3.3. By Distribution Channel

    14.4. Market Attractiveness Analysis

        14.4.1. By Country

        14.4.2. By Treatment

        14.4.3. By Distribution Channel

    14.5. Market Trends

    14.6. Key Market Participants - Intensity Mapping

    14.7. Drivers and Restraints - Impact Analysis

    14.8. Country Level Analysis & Forecast

        14.8.1. China Market

            14.8.1.1. Introduction

            14.8.1.2. Market Analysis and Forecast by Market Taxonomy

                14.8.1.2.1. By Treatment

                14.8.1.2.2. By Distribution Channel

        14.8.2. Japan Market

            14.8.2.1. Introduction

            14.8.2.2. Market Analysis and Forecast by Market Taxonomy

                14.8.2.2.1. By Treatment

                14.8.2.2.2. By Distribution Channel

        14.8.3. South Korea Market

            14.8.3.1. Introduction

            14.8.3.2. Market Analysis and Forecast by Market Taxonomy

                14.8.3.2.1. By Treatment

                14.8.3.2.2. By Distribution Channel

15. South Asia Market Analysis 2017 to 2022 and Forecast 2023 to 2033

    15.1. Introduction

    15.2. Historical Market Value (US$ Million) Analysis, By Market Taxonomy 2017 to 2022

    15.3. Current and Future Market Size (US$ Million) Analysis and Forecast, By Market Taxonomy, 2023 to 2033

        15.3.1. By Country

            15.3.1.1. India

            15.3.1.2. Indonesia

            15.3.1.3. Malaysia

            15.3.1.4. Thailand

            15.3.1.5. Rest of South Asia

        15.3.2. By Treatment

        15.3.3. By Distribution Channel

    15.4. Market Attractiveness Analysis

        15.4.1. By Country

        15.4.2. By Treatment

        15.4.3. By Distribution Channel

    15.5. Market Trends

    15.6. Key Market Participants - Intensity Mapping

    15.7. Drivers and Restraints - Impact Analysis

    15.8. Country Level Analysis & Forecast

        15.8.1. India Market

            15.8.1.1. Introduction

            15.8.1.2. Market Analysis and Forecast by Market Taxonomy

                15.8.1.2.1. By Treatment

                15.8.1.2.2. By Distribution Channel

        15.8.2. Indonesia Market

            15.8.2.1. Introduction

            15.8.2.2. Market Analysis and Forecast by Market Taxonomy

                15.8.2.2.1. By Treatment

                15.8.2.2.2. By Distribution Channel

        15.8.3. Malaysia Treatment Market

            15.8.3.1. Introduction

            15.8.3.2. Market Analysis and Forecast by Market Taxonomy

                15.8.3.2.1. By Treatment

                15.8.3.2.2. By Distribution Channel

        15.8.4. Thailand Market

            15.8.4.1. Introduction

            15.8.4.2. Market Analysis and Forecast by Market Taxonomy

                15.8.4.2.1. By Treatment

                15.8.4.2.2. By Distribution Channel

16. Oceania Market Analysis 2017 to 2022 and Forecast 2023 to 2033

    16.1. Introduction

    16.2. Historical Market Value (US$ Million) Analysis, By Market Taxonomy 2017 to 2022

    16.3. Current and Future Market Size (US$ Million) Analysis and Forecast, By Market Taxonomy, 2023 to 2033

        16.3.1. By Country

            16.3.1.1. Australia

            16.3.1.2. New Zealand

        16.3.2. By Treatment

        16.3.3. By Distribution Channel

    16.4. Market Attractiveness Analysis

        16.4.1. By Country

        16.4.2. By Treatment

        16.4.3. By Distribution Channel

    16.5. Market Trends

    16.6. Key Market Participants - Intensity Mapping

    16.7. Drivers and Restraints - Impact Analysis

    16.8. Country Level Analysis & Forecast

        16.8.1. Australia Treatment Market

            16.8.1.1. Introduction

            16.8.1.2. Market Analysis and Forecast by Market Taxonomy

                16.8.1.2.1. By Treatment

                16.8.1.2.2. By Distribution Channel

        16.8.2. New Zealand Treatment Market

            16.8.2.1. Introduction

            16.8.2.2. Market Analysis and Forecast by Market Taxonomy

                16.8.2.2.1. By Treatment

                16.8.2.2.2. By Distribution Channel

17. Middle East and Africa Market Analysis 2017 to 2022 and Forecast 2023 to 2033

    17.1. Introduction

    17.2. Historical Market Value (US$ Million) Analysis, By Market Taxonomy 2017 to 2022

    17.3. Current and Future Market Size (US$ Million) Analysis and Forecast, By Market Taxonomy, 2023 to 2033

        17.3.1. By Country

            17.3.1.1. GCC Countries

            17.3.1.2. Türkiye

            17.3.1.3. South Africa

            17.3.1.4. North Africa

            17.3.1.5. Rest of Middle East and Africa

        17.3.2. By Treatment

        17.3.3. By Distribution Channel

    17.4. Market Attractiveness Analysis

        17.4.1. By Country

        17.4.2. By Treatment

        17.4.3. By Distribution Channel

    17.5. Market Trends

    17.6. Key Market Participants - Intensity Mapping

    17.7. Drivers and Restraints - Impact Analysis

    17.8. Country Level Analysis & Forecast

        17.8.1. GCC Countries Market

            17.8.1.1. Introduction

            17.8.1.2. Market Analysis and Forecast by Market Taxonomy

                17.8.1.2.1. By Treatment

                17.8.1.2.2. By Distribution Channel

        17.8.2. Türkiye Market

            17.8.2.1. Introduction

            17.8.2.2. Market Analysis and Forecast by Market Taxonomy

                17.8.2.2.1. By Treatment

                17.8.2.2.2. By Distribution Channel

        17.8.3. South Africa Market

            17.8.3.1. Introduction

            17.8.3.2. Market Analysis and Forecast by Market Taxonomy

                17.8.3.2.1. By Treatment

                17.8.3.2.2. By Distribution Channel

        17.8.4. North Africa Market

            17.8.4.1. Introduction

            17.8.4.2. Market Analysis and Forecast by Market Taxonomy

                17.8.4.2.1. By Treatment

                17.8.4.2.2. By Distribution Channel

18. Market Structure Analysis

    18.1. Market Analysis by Tier of Companies

    18.2. Market Share Analysis (%) of Top Players

    18.3. Market Presence Analysis

        18.3.1. Regional Footprint of Players

        18.3.2. Channel Foot Print by Players

19. Competition Analysis

    19.1. Competition Dashboard

    19.2. Competition Benchmarking

    19.3. Promotional and Branding Strategies by Manufacturers

    19.4. Competition Deep Dive

        19.4.1. Allergan plc. (AbbVie)

            19.4.1.1. Overview

            19.4.1.2. Treatment Portfolio

            19.4.1.3. Sales Footprint

            19.4.1.4. Key Financials

            19.4.1.5. SWOT Analysis

            19.4.1.6. Strategy Overview

        19.4.2. Journey Medical Corporation (Dermira, Inc.)

            19.4.2.1. Overview

            19.4.2.2. Treatment Portfolio

            19.4.2.3. Sales Footprint

            19.4.2.4. Key Financials

            19.4.2.5. SWOT Analysis

            19.4.2.6. Strategy Overview

        19.4.3. Riemann A/S (Orkla)

            19.4.3.1. Overview

            19.4.3.2. Treatment Portfolio

            19.4.3.3. Sales Footprint

            19.4.3.4. Key Financials

            19.4.3.5. SWOT Analysis

            19.4.3.6. Strategy Overview

        19.4.4. SweatBlock

            19.4.4.1. Overview

            19.4.4.2. Treatment Portfolio

            19.4.4.3. Sales Footprint

            19.4.4.4. Key Financials

            19.4.4.5. SWOT Analysis

            19.4.4.6. Strategy Overview

        19.4.5. Certain Dri

            19.4.5.1. Overview

            19.4.5.2. Treatment Portfolio

            19.4.5.3. Sales Footprint

            19.4.5.4. Key Financials

            19.4.5.5. SWOT Analysis

            19.4.5.6. Strategy Overview

        19.4.6. miraDry, Inc. (Sientra)

            19.4.6.1. Overview

            19.4.6.2. Treatment Portfolio

            19.4.6.3. Sales Footprint

            19.4.6.4. Key Financials

            19.4.6.5. SWOT Analysis

            19.4.6.6. Strategy Overview

        19.4.7. STRATUS PHARMACEUTICALS INC

            19.4.7.1. Overview

            19.4.7.2. Treatment Portfolio

            19.4.7.3. Sales Footprint

            19.4.7.4. Key Financials

            19.4.7.5. SWOT Analysis

            19.4.7.6. Strategy Overview

        19.4.8. Duradry

            19.4.8.1. Overview

            19.4.8.2. Treatment Portfolio

            19.4.8.3. Sales Footprint

            19.4.8.4. Key Financials

            19.4.8.5. SWOT Analysis

            19.4.8.6. Strategy Overview

        19.4.9. Persōn & Covey

            19.4.9.1. Overview

            19.4.9.2. Treatment Portfolio

            19.4.9.3. Sales Footprint

            19.4.9.4. Key Financials

            19.4.9.5. SWOT Analysis

            19.4.9.6. Strategy Overview

        19.4.10. GlaxoSmithKline Plc.

            19.4.10.1. Overview

            19.4.10.2. Treatment Portfolio

            19.4.10.3. Sales Footprint

            19.4.10.4. Key Financials

            19.4.10.5. SWOT Analysis

            19.4.10.6. Strategy Overview

        19.4.11. Carpe

            19.4.11.1. Overview

            19.4.11.2. Treatment Portfolio

            19.4.11.3. Sales Footprint

            19.4.11.4. Key Financials

            19.4.11.5. SWOT Analysis

            19.4.11.6. Strategy Overview

        19.4.12. SweatStop® International

            19.4.12.1. Overview

            19.4.12.2. Treatment Portfolio

            19.4.12.3. Sales Footprint

            19.4.12.4. Key Financials

            19.4.12.5. SWOT Analysis

            19.4.12.6. Strategy Overview

        19.4.13. CORAD Healthcare

            19.4.13.1. Overview

            19.4.13.2. Treatment Portfolio

            19.4.13.3. Sales Footprint

            19.4.13.4. Key Financials

            19.4.13.5. SWOT Analysis

            19.4.13.6. Strategy Overview

        19.4.14. ZeroSweat

            19.4.14.1. Overview

            19.4.14.2. Treatment Portfolio

            19.4.14.3. Sales Footprint

            19.4.14.4. Key Financials

            19.4.14.5. SWOT Analysis

            19.4.14.6. Strategy Overview

20. Assumptions and Acronyms Used

21. Research Methodology

Don't pay for what you don't need

Customize your report by selecting specific countries or regions and save 30%!

List of Tables

Table 01: Global Market Analysis 2017 to 2022 and Forecast 2023 to 2033, by Treatment

Table 02: Global Market Analysis 2017 to 2022 and Forecast 2023 to 2033by Distribution Channel

Table 03: Global Market Analysis 2017 to 2022 and Forecast 2023 to 2033, by Region

Table 04: North America Market Value (US$ Million) Analysis 2017 to 2022 and Forecast 2023 to 2033, by Country

Table 05: North America Market Value (US$ Million) Analysis 2017 to 2022 and Forecast 2023 to 2033, by Treatment

Table 06: North America Market Value (US$ Million) Analysis 2017 to 2022 and Forecast 2023 to 2033, by Distribution Channel

Table 07: Latin America Market Value (US$ Million) Analysis 2017 to 2022 and Forecast 2023 to 2033, by Country

Table 08: Latin America Market Value (US$ Million) Analysis 2017 to 2022 and Forecast 2023 to 2033, by Treatment

Table 09: Latin America Market Value (US$ Million) Analysis 2017 to 2022 and Forecast 2023 to 2033, by Distribution Channel

Table 10: Europe Market Value (US$ Million) Analysis 2017 to 2022 and Forecast 2023 to 2033, by Country

Table 11: Europe Market Value (US$ Million) Analysis 2017 to 2022 and Forecast 2023 to 2033, by Treatment

Table 12: Europe Market Analysis 2017 to 2022 and Forecast 2023 to 2033by Distribution Channel

Table 13: East Asia Market Value (US$ Million) Analysis 2017 to 2022 and Forecast 2023 to 2033, by Country

Table 14: East Asia Market Value (US$ Million) Analysis 2017 to 2022 and Forecast 2023 to 2033, by Treatment

Table 15: East Asia Market Value (US$ Million) Analysis 2017 to 2022 and Forecast 2023 to 2033, by Distribution Channel

Table 16: South Asia Market Value (US$ Million) Analysis 2017 to 2022 and Forecast 2023 to 2033, by Country

Table 17: South Asia Market Value (US$ Million) Analysis 2017 to 2022 and Forecast 2023 to 2033, by Treatment

Table 18: South Asia Market Value (US$ Million) Analysis 2017 to 2022 and Forecast 2023 to 2033, by Distribution Channel

Table 19: Oceania Market Value (US$ Million) Analysis 2017 to 2022 and Forecast 2023 to 2033, by Country

Table 20: Oceania Market Value (US$ Million) Analysis 2017 to 2022 and Forecast 2023 to 2033, by Treatment

Table 21: Oceania Market Analysis 2017 to 2022 and Forecast 2023 to 2033 by Distribution Channel

Table 22: Middle East & Africa Market Value (US$ Million) Analysis 2017 to 2022 and Forecast 2023 to 2033, by Country

Table 23: Middle East & Africa Market Value (US$ Million) Analysis 2017 to 2022 and Forecast 2023 to 2033, by Treatment

Table 24: Middle East & Africa Market Analysis 2017 to 2022 and Forecast 2023 to 2033by Distribution Channel
Sabyasachi Ghosh
Sabyasachi Ghosh

Principal Consultant

Talk to Analyst

Find your sweet spots for generating winning opportunities in this market.

List of Charts

Figure 01: Global Market Value (US$ Million) Analysis, 2017 to 2022

Figure 02: Global Market Forecast & Y-o-Y Growth, 2023 to 2033

Figure 03: Global Market Absolute $ Opportunity (US$ Million) Analysis, 2023 to 2033

Figure 04: Global Market Value Share (%) Analysis 2023 and 2033, by Treatment

Figure 05: Global Market Y-o-Y Growth (%) Analysis 2023 to 2033, by Treatment

Figure 06: Global Market Attractiveness Analysis 2023 to 2033, by Treatment

Figure 07: Global Market Value Share (%) Analysis 2023 and 2033, by Distribution Channel

Figure 08: Global Market Y-o-Y Growth (%) Analysis 2023 to 2033, by Distribution Channel

Figure 09: Global Market Attractiveness Analysis 2023 to 2033, by Distribution Channel

Figure 10: Global Market Value Share (%) Analysis 2023 and 2033, by Region

Figure 11: Global Market Y-o-Y Growth (%) Analysis 2023 to 2033, by Region

Figure 12: Global Market Attractiveness Analysis 2023 to 2033, by Region

Figure 13: North America Market Value (US$ Million) Analysis, 2017 to 2022

Figure 14: North America Market Value (US$ Million) Forecast, 2023 to 2033

Figure 15: North America Market Value Share, by Treatment (2023 E)

Figure 16: North America Market Value Share, by Distribution Channel (2023 E)

Figure 17: North America Market Value Share, by Country (2023 E)

Figure 18: North America Market Attractiveness Analysis by Treatment, 2023 to 2033

Figure 19: North America Market Attractiveness Analysis by Distribution Channel, 2023 to 2033

Figure 20: North America Market Attractiveness Analysis by Country, 2023 to 2033

Figure 21: USA Market Value Proportion Analysis, 2022

Figure 22: Global Vs. USA Growth Comparison

Figure 23: USA Market Share Analysis (%) by Treatment, 2023 & 2033

Figure 24: USA Market Share Analysis (%) by Distribution Channel, 2023 & 2033

Figure 25: Canada Market Value Proportion Analysis, 2022

Figure 26: Global Vs. Canada. Growth Comparison

Figure 27: Canada Market Share Analysis (%) by Treatment, 2023 & 2033

Figure 28: Canada Market Share Analysis (%) by Distribution Channel, 2023 & 2033

Figure 29: Latin America Market Value (US$ Million) Analysis, 2017 to 2022

Figure 30: Latin America Market Value (US$ Million) Forecast, 2023 to 2033

Figure 31: Latin America Market Value Share, by Treatment (2023 E)

Figure 32: Latin America Market Value Share, by Distribution Channel (2023 E)

Figure 33: Latin America Market Value Share, by Country (2023 E)

Figure 34: Latin America Market Attractiveness Analysis by Treatment, 2023 to 2033

Figure 35: Latin America Market Attractiveness Analysis by Distribution Channel, 2023 to 2033

Figure 36: Latin America Market Attractiveness Analysis by Country, 2023 to 2033

Figure 37: Mexico Market Value Proportion Analysis, 2022

Figure 38: Global Vs Mexico Growth Comparison

Figure 39: Mexico Market Share Analysis (%) by Treatment, 2023 & 2033

Figure 40: Mexico Market Share Analysis (%) by Distribution Channel, 2023 & 2033

Figure 41: Brazil Market Value Proportion Analysis, 2022

Figure 42: Global Vs. Brazil. Growth Comparison

Figure 43: Brazil Market Share Analysis (%) by Treatment, 2023 & 2033

Figure 44: Brazil Market Share Analysis (%) by Distribution Channel, 2023 & 2033

Figure 45: Argentina Market Value Proportion Analysis, 2022

Figure 46: Global Vs Argentina Growth Comparison

Figure 47: Argentina Market Share Analysis (%) by Treatment, 2023 & 2033

Figure 48: Argentina Market Share Analysis (%) by Distribution Channel, 2023 & 2033

Figure 49: Europe Market Value (US$ Million) Analysis, 2017 to 2022

Figure 50: Europe Market Value (US$ Million) Forecast, 2023 to 2033

Figure 51: Europe Market Value Share, by Treatment (2023 E)

Figure 52: Europe Market Value Share, by Distribution Channel (2023 E)

Figure 53: Europe Market Value Share, by Country (2023 E)

Figure 54: Europe Market Attractiveness Analysis by Treatment, 2023 to 2033

Figure 55: Europe Market Attractiveness Analysis by Distribution Channel, 2023 to 2033

Figure 56: Europe Market Attractiveness Analysis by Country, 2023 to 2033

Figure 57: UK Market Value Proportion Analysis, 2022

Figure 58: Global Vs. UK Growth Comparison

Figure 59: UK Market Share Analysis (%) by Treatment, 2023 & 2033

Figure 60: UK Market Share Analysis (%) by Distribution Channel, 2023 & 2033

Figure 61: Germany Market Value Proportion Analysis, 2022

Figure 62: Global Vs. Germany Growth Comparison

Figure 63: Germany Market Share Analysis (%) by Treatment, 2023 & 2033

Figure 64: Germany Market Share Analysis (%) by Distribution Channel, 2023 & 2033

Figure 65: Italy Market Value Proportion Analysis, 2022

Figure 66: Global Vs. Italy Growth Comparison

Figure 67: Italy Market Share Analysis (%) by Treatment, 2023 & 2033

Figure 68: Italy Market Share Analysis (%) by Distribution Channel, 2023 & 2033

Figure 69: France Market Value Proportion Analysis, 2022

Figure 70: Global Vs France Growth Comparison

Figure 71: France Market Share Analysis (%) by Treatment, 2023 & 2033

Figure 72: France Market Share Analysis (%) by Distribution Channel, 2023 & 2033

Figure 73: Spain Market Value Proportion Analysis, 2022

Figure 74: Global Vs Spain Growth Comparison

Figure 75: Spain Market Share Analysis (%) by Treatment, 2023 & 2033

Figure 76: Spain Market Share Analysis (%) by Distribution Channel, 2023 & 2033

Figure 77: Russia Market Value Proportion Analysis, 2022

Figure 78: Global Vs Russia Growth Comparison

Figure 79: Russia Market Share Analysis (%) by Treatment, 2023 & 2033

Figure 80: Russia Market Share Analysis (%) by Distribution Channel, 2023 & 2033

Figure 81: BENELUX Market Value Proportion Analysis, 2022

Figure 82: Global Vs BENELUX Growth Comparison

Figure 83: BENELUX Market Share Analysis (%) by Treatment, 2023 & 2033

Figure 84: BENELUX Market Share Analysis (%) by Distribution Channel, 2023 & 2033

Figure 85: Nordics Market Value Proportion Analysis, 2022

Figure 86: Global Vs Nordics Growth Comparison

Figure 87: Nordics Market Share Analysis (%) by Treatment, 2023 & 2033

Figure 88: Nordics Market Share Analysis (%) by Distribution Channel, 2023 & 2033

Figure 89: East Asia Market Value (US$ Million) Analysis, 2017 to 2022

Figure 90: East Asia Market Value (US$ Million) Forecast, 2023 to 2033

Figure 91: East Asia Market Value Share, by Treatment (2023 E)

Figure 92: East Asia Market Value Share, by Distribution Channel (2023 E)

Figure 93: East Asia Market Value Share, by Country (2023 E)

Figure 94: East Asia Market Attractiveness Analysis by Treatment, 2023 to 2033

Figure 95: East Asia Market Attractiveness Analysis by Distribution Channel, 2023 to 2033

Figure 96: East Asia Market Attractiveness Analysis by Country, 2023 to 2033

Figure 97: China Market Value Proportion Analysis, 2022

Figure 98: Global Vs. China Growth Comparison

Figure 99: China Market Share Analysis (%) by Treatment, 2023 & 2033

Figure 100: China Market Share Analysis (%) by Distribution Channel, 2023 & 2033

Figure 101: Japan Market Value Proportion Analysis, 2022

Figure 102: Global Vs. Japan Growth Comparison

Figure 103: Japan Market Share Analysis (%) by Treatment, 2023 & 2033

Figure 104: Japan Market Share Analysis (%) by Distribution Channel, 2023 & 2033

Figure 105: South Korea Market Value Proportion Analysis, 2022

Figure 106: Global Vs South Korea Growth Comparison

Figure 107: South Korea Market Share Analysis (%) by Treatment, 2023 & 2033

Figure 108: South Korea Market Share Analysis (%) by Distribution Channel, 2023 & 2033

Figure 109: South Asia Market Value (US$ Million) Analysis, 2017 to 2022

Figure 110: South Asia Market Value (US$ Million) Forecast, 2023 to 2033

Figure 111: South Asia Market Value Share, by Treatment (2023 E)

Figure 112: South Asia Market Value Share, by Distribution Channel (2023 E)

Figure 113: South Asia Market Value Share, by Country (2023 E)

Figure 114: South Asia Market Attractiveness Analysis by Treatment, 2023 to 2033

Figure 115: South Asia Market Attractiveness Analysis by Distribution Channel, 2023 to 2033

Figure 116: South Asia Market Attractiveness Analysis by Country, 2023 to 2033

Figure 117: India Market Value Proportion Analysis, 2022

Figure 118: Global Vs. India Growth Comparison

Figure 119: India Market Share Analysis (%) by Treatment, 2023 & 2033

Figure 120: India Market Share Analysis (%) by Distribution Channel, 2023 & 2033

Figure 121: Indonesia Market Value Proportion Analysis, 2022

Figure 122: Global Vs. Indonesia Growth Comparison

Figure 123: Indonesia Market Share Analysis (%) by Treatment, 2023 & 2033

Figure 124: Indonesia Market Share Analysis (%) by Distribution Channel, 2023 & 2033

Figure 125: Malaysia Market Value Proportion Analysis, 2022

Figure 126: Global Vs. Malaysia Growth Comparison

Figure 127: Malaysia Market Share Analysis (%) by Treatment, 2023 & 2033

Figure 128: Malaysia Market Share Analysis (%) by Distribution Channel, 2023 & 2033

Figure 129: Thailand Market Value Proportion Analysis, 2022

Figure 130: Global Vs. Thailand Growth Comparison

Figure 131: Thailand Market Share Analysis (%) by Treatment, 2023 & 2033

Figure 132: Thailand Market Share Analysis (%) by Distribution Channel, 2023 & 2033

Figure 133: Oceania Market Value (US$ Million) Analysis, 2017 to 2022

Figure 134: Oceania Market Value (US$ Million) Forecast, 2023 to 2033

Figure 135: Oceania Market Value Share, by Treatment (2023 E)

Figure 136: Oceania Market Value Share, by Distribution Channel (2023 E)

Figure 137: Oceania Market Value Share, by Country (2023 E)

Figure 138: Oceania Market Attractiveness Analysis by Treatment, 2023 to 2033

Figure 139: Oceania Market Attractiveness Analysis by Distribution Channel, 2023 to 2033

Figure 140: Oceania Market Attractiveness Analysis by Country, 2023 to 2033

Figure 141: Australia Market Value Proportion Analysis, 2022

Figure 142: Global Vs. Australia Growth Comparison

Figure 143: Australia Market Share Analysis (%) by Treatment, 2023 & 2033

Figure 144: Australia Market Share Analysis (%) by Distribution Channel, 2023 & 2033

Figure 145: New Zealand Market Value Proportion Analysis, 2022

Figure 146: Global Vs New Zealand Growth Comparison

Figure 147: New Zealand Market Share Analysis (%) by Treatment, 2023 & 2033

Figure 148: New Zealand Market Share Analysis (%) by Distribution Channel, 2023 & 2033

Figure 149: Middle East & Africa Market Value (US$ Million) Analysis, 2017 to 2022

Figure 150: Middle East & Africa Market Value (US$ Million) Forecast, 2023 to 2033

Figure 151: Middle East & Africa Market Value Share, by Treatment (2023 E)

Figure 152: Middle East & Africa Market Value Share, by Distribution Channel (2023 E)

Figure 153: Middle East & Africa Market Value Share, by Country (2023 E)

Figure 154: Middle East & Africa Market Attractiveness Analysis by Treatment, 2023 to 2033

Figure 155: Middle East & Africa Market Attractiveness Analysis by Distribution Channel, 2023 to 2033

Figure 156: Middle East & Africa Market Attractiveness Analysis by Country, 2023 to 2033

Figure 157: GCC Countries Market Value Proportion Analysis, 2022

Figure 158: Global Vs GCC Countries Growth Comparison

Figure 159: GCC Countries Market Share Analysis (%) by Treatment, 2023 & 2033

Figure 160: GCC Countries Market Share Analysis (%) by Distribution Channel, 2023 & 2033

Figure 161: Türkiye Market Value Proportion Analysis, 2022

Figure 162: Global Vs. Türkiye Growth Comparison

Figure 163: Türkiye Market Share Analysis (%) by Treatment, 2023 & 2033

Figure 164: Türkiye Market Share Analysis (%) by Distribution Channel, 2023 & 2033

Figure 165: South Africa Market Value Proportion Analysis, 2022

Figure 166: Global Vs. South Africa Growth Comparison

Figure 167: South Africa Market Share Analysis (%) by Treatment, 2023 & 2033

Figure 168: South Africa Market Share Analysis (%) by Distribution Channel, 2023 & 2033

Figure 169: North Africa Market Value Proportion Analysis, 2022

Figure 170: Global Vs North Africa Growth Comparison

Figure 171: North Africa Market Share Analysis (%) by Treatment, 2023 & 2033

Figure 172: North Africa Market Share Analysis (%) by Distribution Channel, 2023 & 2033

Recommendations

Healthcare

Obesity Management Market

Published : July 2023

Healthcare

Dermal Fillers and Botulinum Toxin Market

Published : October 2022

Healthcare

Diabetes Care Devices Market

Published : July 2022

Explore Healthcare Insights

View Reports

Axillary Hyperhidrosis Treatment Market