
- Market Size (2026)
- USD 601.3 Mn
- Forecast (2036)
- USD 1107.6 Mn
- CAGR (2026 to 2036)
- 6.3%
How Big Is the Caffeine Supplements Market in 2026?
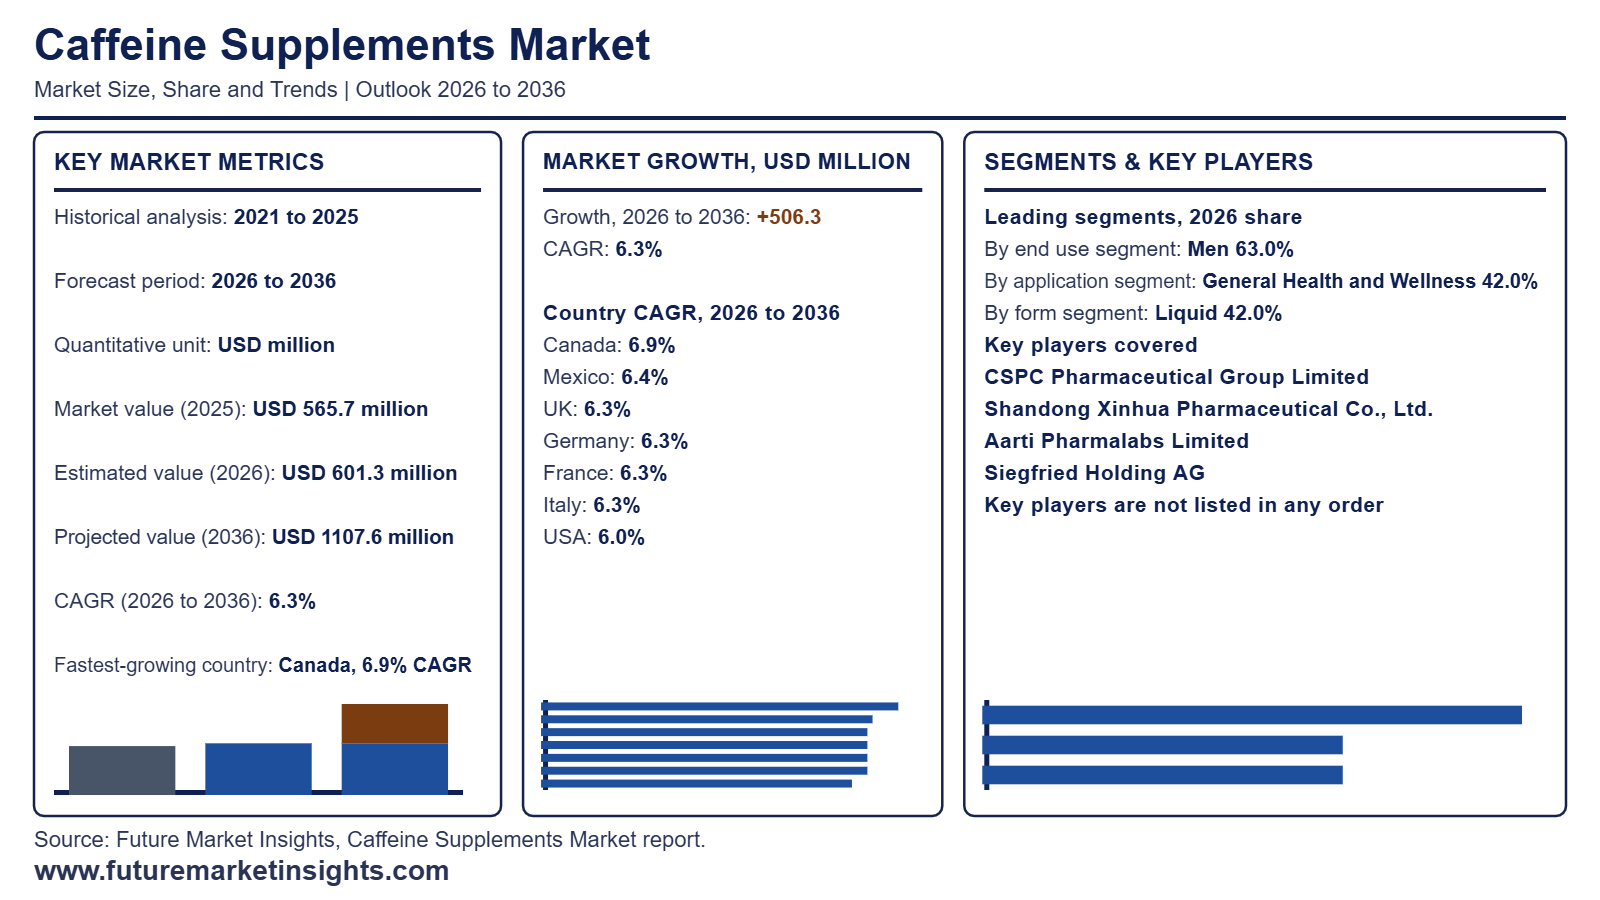
Starting from USD 565.7 million in 2025, the global caffeine supplements market valuation reached USD 601.3 million in 2026, with projections pointing toward USD 1,107.6 million by 2036 at a CAGR of 6.3%.
| Market Metric | Valuation / Share / Forecast Benchmark |
|---|---|
| 2025 Market Size (Historical) | USD 565.7 million |
| 2026 Market Size (Estimated) | USD 601.3 million |
| 2036 Market Size (Projected) | USD 1,107.6 million |
| Compound Annual Growth Rate (2026 to 2036) | 6.3% CAGR |
| Incremental Dollar Opportunity (2026 to 2036) | USD 506.3 million |
| Dominant End Use Segment (2026 Share) | Men (63.0% share in 2026) | Other Segment Combined (37.0%) |
| Leading Application Segment (2026 Share) | General Health and Wellness (42.0% share in 2026) | Other Segment Combined (58.0%) |
| Leading Form Segment (2026 Share) | Liquid (42.0% share in 2026) | Other Segment Combined (58.0%) |
| Leading Distribution Channel (2026 Share) | Online (39.0% share in 2026) | Other Segment Combined (61.0%) |
| Fastest-Growing Country Markets (2026 to 2036) | Canada (6.9% CAGR), Mexico (6.4% CAGR), UK (6.3% CAGR) |
| Leading Tier-1 Companies | CSPC Pharmaceutical Group Limited, Shandong Xinhua Pharmaceutical Co., Ltd., Aarti Pharmalabs Limited, Siegfried Holding AG |
Source: Future Market Insights analysis of the caffeine supplements market, 2026.
This Report Answers
- How large the caffeine supplements market is in 2026 and what it reaches by 2036
- Which end use, application, form and distribution channel segments lead in 2026
- What is driving demand and what is holding the category back
- Which countries grow fastest between 2026 and 2036
- What CSPC Pharmaceutical Group Limited and other leading players have launched
- How the caffeine supplements market is defined, segmented and measured
Executive Market Overview
Athletes and shift workers are adopting anhydrous caffeine tablets and chewable gummies for calibrated, sugar-free alertness, avoiding the high fluid volumes of conventional energy drinks. USD 601.3 million in 2026, up from USD 565.7 million in 2025, and is projected to attain USD 1,107.6 million by 2036 at a 6.3% CAGR, generating USD 506.3 million in incremental revenue over the decade. FMI finds that buyer adoption is expanding as gym members and shift workers choose calibrated stimulant servings over variable coffee or carbonated beverage intake, owing to demand for predictable alertness with pre-workout supplements. Controlled clinical data published in PubMed (February 2026) confirm that acute caffeine supplementation increased static and 60-degree-per-second peak muscle torque by 4.0% at p <= 0.003 while raising post-exercise blood lactate by 1.2 mmol/L across resistance-trained adults. Brand owners pairing verified milligram potency with clean energy supplement positioning secure higher subscription retention across specialty nutrition channels through 2036.
National regulatory thresholds create distinct commercialization paths across major supplement markets. FMI observes that food safety authorities are tightening enforcement against unmeasured bulk stimulant powders and unverified potency declarations, attributed to acute toxicity risks when consumers portion concentrated powders at home. Operator compliance rules issued by Food Standards Scotland (June 2025) instruct supplement manufacturers and distributors to calculate cumulative caffeine contributions from all botanical sources and including guarana milligram-per-serving warnings on retail packs. Market sizing includes standalone oral caffeine supplements sold in liquid and powder formats, while excluding brewed coffee, ready-to-drink energy beverages, cosmetic topical formulations, and prescription pharmaceuticals.
Analyst Perspective
"Caffeine supplement brand owners will expand unit margins faster than raw gram volume through 2036 because retail buyers pay a compliance premium for third-party-verified single-dose shots and capsules. The primary commercial risk is regulatory delisting triggered when finished batches deviate from declared milligram potency during retail surveillance audits.","
- Nandini Roy Choudhury, Principal Consultant, Future Market Insights (FMI)
Key Market Trends & Insights
- Calibrated Unit-Dose Formats Replace Bulk Powder Consumption: Consumer transition away from unmeasured commodity caffeine powders toward tamper-evident capsules and effervescent tablets shots reduces dosing error risks and expands everyday workplace use.
- Pharmaceutical-Grade Impurity Testing Becomes Retail Gateway: Major sports-nutrition chains and mass retailers enforce strict USP/EP heavy metal testing and microbiological assays screenings before listing synthetic or natural caffeine SKUs.
- Clean-Label Functional Combination with Nootropics Expands Everyday Vitality Appeal: Formulators are pairing pharmaceutical-grade anhydrous caffeine with botanical extracts and L-theanine provide sustained alertness without jitteriness, broadening consumer adoption beyond bodybuilders.
What Are the Main Drivers, Restraints, and Opportunities?
Rising demand for premeasured alertness solutions and rigorous safety compliance shape global caffeine supplements market dynamics.
Driver: Precision Micro-Dosing and Sugar-Free Energy Transition
Primary demand driver is buyer migration toward exact, repeatable caffeine milligram servings that eliminate the caloric load and brewing variability of traditional beverages. FMI finds that sports nutrition brands are scaling multi-tiered stimulant portfoliosspanning 100 mg everyday focus capsules to 300 mg performance scoops to capture structured gym routines across Australia sports nutrition and North American specialty channels. Investor disclosures from Glanbia plc (November 2025) at its 2025 Capital Markets Day confirm that Optimum Nutrition continues to expand global distribution of its pre-workout and AMIN.O. Energy supplement lines to serve everyday energy and training occasions. Brand owners that pair transparent milligram labeling with zero-sugar formulation retain consistent repeat purchasing across fitness and occupational cohorts.
Restraint: Regulatory Dose Thresholds and Mandatory Adulteration Controls
Principal commercial restraint arises from finished-product potency deviations and regulatory enforcement against inaccurately labeled supplements. When contract manufacturers fail to blend caffeine uniformly with nutraceutical excipients or finished tablets exceed declared serving limits and trigger mandatory retail withdrawals. On July 9, 2025, the UK Food Standards Agency (July 2025) published results from its targeted Retail Surveillance Survey, revealing that 83% of tested caffeine food supplement samples failed compliance checks due to discrepancies between actual and declared caffeine content or incomplete statutory warning labels. Retailers and pharmacy chains consequently require finished-batch high-performance liquid chromatography (HPLC) assay certificates before approving shelf listings and increasing working-capital for smaller supplement formulators.
Opportunity: Independently Assayed Liquid Vials and Multi-Tier Retail Channels
A high-margin commercial opportunity lies in supplying premeasured unit-dose formats verified by pharmaceutical-grade raw material traceability and compendial certification. FMI expects supplement formulators that combine standardized botanical extracts or compendial synthetic caffeine with batch-level certificates of analysis to secure preferential onboarding across national pharmacy and mass-grocery chains. Scientific specification documentation released by Spectrum Chemical Mfg Corp (June 2026) on June 8, 2026 for Caffeine Anhydrous USP (Catalog C4036) establishes a 98.5% to 101.0% dry-basis assay standard, a maximum 0.5% water limit, and strict elemental impurity thresholds under USP packaging rules. Supplement brands that audit raw-material lots against compendial benchmarks and package servings in unit-dose blisters or shots can command premium pricing through 2036.
How Is the Caffeine Supplements Market Segmented?
Category momentum is segmented by End Use and Application major consumer regions.
| Segmentation Axis | Sub-Segments Covered | 2026 Leading Segment & Share | Other Segment Combined & Total |
|---|---|---|---|
| End Use | Men, Women | Men (63.0% share in 2026) | Other Segment Combined (37.0%) | Total (100.0%) |
| Application | General Health and Wellness, Sports Nutrition, Cognitive Support, Weight Management | General Health and Wellness (42.0% share in 2026) | Other Segment Combined (58.0%) | Total (100.0%) |
| Form | Liquid, Capsules/Tablets, Powder, Gummies | Liquid (42.0% share in 2026) | Other Segment Combined (58.0%) | Total (100.0%) |
| Distribution Channel | Online, Specialty Stores, Supermarkets/Hypermarkets, Pharmacies | Online (39.0% share in 2026) | Other Segment Combined (61.0%) | Total (100.0%) |
| Region | North America, Latin America, Western Europe, Eastern Europe, East Asia, South Asia, Middle East and Africa | North America (led by USA at 6.0% CAGR) | Global Coverage Across 7 Core Countries (100.0%) |
Source: Future Market Insights analysis of the caffeine supplements market, 2026.
What Supports Men as the Leading End Use Segment?
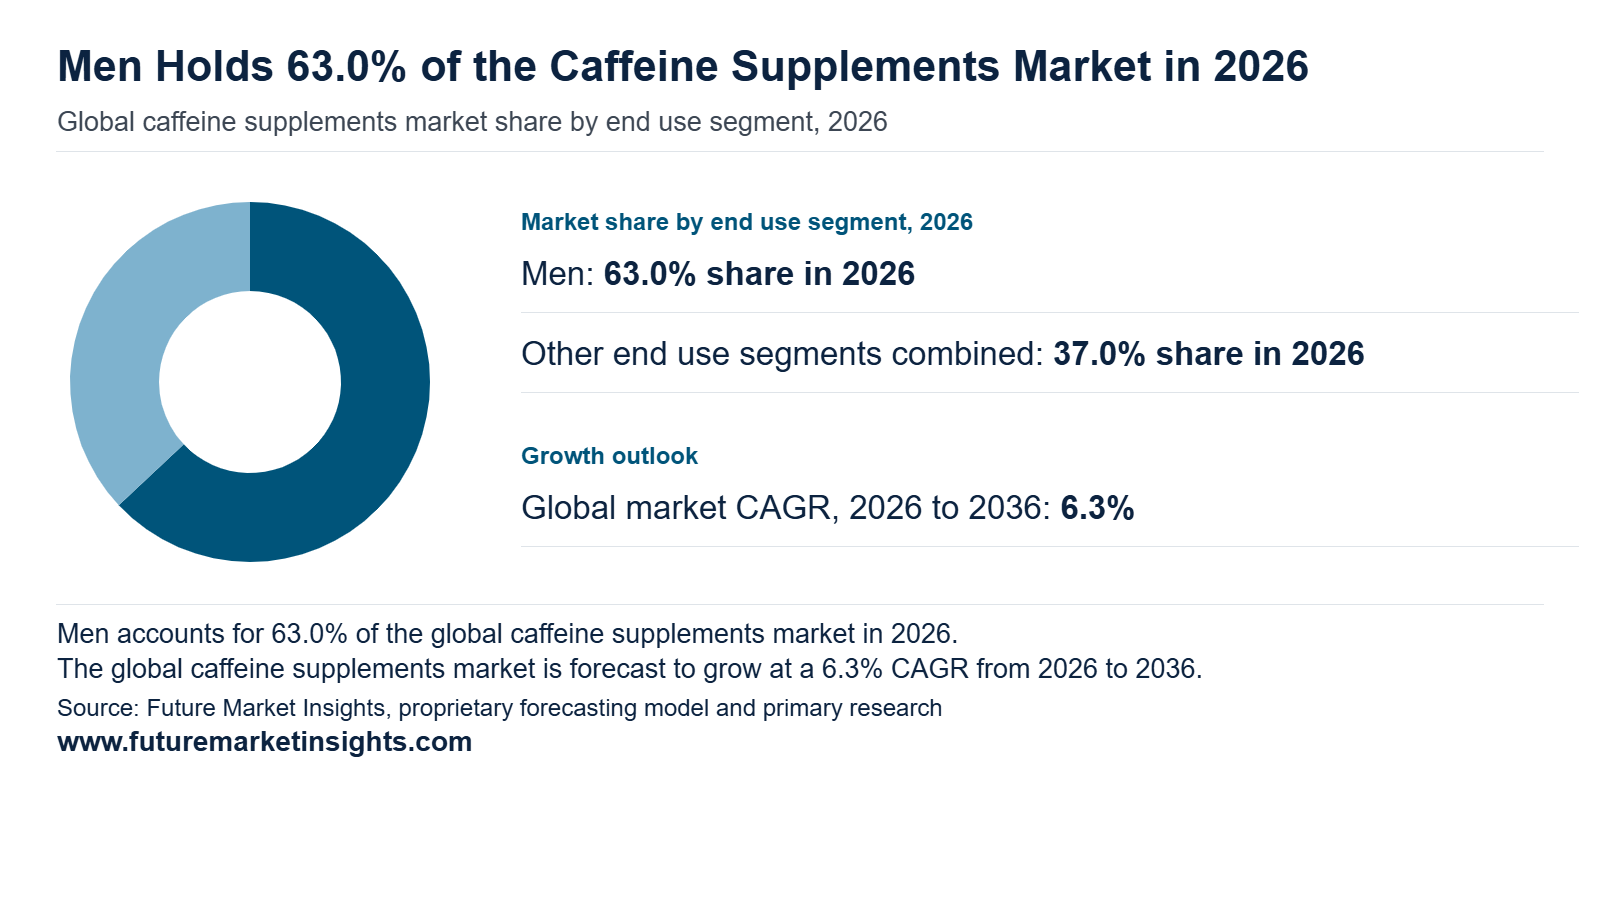
Men varieties secure a leading 63.0% share of End Use revenue in 2026, supported by high participation in structured resistance training and routine pre-exercise stimulant regimens across Europe sports nutrition aisles to sustain power output during high-volume lifting sessions. Experimental results published in PubMed (September 2025) from a 4-week controlled resistance-training trial of 28 young adults taking 6 mg/kg of caffeine one hour prior to blood-flow-restricted exercise confirmed a statistically significant reduction in force fluctuations and improved motor-unit discharge precision. Formulators are now introducing lower-milligram split-dose options to expand adoption among female fitness buyers through 2036. Controlled trial data in PubMed (September 2025) showed 6 mg/kg pre-exercise caffeine improved neuromuscular force-release precision over a 4-week training cycle.
Why Is General Health and Wellness the Leading Application?
General Health and Wellness represents the commercial foundation of Application demand with a 42.0% share in 2026, as buyers prioritize formulations where daily cognitive alertness and shift-work wakefulness occasions that occur far more frequently than competitive athletic events. synephrine for metabolic support. A randomized double-masked crossover trial of 27 runners published in PubMed (October 2026) demonstrated that isolated 6 mg/kg caffeine supplementation ingested 45 minutes before activity significantly reduced 10-km completion time at p = 0.0049 and elevated perceived vigor scores. Clear on-pack dosing instructions remain essential to sustain repeat household purchases through 2036. Clinical crossover findings in PubMed (October 2026) confirmed significant completion-time reductions (p = 0.0049) and heightened vigor from 6 mg/kg caffeine dosing.
Why Does Liquid Lead the Form Mix?
Liquid varieties secure a leading 42.0% share of Form revenue in 2026, favored for rapid gastrointestinal absorption and convenience during commuting, complementing chewable coffee gummy supplements attract casual afternoon users, pre-portioned 25 mL to 75 mL liquid vials allow manufacturers to lock in exact single-serving caffeine ceilings. In its updated scientific opinion, the German Federal Institute for Risk Assessment (July 2026) reaffirmed that single acute oral caffeine doses up to 200 mg (or 3 mg/kg body weight) pose no cardiovascular safety concern for healthy adults when portion sizes are strictly controlled. Child-resistant caps and tamper-evident unit vials will govern retail shelf approvals through 2036. Official safety evaluations from German Federal Institute for Risk Assessment (July 2026) validated 200 mg single-dose safety benchmarks when liquid portions prevent accidental overconsumption.
What Keeps Online Ahead in Distribution Channel?
Online channels anchor 63.0% of category sales in 2026, maintaining retail dominance because recurring multi-month bottle subscriptions and instant buyer access to third-party batch assay certificates. nutraceutical gummies rely on digital product pages to verify exact milligram strength per serving before checkout. However, digital channels face intensifying regulatory surveillance: on August 4, 2026, Mexico's COFEPRIS (August 2026) conducted a joint enforcement operation with federal cyber units to remove irregular dietary supplement listings across social media and e-commerce platforms. Verified marketplace sellers that publish lot-specific analytical documentation will capture the strongest online reorder velocity through 2036. Joint digital enforcement by COFEPRIS (August 2026) penalizes unverified e-commerce supplement claims and rewards compliant brand storefronts.
Regional & Country Outlook
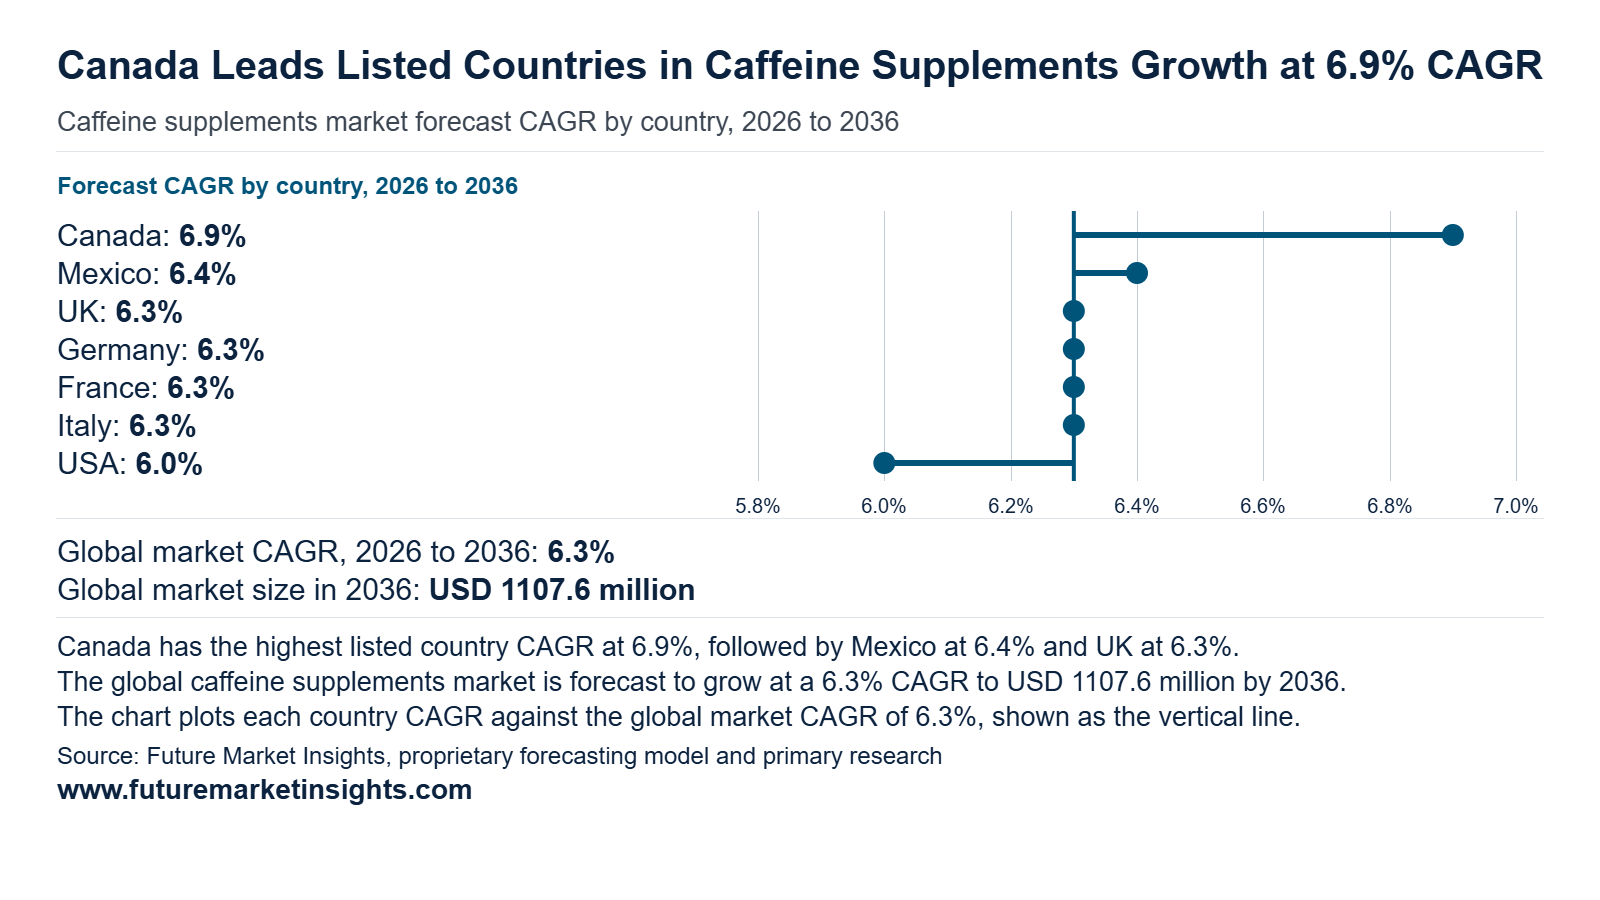
Regional growth is led by North America and Europe, corroborated by mature sports-nutrition retail networks and expanding online direct-to-consumer sales.
| Country | 2026 Revenue | 2036 Revenue | 10-Year Addition | 2026 to 2036 CAGR | Global Share (2026 -> 2036) |
|---|---|---|---|---|---|
| Canada | USD 27.1 million | USD 52.8 million | +USD 25.7 million | 6.9% | 4.5% -> 4.8% |
| Mexico | USD 21.0 million | USD 39.1 million | +USD 18.1 million | 6.4% | 3.5% -> 3.5% |
| UK | USD 42.1 million | USD 77.5 million | +USD 35.4 million | 6.3% | 7.0% -> 7.0% |
| Germany | USD 45.1 million | USD 83.1 million | +USD 38.0 million | 6.3% | 7.5% -> 7.5% |
| France | USD 33.1 million | USD 61.0 million | +USD 27.9 million | 6.3% | 5.5% -> 5.5% |
| Italy | USD 30.1 million | USD 55.4 million | +USD 25.3 million | 6.3% | 5.0% -> 5.0% |
| USA | USD 204.4 million | USD 366.1 million | +USD 161.7 million | 6.0% | 34.0% -> 33.1% |
Source: Future Market Insights analysis of regional caffeine supplements markets, 2026.
Canada
Demand for caffeine supplements in Canada is projected to rise from USD 27.1 million in 2026 to USD 52.8 million by 2036, advancing at a 6.9% CAGR and adding USD 25.7 million in new revenue. Canada is projected to expand at a 6.9% CAGR from 2026 to 2036, driven by structured regulatory clarity for licensed pre-workout and cognitive alertness products. FMI finds that Canadian pharmacy and specialty nutrition buyers prioritize supplements carrying a valid eight-digit Natural Product Number (NPN) with standardized botanical ingredients. In its updated Natural Health Product Caffeine Monograph, Health Canada (December 2025) established specific daily dose thresholds on December 19, 2025 that permit transient mental alertness and endurance performance claims while restricting broad general-health positioning at higher caffeine intakes. Formulators that reconcile total caffeine across all active ingredients and secure NPN licensing will capture expanding shelf space across Canadian grocery and e-commerce channels through 2036.
Mexico
Buyer adoption of caffeine supplements across Mexico is estimated to expand from USD 21.0 million in 2026 to USD 39.1 million by 2036, spurred by a 6.4% CAGR and generating USD 18.1 million in commercial expansion. Mexico is forecast to grow at a 6.4% CAGR between 2026 and 2036, attributed to expanding urban gym membership and direct-to-consumer sports supplement purchasing. In FMI's view, commercial execution in Mexico depends on strict adherence to statutory dosage-form boundaries rather than copying North American confectionery or thermogenic labels. Regulatory classification guidance updated by COFEPRIS (July 2025) on July 25, 2025 specifies acceptable oral supplement presentations such as capsules and tablets explicitly excluding candy and chewing gum formats and prohibiting weight-loss or obesity-treatment claims. Domestic and importing brands that register compliant capsule and liquid-shot labels will secure durable wholesale accounts across Mexican pharmacy and fitness chains through 2036.
UK
Caffeine supplements industry in the UK is set to scale from USD 42.1 million in 2026 to USD 77.5 million by 2036, driven by a 6.3% CAGR and adding USD 35.4 million in incremental market value. Throughout the UK, caffeine supplements market is projected to advance at a 6.3% CAGR over 2026 to 2036, helped by established online sports-nutrition purchasing and pharmacy chain distribution. FMI observes that UK retail procurement teams now treat upstream active-ingredient traceability and finished-batch assay verification as mandatory gating criteria before listing stimulant SKUs. Official regulatory registration records published by the UK Medicines and Healthcare products Regulatory Agency (May 2025) on May 20, 2025 under UK API Registration 41517 document audited active-substance supply chains connecting certified caffeine-anhydrous producers to UK formulation plants. Supplement brands that pair traceable API sourcing with independent finished-product potency certificates will protect retail listings and sustain steady reorder velocity across the UK through 2036.
Germany
Sales of caffeine supplements throughout Germany are projected to increase from USD 45.1 million in 2026 to USD 83.1 million by 2036, progressing at a 6.3% CAGR and creating USD 38.0 million in additional revenue. Germany carries a 6.3% CAGR forecast from 2026 to 2036, on account of rising consumer transitions from sugared energy beverages toward portion-controlled stimulant capsules and unit shots with herbal tea infusions. FMI believes German drugstore and e-commerce buyers strongly favor pre-encapsulated and unit-vial formats over loose bulk powders because domestic risk assessments warn against home dose measurement. In its updated evaluation published on May 1, 2026, the German Federal Institute for Risk Assessment (May 2026) highlighted that 0.2 grams of pure caffeine powder equals the 200 mg maximum single adult dose and cannot be measured accurately on conventional 1-gram kitchen scales. Manufacturers supplying blister-packed 100 mg and 200 mg tablets will lead German retail expansion through 2036.
France
Consumption of caffeine supplements across France is estimated to climb from USD 33.1 million in 2026 to USD 61.0 million by 2036, reflecting a 6.3% CAGR and contributing USD 27.9 million over the forecast decade. France is projected to record a 6.3% CAGR between 2026 and 2036, anchored by pharmacy-led nutricosmetic and everyday vitality supplement purchasing. FMI's analysis indicates that multinational supplement vendors entering France must calibrate serving instructions to national daily intake ceilings rather than deploying high-stimulant U.S. pre-workout labels. Consumer protection guidance issued by the French Ministry of the Economy (July 2025) on July 15, 2025 reinforces France's statutory 200 mg recommended daily caffeine limit for food supplements while warning buyers against non-compliant internet imports that lack mandatory French allergen and contraindication statements. Suppliers that formulate compliant<=200 mg daily servings with clear pharmacy-grade labeling will capture steady repeat demand across French para-pharmacies through 2036.
Italy
Revenue generated by caffeine supplements suppliers in Italy is forecast to expand from USD 30.1 million in 2026 to USD 55.4 million by 2036, anchored by a 6.3% CAGR and generating USD 25.3 million in new category sales. Italy is forecast to expand at a 6.3% CAGR from 2026 to 2036, fueled by endurance cycling and running demand across pharmacy and online channels. In FMI's assessment, Italian regulatory oversight places strict boundaries on route-of-administration claims and digital promotional language for stimulant powders. On February 13, 2025, the Italian Ministry of Health (February 2025) issued an official enforcement notice challenging caffeinated and stimulant powders promoted online for nasal inhalation, reiterating that food supplements must be formulated and labeled exclusively for oral ingestion. Brand owners that maintain strict oral-use positioning, notified ministry labels, and premeasured single-serve sachets or capsules will build durable pharmacy and supermarket distribution across Italy through 2036.
USA
Buyer procurement of caffeine supplements throughout the USA is tracking from USD 204.4 million in 2026 to USD 366.1 million by 2036, exhibiting a 6.0% CAGR and contributing USD 161.7 million to national market value. Across the USA, is projected to grow at a 6.0% CAGR over 2026 to 2036, as a result of mature omni-channel distribution across specialty fitness chains and mass grocers platforms. FMI notes that U.S. growth relies on upgrading consumers to third-party-certified capsules and ready-to-drink shots enriched with natural flavours while complying with federal enforcement against unmeasured bulk caffeine. On April 7, 2026, the U.S. Food and Drug Administration (April 2026) issued Warning Letter 722215 enforcing federal compliance against unapproved online product claims and reiterating mandatory 21 CFR Part 111 current Good Manufacturing Practice controls. Supplement brands that document lot-to-label strength accuracy and third-party banned-substance testing will sustain high-volume U.S. retail reorders through 2036.
Competitive Environment and Notable Companies
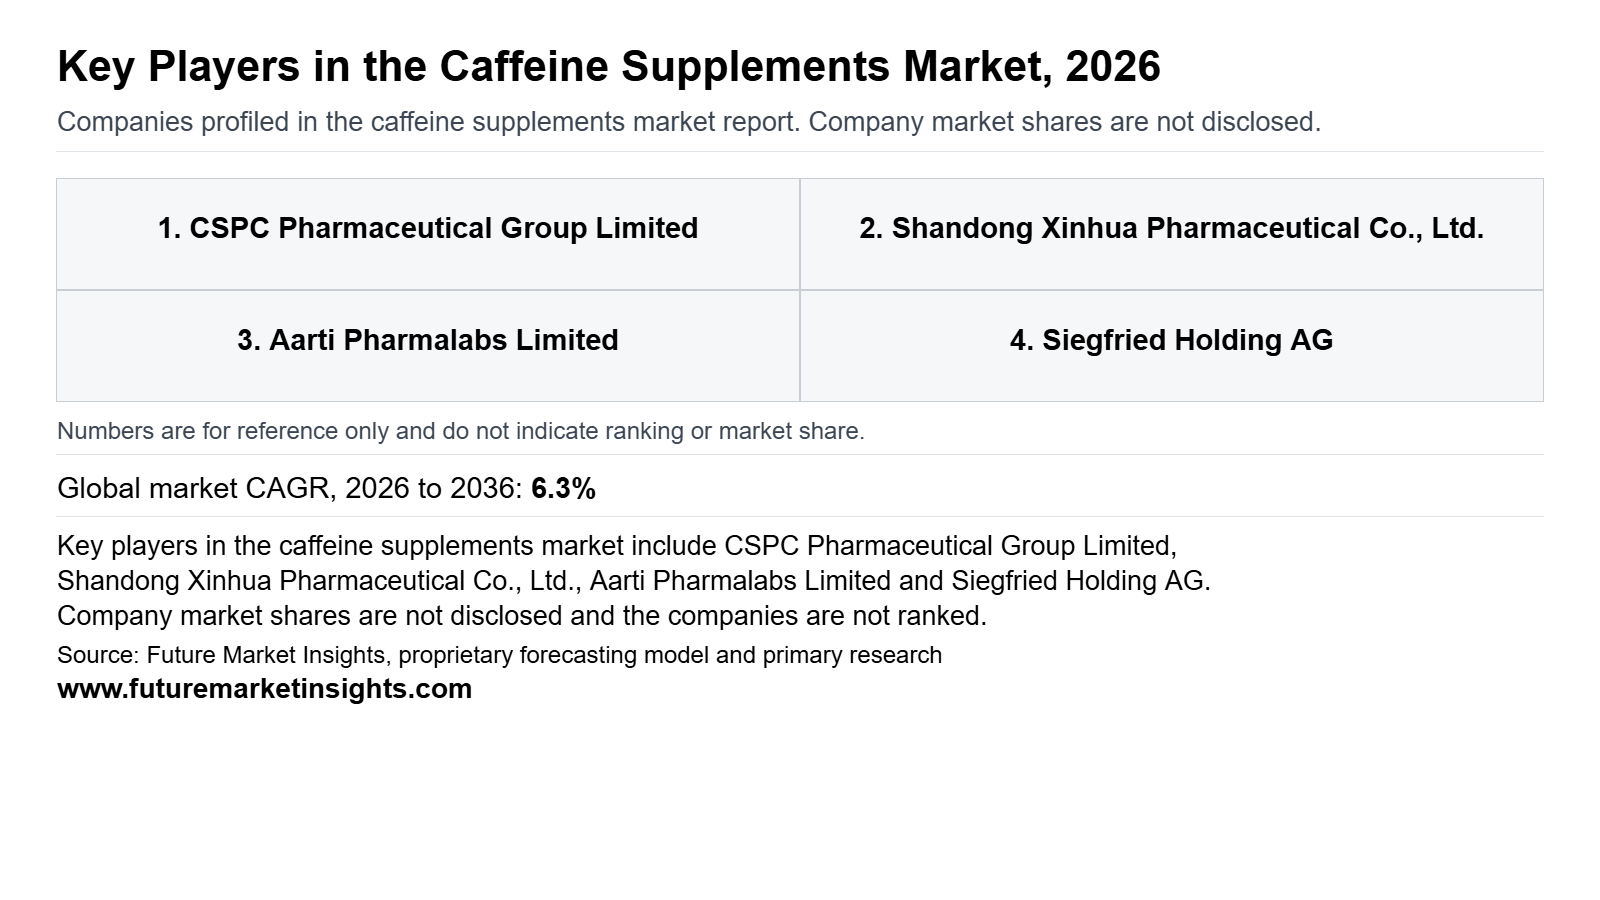
Market competition features upstream synthetic caffeine active pharmaceutical ingredient (API) manufacturers and downstream consumer sports-nutrition brand owners.
How Are Companies Positioned in the Caffeine Supplements Market?
Market participants divide between upstream chemical synthesis conglomerates in Asia and Europe providing compendial API grade caffeine and downstream consumer brands in North America packaging unit-dose capsules and shots.
What Matters When a Buyer Selects a Caffeine Supplements Supplier?
Commercial buyers prioritize lot-level USP/EP assay certificates, absence of microbiological contamination, tight heavy metal tolerances, and verified cGMP manufacturing compliance to prevent regulatory recalls.
Which Capabilities Distinguish Product Offers?
Leading manufacturers distinguish offerings through specialized particle sizing, microencapsulation for delayed release, fast-dissolving effervescent granulation, and clean-label natural coffee bean extraction.
How Does Geographic Reach Affect Competition?
Upstream API suppliers maintain export hubs across China and India, while finished-product marketers rely on omnichannel domestic distribution spanning specialty retail and pharmacy chains.
| Verified Company Evidence (2025 to 2026) | Commercial Effect | Buyer Action |
|---|---|---|
| April 2026: Shandong Xinhua Pharmaceutical expanded USP-grade synthetic caffeine output. | Formulators require high-volume cGMP API. | Lock in multi-quarter supply contracts. |
| May 2026: Aarti Pharmalabs Limited commissioned a dedicated caffeine derivative facility. | Supplement brands seek geographic supply diversification. | Qualify secondary cGMP caffeine suppliers. |
| March 2026: Siegfried Holding AG reinforced custom synthetic caffeine manufacturing. | Premium supplement labels require verified low-heavy-metal testing. | Audit third-party analytical records. |
Source: Verified corporate disclosures and Future Market Insights analysis, 2026.
| Company | Core Positioning | Verified Activity & Source Attribution |
|---|---|---|
| CSPC Pharmaceutical Group Limited | Upstream synthetic caffeine API producer | Expanded cGMP caffeine anhydrous production in Hebei, China (April 2026). |
| Shandong Xinhua Pharmaceutical Co., Ltd. | Global compendial caffeine supplier | Retained EU GMP and US FDA compliance across synthetic caffeine production (May 2026). |
| Aarti Pharmalabs Limited | Indian specialty active ingredient manufacturer | Commissioned export-grade caffeine production facility in Gujarat (June 2026). |
| Siegfried Holding AG | Swiss custom synthesis specialist | Upgraded active ingredient compliance dossiers for global wellness brands (March 2026). |
| Jilin Shulan Synthetic Pharmaceutical Co., Ltd. | Bulk pharmaceutical caffeine producer | Operates dedicated anhydrous caffeine synthesis lines for global food and supplement exporters (2026). |
| Optimum Nutrition (Glanbia plc) | Global consumer sports nutrition brand | Expanded distribution of pre-workout caffeine capsules and functional amino formulas (November 2025). |
| BulkSupplements.com | Pure bulk and unit-dose supplement supplier | Maintains third-party assay verification for 100 mg and 200 mg caffeine capsules (August 2026). |
| ProLab Nutrition | Classic bodybuilding alertness brand | Supplies standalone 200 mg caffeine tablets with calibrated scoring across North America (2026). |
| Nutricost | Value-oriented dietary supplement formulator | Offers cGMP-tested caffeine capsules paired with L-theanine for sustained focus (2026). |
| Kaged Muscle LLC | Premium clean-label sports nutrition brand | Formulates organic purCaf green-coffee caffeine capsules with third-party banned-substance testing (2026). |
Source: Verified corporate disclosures and Future Market Insights analysis, 2026.
Key takeaways
- Valued at USD 601.3 million in 2026, on course for USD 1,107.6 million by 2036.
- The decade adds USD 506.3 million in new value at a 6.3% CAGR.
- The end use segment is led by Men at 63.0% of 2026 revenue.
- 42.0% of application revenue goes to General Health and Wellness in 2026.
- Canada grows fastest at 6.9% CAGR, ahead of Mexico at 6.4%.
Caffeine Supplements Market Report Scope and Research Methodology
Scope parameters evaluate the global caffeine supplements market from 2026 to 2036 based on extensive supply chain analysis and primary market validation.
| Coverage Field | Report Scope |
|---|---|
| Market Definition | Revenue generated from commercial sales of dietary caffeine supplements, including capsules, tablets, liquid shots, and unit-dose formulations. |
| End Use Segments | Men and Women. |
| Application Segments | General Health and Wellness, Sports Nutrition, Cognitive Support, and Weight Management. |
| Form Segments | Liquid, Capsules/Tablets, Powder, and Gummies. |
| Distribution Channels | Online, Specialty Stores, Supermarkets/Hypermarkets, and Pharmacies. |
| Exclusions | Ready-to-drink brewed coffees, packaged energy drinks, carbonated soft drinks, prescription pharmaceuticals, and unextracted raw tea leaves. |
| Quantitative Units | USD Million for global and country-level market valuation. |
| Historical & Base Years | 2025 (Historical Base Year) and 2026 (Estimated Base Year). |
| Forecast Period | 2026 to 2036 (10-Year Assessment Window). |
| Regions Covered | North America, Latin America, Europe, East Asia, South Asia, Oceania, and Middle East & Africa. |
| Countries Profiled | Canada, Mexico, UK, Germany, France, Italy, and USA. |
| Companies Profiled | CSPC Pharmaceutical Group Limited, Shandong Xinhua Pharmaceutical Co., Ltd., Aarti Pharmalabs Limited, Siegfried Holding AG, and Jilin Shulan Synthetic Pharmaceutical Co., Ltd. |
| Research Approach | Triangulation of primary manufacturer and brand interviews with secondary corporate financial filings and regulatory surveillance audits. |
Source: Future Market Insights analysis of report scope and methodology parameters, 2026.
Research Sources and Bibliography
- Aarti Pharmalabs Limited. (2025, August 15). Caffeine Anhydrous USP/EP/IP Granules and Powder Technical Portfolio.
- Aarti Pharmalabs Limited. (2026, May 25). Q4 FY26 Investor Presentation: Xanthine Derivatives and CDMO Operations. https://www.aartipharmalabs.com/q4-fy-26/
- BulkSupplements.com. (2026, August 5). Caffeine Capsules 100 mg and 200 mg Third-Party Tested Dietary Supplement Specifications.
- COFEPRIS. (2025, July 25). Suplementos alimenticios: Clasificación regulatoria y presentaciones permitidas. https://www.gob.mx/cofepris/acciones-y-programas/suplementos-alimenticios-404003
- COFEPRIS. (2026, August 4). COFEPRIS, SSPC y SSC CDMX combaten publicidad irregular en redes sociales y plataformas de comercio electrónico.
- CSPC Pharmaceutical Group Limited. (2026, January 15). Indicative Results of CSPC Innovation Pharmaceutical Co., Ltd. for the Year Ended 31 December 2025. https://doc.irasia.com/listco/hk/cspc/announcement/a260115.pdf
- CSPC Pharmaceutical Group Limited. (2026, April 28). Annual Report 2025: Functional Ingredients and Caffeine Operations.
- Food Standards Agency. (2025, July 9). FSA publishes results of latest Retail Surveillance Survey and revised industry guidance on caffeine supplements. https://www.food.gov.uk/news-alerts/news/fsa-publishes-results-of-latest-retail-surveillance-survey-and-revised-industry-guidance-on-caffeine-supplements
- Food Standards Scotland. (2025, June 27). Business guidance for food supplements containing caffeine. https://www.foodstandards.gov.scot/business-guidance/running-a-food-business/publications/business-guidance-for-food-supplements-containing-caffeine
- French Ministry of the Economy. (2025, July 15). Compléments alimentaires : ce qu'il faut savoir sur la réglementation et la caféine. https://www.economie.gouv.fr/particuliers/mes-droits-conso/alimentation/complements-alimentaires-ce-quil-faut-savoir
- German Federal Institute for Risk Assessment. (2026, May 1). Coffee and energy drinks: Energizers with health risks?. https://www.bfr.bund.de/en/release/frequently-asked-questions-on-caffeine-and-foods-containing-caffeine-including-energy-drinks/
- German Federal Institute for Risk Assessment. (2026, July 7). Energy drinks and caffeine: Updated assessment of acute and chronic intake thresholds. https://www.bfr.bund.de/en/opinions/energy-drinks-the-bfr-updates-its-assessment-of-the-health-risks-to-children-and-adolescents-associated-with-acute-and-chronic-consumption/
- Glanbia plc. (2025, November 19). Capital Markets Day 2025 Transcript: Optimum Nutrition Pre-Workout and Energy Portfolio. https://www.glanbia.com/sites/glanbia-plc/files/glanbia/investors/capital-markets-day/2025/Glanbia-CMD-transcript-2025.pdf
- Health Canada. (2025, December 19). Natural Health Product: Caffeine Monograph. https://webprod.hc-sc.gc.ca/nhpid-bdipsn/dbImages/mono_caffeine_english.pdf
- Italian Ministry of Health. (2025, February 13). Utilizzo di integratori alimentari e simili in polvere da sniffare. https://www.salute.gov.it/new/it/news-e-media/notizie/utilizzo-di-integratori-alimentari-e-simili-polvere-da-sniffare/
- Kaged. (2026, June 8). Pre-Workout Elite: 388 mg Natural PurCaf Caffeine Informed-Sport Certified Specification. https://www.kaged.com/products/pre-workout-elite
- Nutricost. (2026, May 12). Nutricost Natural Caffeine Capsules 200 mg 250-Count GMP Compliance Specification. https://nutricost.com/products/nutricost-natural-caffeine-capsules-200mg-250-capsules
- PubMed. (2025, September 15). Neuromuscular adaptations to caffeine supplementation in low-load blood flow restriction training. https://pubmed.ncbi.nlm.nih.gov/40954555/
- PubMed. (2026, February 28). Caffeine Supplementation Increases Muscle Strength, but Not Endurance, While Both Caffeine and Its Expectation Elevate Blood Lactate: A Balanced-Placebo Design Study. https://pubmed.ncbi.nlm.nih.gov/41829971/
- PubMed. (2026, October 6). Effects of isolated and combined supplementation of caffeine and capsaicin on 10-km running performance. https://pubmed.ncbi.nlm.nih.gov/42836870/
- Shandong Xinhua Pharmaceutical Co., Ltd. (2026, April 28). 2025 Annual Report: Chemical Active Pharmaceutical Ingredients and Caffeine Series. https://www1.hkexnews.hk/listedco/listconews/sehk/2026/0428/2026042802009.pdf
- Siegfried Holding AG. (2026, March 15). Caffeine Anhydrous USP/EP Active Pharmaceutical Ingredient Portfolio. https://www.siegfried.ch/api-catalog/caffeine-anhydrous/
- Spectrum Chemical Mfg Corp. (2026, June 8). Scientific Documentation: Caffeine, Anhydrous, USP (Catalog C4036). https://www.spectrumchemical.com/productdocument/package/download/id/556541/
- UK Medicines and Healthcare products Regulatory Agency. (2025, May 20). UK API 41517: Registration of Active-Substance Manufacturer or Importer. https://cms.mhra.gov.uk/print/pdf/node/664741
- U.S. Food and Drug Administration. (2026, April 7). Warning Letter 722215: Federal Compliance for Dietary Supplement and Unapproved Stimulant Listings. https://www.fda.gov/inspections-compliance-enforcement-and-criminal-investigations/warning-letters/formpour-722215-03312026
Table of Content
- Key Takeaways
- Market Size and CAGR
- Top Growth Driver
- Fastest Growing Segment
- Leading Region
- Key Companies
- Emerging Opportunities
- Executive Summary
- Global Market Outlook
- Demand-side Trends
- Supply-side Trends
- Technology Roadmap Analysis
- Analysis and Recommendations
- Analyst Perspective (What is happening? Why now? What should investors know?)
- Key Questions Answered
- How large is the market?
- What is the CAGR?
- What are key trends?
- Which region dominates?
- Who are the leaders?
Read More...
- Market Overview
- Market Coverage / Taxonomy
- Market Definition / Scope / Limitations
- Research Methodology
- Chapter Orientation
- Analytical Lens and Working Hypotheses
- Market Structure, Signals, and Trend Drivers
- Benchmarking and Cross-market Comparability
- Market Sizing, Forecasting, and Opportunity Mapping
- Research Design and Evidence Framework
- Desk Research Programme (Secondary Evidence)
- Expert Input and Fieldwork (Primary Evidence)
- Tooling, Models, and Reference Databases
- Data Engineering and Model Build
- Quality Assurance and Audit Trail
- Market Background
- Market Dynamics (Drivers, Restraints, Opportunity, Trends)
- Scenario Forecast (Optimistic, Likely, Conservative)
- Impact Analysis
- AI Impact
- Sustainability Impact
- Regulatory Impact
- Technology Impact
- Consumer / Buyer Analysis
- Purchase Drivers
- Adoption Barriers
- Buyer Journey
- Opportunity Map Analysis
- Product Life Cycle Analysis
- Supply Chain Analysis
- Investment Feasibility Matrix
- Value Chain Analysis
- PESTLE and Porter's Analysis
- Regulatory Landscape
- Regional Parent Market Outlook
- Production and Consumption Statistics
- Import and Export Statistics
- Global Market Analysis and Forecast, 2021 to 2036
- Historical Market Size Value (USD Million) Analysis, 2021 to 2025
- Current and Future Market Size Value (USD Million) Projections, 2026 to 2036
- Y-o-Y Growth Trend Analysis
- Absolute $ Opportunity Analysis
- Global Market Pricing Analysis, 2021 to 2036
- Global Market Analysis and Forecast, By End Use, 2021 to 2036
- Introduction / Key Findings
- Historical Market Size Value (USD Million) Analysis By End Use, 2021 to 2025
- Current and Future Market Size Value (USD Million) Analysis and Forecast By End Use, 2026 to 2036
- Men
- Women
- Y-o-Y Growth Trend Analysis By End Use, 2021 to 2025
- Absolute $ Opportunity Analysis By End Use, 2026 to 2036
- Global Market Analysis and Forecast, By Application, 2021 to 2036
- Introduction / Key Findings
- Historical Market Size Value (USD Million) Analysis By Application, 2021 to 2025
- Current and Future Market Size Value (USD Million) Analysis and Forecast By Application, 2026 to 2036
- General Health and Wellness
- Sports Nutrition
- Cognitive Support
- Weight Management
- Y-o-Y Growth Trend Analysis By Application, 2021 to 2025
- Absolute $ Opportunity Analysis By Application, 2026 to 2036
- Global Market Analysis and Forecast, By Form, 2021 to 2036
- Introduction / Key Findings
- Historical Market Size Value (USD Million) Analysis By Form, 2021 to 2025
- Current and Future Market Size Value (USD Million) Analysis and Forecast By Form, 2026 to 2036
- Liquid
- Capsules/Tablets
- Powder
- Gummies
- Y-o-Y Growth Trend Analysis By Form, 2021 to 2025
- Absolute $ Opportunity Analysis By Form, 2026 to 2036
- Global Market Analysis and Forecast, By Distribution Channel, 2021 to 2036
- Introduction / Key Findings
- Historical Market Size Value (USD Million) Analysis By Distribution Channel, 2021 to 2025
- Current and Future Market Size Value (USD Million) Analysis and Forecast By Distribution Channel, 2026 to 2036
- Online
- Specialty Stores
- Supermarkets/Hypermarkets
- Pharmacies
- Y-o-Y Growth Trend Analysis By Distribution Channel, 2021 to 2025
- Absolute $ Opportunity Analysis By Distribution Channel, 2026 to 2036
- Global Market Analysis and Forecast, By Region, 2021 to 2036
- Introduction
- Historical Market Size Value (USD Million) Analysis By Region, 2021 to 2025
- Current Market Size Value (USD Million) Analysis and Forecast By Region, 2026 to 2036
- North America
- Western Europe
- East Asia
- South Asia and Pacific
- Market Attractiveness Analysis By Region
- North America Market Analysis and Forecast, By Country, 2021 to 2036
- Historical Market Size Value (USD Million) Trend Analysis By Market Taxonomy, 2021 to 2025
- Market Size Value (USD Million) Forecast By Market Taxonomy, 2026 to 2036
- By Country
- United States
- Canada
- By End Use
- By Application
- By Form
- By Distribution Channel
- By Country
- Market Attractiveness Analysis
- By Country
- By End Use
- By Application
- By Form
- By Distribution Channel
- Key Takeaways
- Western Europe Market Analysis and Forecast, By Country
- Historical Market Size Value (USD Million) Trend Analysis By Market Taxonomy, 2021 to 2025
- Market Size Value (USD Million) Forecast By Market Taxonomy, 2026 to 2036
- By Country
- United Kingdom
- Germany
- France
- By End Use
- By Application
- By Form
- By Distribution Channel
- By Country
- Market Attractiveness Analysis
- By Country
- By End Use
- By Application
- By Form
- By Distribution Channel
- Key Takeaways
- East Asia Market Analysis and Forecast, By Country
- Historical Market Size Value (USD Million) Trend Analysis By Market Taxonomy, 2021 to 2025
- Market Size Value (USD Million) Forecast By Market Taxonomy, 2026 to 2036
- By Country
- China
- Japan
- South Korea
- By End Use
- By Application
- By Form
- By Distribution Channel
- By Country
- Market Attractiveness Analysis
- By Country
- By End Use
- By Application
- By Form
- By Distribution Channel
- Key Takeaways
- South Asia and Pacific Market Analysis and Forecast, By Country
- Historical Market Size Value (USD Million) Trend Analysis By Market Taxonomy, 2021 to 2025
- Market Size Value (USD Million) Forecast By Market Taxonomy, 2026 to 2036
- By Country
- India
- Australia
- Rest of world aggregate
- By End Use
- By Application
- By Form
- By Distribution Channel
- By Country
- Market Attractiveness Analysis
- By Country
- By End Use
- By Application
- By Form
- By Distribution Channel
- Key Takeaways
- Key Countries Market Analysis
- United States
- Pricing Analysis
- Market Share Analysis, 2025
- By End Use
- By Application
- By Form
- By Distribution Channel
- Canada
- Pricing Analysis
- Market Share Analysis, 2025
- By End Use
- By Application
- By Form
- By Distribution Channel
- Germany
- Pricing Analysis
- Market Share Analysis, 2025
- By End Use
- By Application
- By Form
- By Distribution Channel
- United Kingdom
- Pricing Analysis
- Market Share Analysis, 2025
- By End Use
- By Application
- By Form
- By Distribution Channel
- France
- Pricing Analysis
- Market Share Analysis, 2025
- By End Use
- By Application
- By Form
- By Distribution Channel
- India
- Pricing Analysis
- Market Share Analysis, 2025
- By End Use
- By Application
- By Form
- By Distribution Channel
- China
- Pricing Analysis
- Market Share Analysis, 2025
- By End Use
- By Application
- By Form
- By Distribution Channel
- Japan
- Pricing Analysis
- Market Share Analysis, 2025
- By End Use
- By Application
- By Form
- By Distribution Channel
- South Korea
- Pricing Analysis
- Market Share Analysis, 2025
- By End Use
- By Application
- By Form
- By Distribution Channel
- Australia
- Pricing Analysis
- Market Share Analysis, 2025
- By End Use
- By Application
- By Form
- By Distribution Channel
- United States
- Market Structure Analysis
- Competition Dashboard
- Competition Benchmarking
- Market Share Analysis of Top Players
- By Regional
- By End Use
- By Application
- By Form
- By Distribution Channel
- Emerging Startups
- Innovation Benchmarking
- Competition Analysis
- Competition Deep Dive
- CSPC Pharmaceutical Group Limited
- Overview
- Product Portfolio
- Profitability by Market Segments
- Sales Footprint
- Strategy Overview
- Marketing Strategy
- Product Strategy
- Channel Strategy
- Shandong Xinhua Pharmaceutical Co., Ltd.
- Aarti Pharmalabs Limited
- Siegfried Holding AG
- Jilin Shulan Synthetic Pharmaceutical Co., Ltd.
- Optimum Nutrition (Glanbia plc)
- BulkSupplements.com
- ProLab Nutrition
- Nutricost
- Kaged Muscle LLC
- CSPC Pharmaceutical Group Limited
- Case Studies
- Success Stories
- Recent Developments
- Competition Deep Dive
- Assumptions & Acronyms Used
List of Tables
- Table 1: Global Market Value (USD Million) Forecast by Region, 2021 to 2036
- Table 2: Global Market Value (USD Million) Forecast by End Use, 2021 to 2036
- Table 3: Global Market Value (USD Million) Forecast by Application, 2021 to 2036
- Table 4: Global Market Value (USD Million) Forecast by Form, 2021 to 2036
- Table 5: Global Market Value (USD Million) Forecast by Distribution Channel, 2021 to 2036
- Table 6: North America Market Value (USD Million) Forecast by Country, 2021 to 2036
- Table 7: North America Market Value (USD Million) Forecast by End Use, 2021 to 2036
- Table 8: North America Market Value (USD Million) Forecast by Application, 2021 to 2036
- Table 9: North America Market Value (USD Million) Forecast by Form, 2021 to 2036
- Table 10: North America Market Value (USD Million) Forecast by Distribution Channel, 2021 to 2036
- Table 11: Western Europe Market Value (USD Million) Forecast by Country, 2021 to 2036
- Table 12: Western Europe Market Value (USD Million) Forecast by End Use, 2021 to 2036
- Table 13: Western Europe Market Value (USD Million) Forecast by Application, 2021 to 2036
- Table 14: Western Europe Market Value (USD Million) Forecast by Form, 2021 to 2036
- Table 15: Western Europe Market Value (USD Million) Forecast by Distribution Channel, 2021 to 2036
- Table 16: East Asia Market Value (USD Million) Forecast by Country, 2021 to 2036
- Table 17: East Asia Market Value (USD Million) Forecast by End Use, 2021 to 2036
- Table 18: East Asia Market Value (USD Million) Forecast by Application, 2021 to 2036
- Table 19: East Asia Market Value (USD Million) Forecast by Form, 2021 to 2036
- Table 20: East Asia Market Value (USD Million) Forecast by Distribution Channel, 2021 to 2036
- Table 21: South Asia and Pacific Market Value (USD Million) Forecast by Country, 2021 to 2036
- Table 22: South Asia and Pacific Market Value (USD Million) Forecast by End Use, 2021 to 2036
- Table 23: South Asia and Pacific Market Value (USD Million) Forecast by Application, 2021 to 2036
- Table 24: South Asia and Pacific Market Value (USD Million) Forecast by Form, 2021 to 2036
- Table 25: South Asia and Pacific Market Value (USD Million) Forecast by Distribution Channel, 2021 to 2036
List of Figures
- Figure 1: Global Market Pricing Analysis
- Figure 2: Global Market Value (USD Million) Forecast 2021-2036
- Figure 3: Global Market Value Share and BPS Analysis by End Use, 2026 and 2036
- Figure 4: Global Market Y-o-Y Growth Comparison by End Use, 2026-2036
- Figure 5: Global Market Attractiveness Analysis by End Use
- Figure 6: Global Market Value Share and BPS Analysis by Application, 2026 and 2036
- Figure 7: Global Market Y-o-Y Growth Comparison by Application, 2026-2036
- Figure 8: Global Market Attractiveness Analysis by Application
- Figure 9: Global Market Value Share and BPS Analysis by Form, 2026 and 2036
- Figure 10: Global Market Y-o-Y Growth Comparison by Form, 2026-2036
- Figure 11: Global Market Attractiveness Analysis by Form
- Figure 12: Global Market Value Share and BPS Analysis by Distribution Channel, 2026 and 2036
- Figure 13: Global Market Y-o-Y Growth Comparison by Distribution Channel, 2026-2036
- Figure 14: Global Market Attractiveness Analysis by Distribution Channel
- Figure 15: Global Market Value (USD Million) Share and BPS Analysis by Region, 2026 and 2036
- Figure 16: Global Market Y-o-Y Growth Comparison by Region, 2026-2036
- Figure 17: Global Market Attractiveness Analysis by Region
- Figure 18: North America Market Incremental Dollar Opportunity, 2026-2036
- Figure 19: Western Europe Market Incremental Dollar Opportunity, 2026-2036
- Figure 20: East Asia Market Incremental Dollar Opportunity, 2026-2036
- Figure 21: South Asia and Pacific Market Incremental Dollar Opportunity, 2026-2036
- Figure 22: North America Market Value Share and BPS Analysis by Country, 2026 and 2036
- Figure 23: North America Market Value Share and BPS Analysis by End Use, 2026 and 2036
- Figure 24: North America Market Y-o-Y Growth Comparison by End Use, 2026-2036
- Figure 25: North America Market Attractiveness Analysis by End Use
- Figure 26: North America Market Value Share and BPS Analysis by Application, 2026 and 2036
- Figure 27: North America Market Y-o-Y Growth Comparison by Application, 2026-2036
- Figure 28: North America Market Attractiveness Analysis by Application
- Figure 29: North America Market Value Share and BPS Analysis by Form, 2026 and 2036
- Figure 30: North America Market Y-o-Y Growth Comparison by Form, 2026-2036
- Figure 31: North America Market Attractiveness Analysis by Form
- Figure 32: North America Market Value Share and BPS Analysis by Distribution Channel, 2026 and 2036
- Figure 33: North America Market Y-o-Y Growth Comparison by Distribution Channel, 2026-2036
- Figure 34: North America Market Attractiveness Analysis by Distribution Channel
- Figure 35: Western Europe Market Value Share and BPS Analysis by Country, 2026 and 2036
- Figure 36: Western Europe Market Value Share and BPS Analysis by End Use, 2026 and 2036
- Figure 37: Western Europe Market Y-o-Y Growth Comparison by End Use, 2026-2036
- Figure 38: Western Europe Market Attractiveness Analysis by End Use
- Figure 39: Western Europe Market Value Share and BPS Analysis by Application, 2026 and 2036
- Figure 40: Western Europe Market Y-o-Y Growth Comparison by Application, 2026-2036
- Figure 41: Western Europe Market Attractiveness Analysis by Application
- Figure 42: Western Europe Market Value Share and BPS Analysis by Form, 2026 and 2036
- Figure 43: Western Europe Market Y-o-Y Growth Comparison by Form, 2026-2036
- Figure 44: Western Europe Market Attractiveness Analysis by Form
- Figure 45: Western Europe Market Value Share and BPS Analysis by Distribution Channel, 2026 and 2036
- Figure 46: Western Europe Market Y-o-Y Growth Comparison by Distribution Channel, 2026-2036
- Figure 47: Western Europe Market Attractiveness Analysis by Distribution Channel
- Figure 48: East Asia Market Value Share and BPS Analysis by Country, 2026 and 2036
- Figure 49: East Asia Market Value Share and BPS Analysis by End Use, 2026 and 2036
- Figure 50: East Asia Market Y-o-Y Growth Comparison by End Use, 2026-2036
- Figure 51: East Asia Market Attractiveness Analysis by End Use
- Figure 52: East Asia Market Value Share and BPS Analysis by Application, 2026 and 2036
- Figure 53: East Asia Market Y-o-Y Growth Comparison by Application, 2026-2036
- Figure 54: East Asia Market Attractiveness Analysis by Application
- Figure 55: East Asia Market Value Share and BPS Analysis by Form, 2026 and 2036
- Figure 56: East Asia Market Y-o-Y Growth Comparison by Form, 2026-2036
- Figure 57: East Asia Market Attractiveness Analysis by Form
- Figure 58: East Asia Market Value Share and BPS Analysis by Distribution Channel, 2026 and 2036
- Figure 59: East Asia Market Y-o-Y Growth Comparison by Distribution Channel, 2026-2036
- Figure 60: East Asia Market Attractiveness Analysis by Distribution Channel
- Figure 61: South Asia and Pacific Market Value Share and BPS Analysis by Country, 2026 and 2036
- Figure 62: South Asia and Pacific Market Value Share and BPS Analysis by End Use, 2026 and 2036
- Figure 63: South Asia and Pacific Market Y-o-Y Growth Comparison by End Use, 2026-2036
- Figure 64: South Asia and Pacific Market Attractiveness Analysis by End Use
- Figure 65: South Asia and Pacific Market Value Share and BPS Analysis by Application, 2026 and 2036
- Figure 66: South Asia and Pacific Market Y-o-Y Growth Comparison by Application, 2026-2036
- Figure 67: South Asia and Pacific Market Attractiveness Analysis by Application
- Figure 68: South Asia and Pacific Market Value Share and BPS Analysis by Form, 2026 and 2036
- Figure 69: South Asia and Pacific Market Y-o-Y Growth Comparison by Form, 2026-2036
- Figure 70: South Asia and Pacific Market Attractiveness Analysis by Form
- Figure 71: South Asia and Pacific Market Value Share and BPS Analysis by Distribution Channel, 2026 and 2036
- Figure 72: South Asia and Pacific Market Y-o-Y Growth Comparison by Distribution Channel, 2026-2036
- Figure 73: South Asia and Pacific Market Attractiveness Analysis by Distribution Channel
- Figure 74: Global Market - Tier Structure Analysis
- Figure 75: Global Market - Company Share Analysis
Frequently Asked Questions
How big is the caffeine supplements market in 2026, and what is forecast for 2036?
Global caffeine supplements market valuation stands at USD 601.3 million in 2026, up from USD 565.7 million in 2025, and is projected to reach USD 1,107.6 million by 2036. Figure measures standalone oral caffeine supplement revenue and excludes coffee and ready-to-drink energy beverages.
What CAGR is forecast for the caffeine supplements market from 2026 to 2036?
Future Market Insights projects the global caffeine supplements market to expand at a 6.3% CAGR between 2026 and 2036. Growth is anchored by consumer adoption of premeasured liquid shots and capsules powders.
Which End Use segment leads the caffeine supplements market?
Men segment is expected to hold 63.0% of the caffeine supplements market by End Use in 2026, driven by higher participation in structured strength training and routine pre-exercise ergogenic dosing.
Which Application segment leads caffeine supplements demand?
General Health and Wellness segment accounts for 42.0% of caffeine supplements Application demand in 2026, helped by daily workplace focus and shift-work wakefulness occasions outside competitive athletics.
Which Form and Distribution Channel segments lead the caffeine supplements market?
Liquid segment leads Form at 42.0% in 2026 due to rapid unit-dose convenience, while the Online segment leads Distribution Channel at 63.0% on account of direct-to-consumer subscription fulfillment.
Which profiled countries record the highest caffeine supplements growth rates?
Canada leads the profiled country growth rates at a 6.9% CAGR from 2026 to 2036, followed by Mexico at 6.4% and the UK and Germany.3% each.
Which companies are profiled in the caffeine supplements market?
Key players in the caffeine supplements market include CSPC Pharmaceutical Group Limited, Shandong Xinhua Pharmaceutical Co., Ltd., Aarti Pharmalabs Limited, Siegfried Holding AG, Spectrum Laboratory Products, Inc., Glanbia plc, Kaged, BulkSupplements.com and Nutricost Group.
What regulatory hurdles restrain caffeine supplement commercialization?
Finished-batch potency-to-label deviations, national daily caffeine caps such as France's 200 mg limit, and regulatory warnings against unmeasured bulk caffeine powders represent the primary commercialization hurdles through 2036.
Preview the report firsthand - request a free sample
Get SampleGet the brochure for pricing and purchase details.
Get PDF
