

- Market Size (2026)
- USD 349.4 Mn
- Forecast (2036)
- USD 507.3 Mn
- CAGR (2026 to 2036)
- 3.8%
Cardiovascular Enterprise Viewer Market Size, Market Forecast and Outlook By FMI
Summary of the Cardiovascular Enterprise Viewer Market
- Demand and Growth Drivers
- Cardiovascular imaging volume growth from aging populations and cardiovascular disease prevalence is driving demand for enterprise viewing platforms that consolidate multi-modality cardiac imaging data into unified diagnostic workflows.
- Clinical workflow efficiency pressure is accelerating adoption of integrated cardiovascular viewers that eliminate the need to access separate PACS, hemodynamic, and echo systems for comprehensive cardiac patient assessment.
- AI integration with cardiovascular imaging is creating demand for viewer platforms capable of hosting and displaying AI-generated measurements, risk scores, and diagnostic suggestions alongside source imaging data.
- Product and Segment View
- Diagnostic and Monitoring Devices hold 65.0% of the device segment in 2026, reflecting the primary role of enterprise viewers in consolidating cardiac diagnostic data from echocardiography, cardiac CT, cardiac MRI, and cardiac catheterization into unified patient views.
- Coronary Artery Diseases account for 48.0% of the application segment, driven by the high volume of imaging studies performed for coronary artery disease diagnosis, intervention planning, and post-procedural assessment.
- Hospitals remain the primary end user as cardiovascular enterprise viewers require integration with hospital PACS, EMR, and hemodynamic systems.
- Geography and Competitive Outlook
- The USA is expected to register a CAGR of 4.0% through 2036, supported by high cardiovascular imaging volumes, advanced hospital IT infrastructure, and clinical workflow optimization investment.
- South Korea at 3.9% reflects advanced hospital information system adoption and growing cardiovascular care infrastructure.
- Philips Healthcare leads through its IntelliSpace Cardiovascular platform providing integrated multi-modality cardiac imaging visualization and reporting.
- Analyst Opinion
- 'Cardiovascular enterprise viewers are evolving from image display tools to clinical intelligence platforms. Organizations that can integrate AI analytics, structured reporting, and population health insights into unified cardiovascular viewing environments are positioned to define the next generation of cardiac imaging workflow,' says Sudip Saha, Managing Director at FMI.
- The market is shifting from departmental imaging systems toward enterprise platforms that provide cardiologists with comprehensive patient cardiovascular data regardless of imaging modality or acquisition location.
- Adoption is increasing as hospitals recognize that fragmented cardiovascular data across separate echo, cath, CT, and MRI systems creates diagnostic inefficiency and patient safety risk.
- Demand is further shaped by value-based care models that require longitudinal cardiovascular patient data tracking and outcomes measurement across episodes of care.
Key Takeaways, Market Size, and Forecast
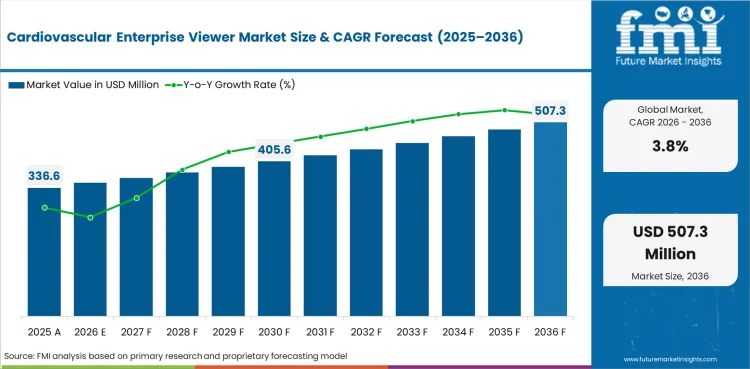
- The cardiovascular enterprise viewer market was valued at USD 336.6 million in 2025.
- The market is projected to reach USD 349.4 million in 2026 and USD 507.3 million by 2036, growing at a CAGR of 3.8%.
- By 2036, the cardiovascular enterprise viewer market is expected to be worth USD 507.3 million.
- From 2026 to 2036, the market is projected to expand at a CAGR of 3.8%.
- The market is projected to create an incremental opportunity of USD 157.93 million between 2026 and 2036.
- In 2026, Diagnostic and Monitoring Devices are expected to account for 65.0% of the device segment, driven by increasing adoption of integrated cardiac imaging viewers that consolidate echocardiography, angiography, CT, and MRI data into unified diagnostic platforms.
- Coronary Artery Diseases are expected to lead the application segment with a 48.0% share.
- USA (4.0%) and South Korea (3.9%) are two of the fastest growing markets in the world.
Cardiovascular Enterprise Viewer Market Definition
The Cardiovascular Enterprise Viewer Market covers software platforms and integrated systems that provide unified visualization, analysis, and reporting of multi-modality cardiovascular imaging and diagnostic data. Products include enterprise cardiovascular PACS viewers, hemodynamic data integration platforms, AI-enhanced cardiac analysis tools, and structured cardiovascular reporting systems.
Cardiovascular Enterprise Viewer Market Inclusions
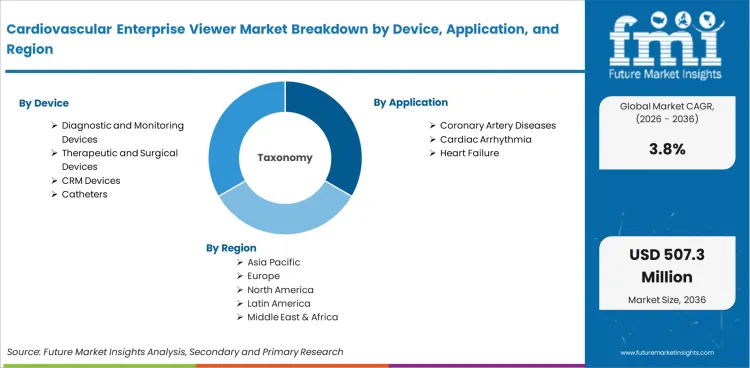
Market scope includes products classified by device (diagnostic and monitoring devices, therapeutic and surgical devices, CRM devices, catheters), application (coronary artery diseases, cardiac arrhythmia, heart failure), end user (hospitals, specialty clinics), and deployment (cloud based, on premise, hybrid). Revenue coverage spans 2026 to 2036.
Cardiovascular Enterprise Viewer Market Exclusions
The scope does not include general radiology PACS systems without cardiovascular specialization, standalone cardiac ultrasound machines, cardiac catheterization laboratory equipment, or cardiac rhythm management implantable devices.
Cardiovascular Enterprise Viewer Market Research Methodology
- Primary Research: FMI analysts conducted interviews with industry participants, technology providers, and end users across key markets.
- Desk Research: Combined data from industry associations, regulatory filings, and manufacturer disclosures.
- Market Sizing and Forecasting: Bottom up aggregation across segments and regions with top down validation against industry benchmarks.
- Data Validation: Cross checked quarterly against industry production data, procurement records, and manufacturer disclosures.
Why is the Cardiovascular Enterprise Viewer Market Growing?
- Multi-modality cardiovascular imaging growth creates complexity that enterprise viewers address by consolidating echo, CT, MRI, catheterization, and electrophysiology data into unified patient-centric diagnostic platforms.
- Value-based care requirements for longitudinal patient outcome tracking are driving hospital investment in enterprise cardiovascular data platforms that support quality measurement, reporting, and clinical research.
Demand for cardiovascular enterprise viewers reflects the growing complexity of cardiac diagnostic data and the clinical need for unified visualization across imaging modalities. Modern cardiovascular diagnosis relies on echocardiography, cardiac CT, cardiac MRI, coronary angiography, and electrophysiology studies that are typically stored in separate departmental systems. Enterprise viewers consolidate this data into a single patient view that enables cardiologists to assess comprehensive cardiovascular status without switching between multiple display systems.
The clinical efficiency value proposition is strengthening as cardiovascular imaging volumes grow and the number of imaging modalities per patient increases. Heart failure patients may undergo serial echocardiograms, cardiac MRI, nuclear perfusion studies, and hemodynamic assessments that must be compared longitudinally. Enterprise viewers that provide temporal trend display, automated measurement comparison, and structured reporting reduce the time required for comprehensive cardiac assessment.
Cloud-based deployment is gaining adoption as hospitals seek to reduce on-premise IT infrastructure while enabling remote access for cardiologists and cardiovascular surgeons who need imaging data at multiple locations. Cloud cardiovascular viewers provide access from any connected device, support telehealth cardiovascular consultation, and enable multi-site health system data sharing.
Market Segmentation Analysis
- Diagnostic and Monitoring Devices hold 65.0% of the device segment, reflecting the enterprise viewer's primary role in consolidating cardiac diagnostic imaging and hemodynamic monitoring data.
- Coronary Artery Diseases account for 48.0% of application, driven by high imaging volumes for coronary diagnosis, intervention planning, and surveillance.
The Cardiovascular Enterprise Viewer Market is segmented by device, application, end user, and deployment. Diagnostic and Monitoring Devices dominate device demand. Coronary Artery Diseases lead application through high imaging volumes.
Insights into the Diagnostic and Monitoring Devices Segment
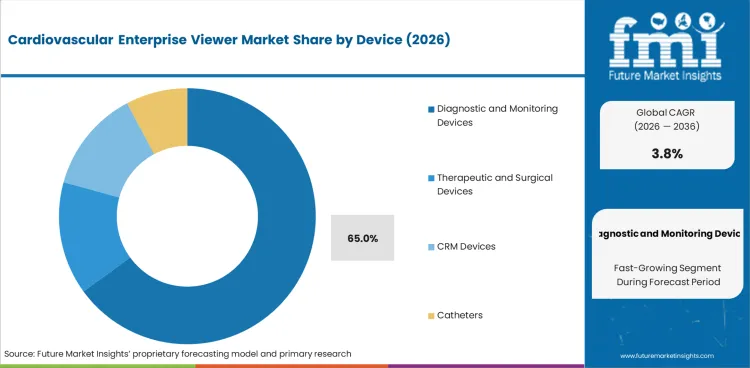
In 2026, Diagnostic and Monitoring Devices are expected to represent 65.0% of the device segment. This category covers enterprise viewer functionality for cardiac echocardiography display, cardiac CT and MRI visualization, coronary angiography review, and hemodynamic monitoring data integration.
Growth reflects the expanding scope of cardiovascular imaging modalities that enterprise viewers must consolidate, with AI-enhanced measurement tools adding new data layers requiring visualization and clinical integration.
Insights into the Coronary Artery Diseases Application Segment
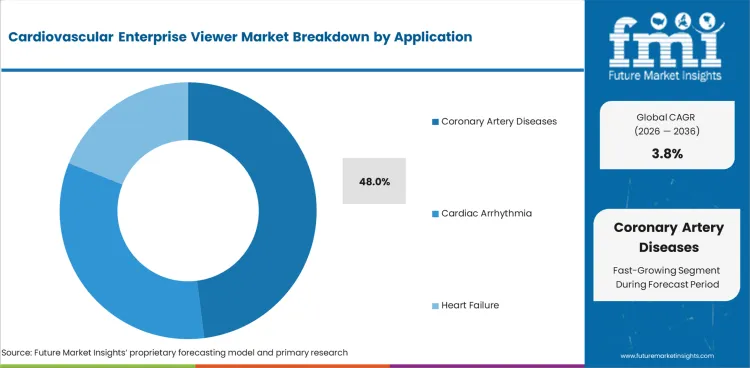
Coronary Artery Diseases account for 48.0% of the application segment in 2026. This covers enterprise viewer use for coronary CT angiography review, invasive coronary angiography visualization, FFR/iFR hemodynamic data display, and pre and post intervention imaging comparison.
Growth reflects the high volume of imaging studies performed for coronary artery disease across screening, diagnostic, interventional planning, and long term surveillance applications.
Cardiovascular Enterprise Viewer Market Drivers, Restraints, and Opportunities
- Multi-modality cardiac imaging growth and clinical efficiency requirements sustain demand for enterprise cardiovascular viewers.
- Hospital IT integration complexity and legacy system interoperability challenges slow deployment timelines.
- AI integration and value-based care requirements create new value propositions for enterprise cardiovascular data platforms.
The market is shaped by imaging volume growth, clinical workflow efficiency requirements, and technology advancement. Growth is supported by multi-modality integration demand, while IT complexity creates deployment challenges.
Multi-Modality Imaging Integration
Demand is shaped by the growing number of cardiovascular imaging modalities per patient that creates clinical need for unified viewing platforms. Enterprise viewers that consolidate echo, CT, MRI, cath, and EP data reduce diagnostic time and improve clinical assessment quality.
IT Integration Complexity
Growth is moderated by the technical complexity of integrating cardiovascular enterprise viewers with existing hospital PACS, EMR, hemodynamic systems, and departmental workflows that were designed as standalone systems.
AI and Value-Based Care Drivers
Adoption benefits from AI integration that automates cardiac measurements, calculates risk scores, and provides diagnostic suggestions within the enterprise viewer, and from value-based care programs that require longitudinal cardiovascular outcome tracking.
Analysis of Cardiovascular Enterprise Viewer Market By Key Countries
.webp "Top Country Growth Comparison Cardiovascular Enterprise Viewer Market Cagr (2026 2036)")
| Country | CAGR |
|---|---|
| USA | 4% |
| South Korea | 3.9% |
| Japan | 3.8% |
| UK | 3.7% |
| European Union | 3.6% |
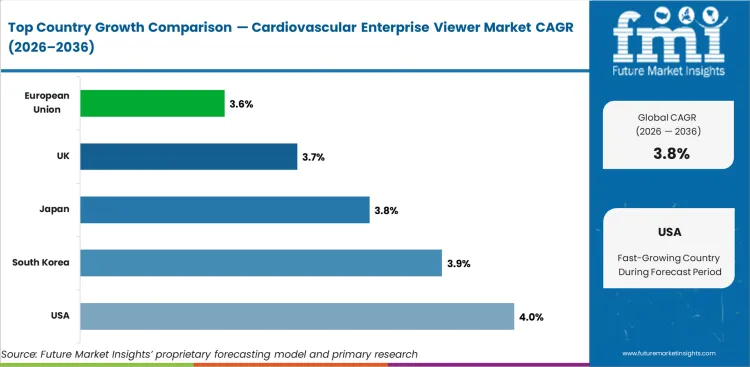
- The USA leads with 4.0% through 2036, supported by high cardiovascular imaging volumes, advanced hospital IT, and clinical workflow investment.
- South Korea at 3.9% reflects advanced hospital system adoption and cardiovascular care expansion.
- Japan (3.8%) and UK (3.7%) show steady growth driven by aging population cardiac imaging demand and hospital IT modernization.
The global Cardiovascular Enterprise Viewer Market is projected to grow at a CAGR of 3.8% from 2026 to 2036. The analysis covers more than 30 countries.
Demand Outlook for Cardiovascular Enterprise Viewer Market in the United States
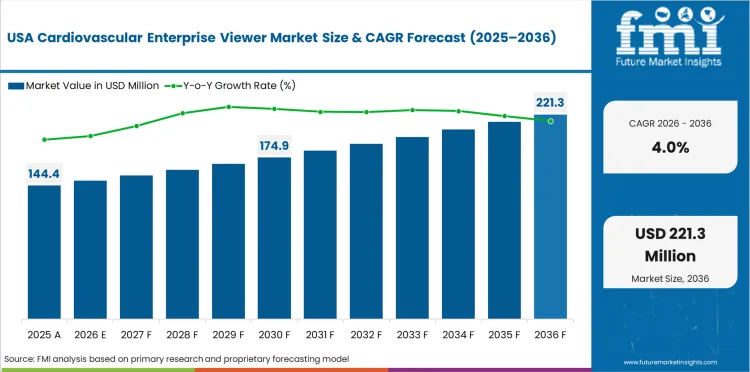
The USA is expected to grow at 4.0% through 2036, reflecting high cardiovascular imaging procedure volumes, advanced hospital IT infrastructure, and growing investment in clinical workflow optimization and AI integration.
- High cardiovascular imaging volumes create demand for multi-modality data consolidation.
- Advanced hospital IT supports enterprise viewer deployment and integration.
- AI integration investment drives platform upgrades and new procurement.
Future Outlook for Cardiovascular Enterprise Viewer Market in South Korea
South Korea at 3.9% through 2036, reflecting advanced hospital information system adoption, growing cardiovascular disease burden, and technology leadership in healthcare IT implementation.
- Advanced hospital IT adoption supports rapid enterprise viewer deployment.
- Growing cardiovascular disease burden increases imaging volumes and data complexity.
- Healthcare IT leadership enables early adoption of AI-integrated cardiovascular platforms.
Opportunity Analysis of Cardiovascular Enterprise Viewer Market in Japan
Japan at 3.8% through 2036, reflecting aging population cardiovascular imaging demand, advanced medical imaging infrastructure, and hospital IT modernization investment.
- Aging population creates growing cardiovascular imaging volumes requiring enterprise data management.
- Advanced imaging infrastructure supports multi-modality data generation requiring viewer consolidation.
- Hospital IT modernization drives enterprise viewer procurement and integration.
In-depth Analysis of Cardiovascular Enterprise Viewer Market in the United Kingdom
The UK at 3.7% through 2036, supported by NHS digital transformation, growing cardiac imaging demand, and cardiovascular network integration requirements.
- NHS digital transformation supports enterprise cardiovascular IT investment.
- Growing cardiac imaging demand drives data consolidation platform procurement.
- Regional cardiovascular network integration creates multi-site viewer deployment requirements.
Sales Analysis of Cardiovascular Enterprise Viewer Market in the European Union
The EU at 3.6% through 2036, driven by hospital IT standardization, aging population cardiac imaging growth, and cross-border health data sharing initiatives.
- Hospital IT standardization drives enterprise viewer adoption across EU member state health systems.
- Aging population increases cardiovascular imaging volumes and diagnostic data complexity.
- Cross-border health data sharing initiatives support cloud-based enterprise viewer deployment.
Competitive Landscape and Strategic Positioning
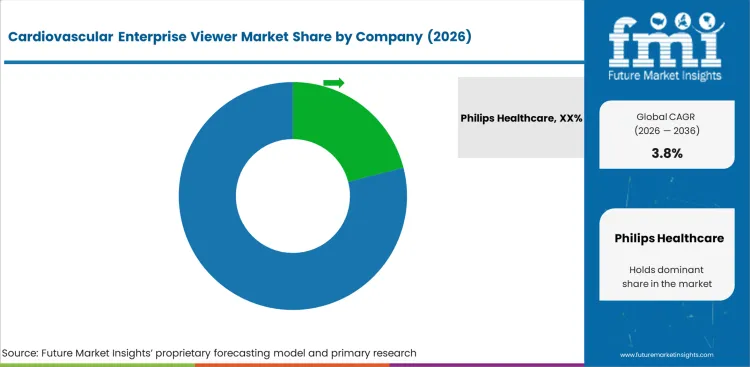
- Philips Healthcare leads through its IntelliSpace Cardiovascular platform providing integrated multi-modality cardiac imaging visualization, structured reporting, and clinical analytics.
- Siemens Healthineers and GE HealthCare maintain positions through cardiovascular imaging and IT platforms with enterprise viewer capabilities integrated into broader healthcare IT ecosystems.
- Emerging players target AI-enhanced cardiovascular analytics, cloud-native viewing platforms, and specialized structural heart imaging solutions.
Philips Healthcare maintains a leading position through its IntelliSpace Cardiovascular enterprise platform that integrates echocardiography, cardiac catheterization, cardiac CT and MRI visualization, hemodynamic data, and structured reporting into a unified cardiovascular workflow. Siemens Healthineers provides cardiovascular imaging and viewer solutions within its syngo platform ecosystem.
GE HealthCare delivers cardiovascular imaging visualization and analytics through its clinical applications portfolio. Fujifilm Healthcare provides enterprise imaging platforms with cardiovascular specialization. Canon Medical Systems offers cardiac imaging visualization within its Vitrea advanced visualization platform.
Barriers to entry include the technical complexity of multi-modality cardiovascular data integration, hospital IT purchasing cycle timelines, established vendor relationships, and the clinical validation requirements for cardiovascular measurement and reporting tools. Strategic priorities include expanding AI analytics integration, building cloud-native deployment capabilities, and developing structured reporting tools aligned with cardiovascular quality registries.
Key Companies in the Cardiovascular Enterprise Viewer Market
Key global companies leading the cardiovascular enterprise viewer market include:
- Philips Healthcare, Siemens Healthineers, GE HealthCare maintain leadership through established market presence, broad capabilities, and global infrastructure.
- Fujifilm Healthcare, Canon Medical Systems Corporation have established strong positions through specialized capabilities and focused expertise.
- Cerner Corporation, McKesson Corporation, Change Healthcare, Lumedx are among the emerging players gaining traction through technology advancement and focused innovation.
Competitive Benchmarking: Cardiovascular Enterprise Viewer Market
| Company | CV Platform Depth | AI Integration | Hospital IT Integration | Geographic Coverage |
|---|---|---|---|---|
| Philips Healthcare | High | High | Strong | Global |
| Siemens Healthineers | High | High | Strong | Global |
| GE HealthCare | High | Medium | Strong | Global |
| Fujifilm Healthcare | Medium | Medium | Moderate | Asia, Global |
| Canon Medical Systems | Medium | Medium | Moderate | Asia, Global |
| Cerner Corporation | Low | Medium | Strong | N. America |
| McKesson Corporation | Low | Low | Moderate | N. America |
Source: Future Market Insights competitive analysis, 2026.
Key Players in the Cardiovascular Enterprise Viewer Market
Major Global Players
- Philips Healthcare
- Siemens Healthineers
- GE HealthCare
- Fujifilm Healthcare
- Canon Medical Systems Corporation
Emerging Players/Startups
- Cerner Corporation
- McKesson Corporation
- Change Healthcare
- Lumedx
- Merge Healthcare
Report Scope and Coverage
| Metric | Value |
|---|---|
| Quantitative Units | USD 349.39 million to USD 507.32 million, at a CAGR of 3.8% |
| Market Definition | The market covers software platforms providing unified visualization, analysis, and reporting of multi-modality cardiovascular imaging and diagnostic data. |
| Regions Covered | North America, Latin America, Europe, East Asia, South Asia and Pacific, Middle East and Africa |
| Countries Covered | USA, UK, Germany, South Korea, Japan, China, India, France, 30 plus countries |
| Key Companies Profiled | Philips Healthcare, Siemens Healthineers, GE HealthCare, Fujifilm Healthcare, Canon Medical Systems, Cerner Corporation, McKesson Corporation, Change Healthcare, Lumedx, Merge Healthcare |
| Forecast Period | 2026 to 2036 |
| Approach | Hybrid bottom up and top down methodology starting with verified transaction data, projecting adoption velocity across segments and regions. |
Segmentation
Cardiovascular Enterprise Viewer Market Segmented by Device:
- Diagnostic and Monitoring Devices
- Therapeutic and Surgical Devices
- CRM Devices
- Catheters
Cardiovascular Enterprise Viewer Market Segmented by Application:
- Coronary Artery Diseases
- Cardiac Arrhythmia
- Heart Failure
Cardiovascular Enterprise Viewer Market Segmented by End User:
- Hospitals
- Specialty Clinics
Cardiovascular Enterprise Viewer Market Segmented by Deployment:
- Cloud Based Deployment
- On Premise Deployment
- Hybrid Deployment
Cardiovascular Enterprise Viewer Market by Region:
- North America
- USA
- Canada
- Mexico
- Latin America
- Brazil
- Chile
- Rest of Latin America
- Western Europe
- Germany
- UK
- Italy
- Spain
- France
- Nordic
- BENELUX
- Rest of Western Europe
- Eastern Europe
- Russia
- Poland
- Hungary
- Balkan & Baltic
- Rest of Eastern Europe
- East Asia
- China
- Japan
- South Korea
- South Asia and Pacific
- India
- ASEAN
- Australia & New Zealand
- Rest of South Asia and Pacific
- Middle East & Africa
- Kingdom of Saudi Arabia
- Other GCC Countries
- Turkiye
- South Africa
- Other African Union
- Rest of Middle East & Africa
Research Sources and Bibliography
- 1. American College of Cardiology. (2025). ACC Cardiovascular Imaging Quality Standards. ACC.
- 2. European Society of Cardiology. (2025). ESC Cardiovascular Imaging Guidelines. ESC.
- 3. Healthcare Information and Management Systems Society. (2025). HIMSS Cardiovascular Information Systems Standards. HIMSS.
- 4. Integrating the Healthcare Enterprise. (2025). IHE Cardiology Domain Technical Framework. IHE.
- 5. USA Food and Drug Administration. (2025). FDA Medical Device Software Guidance for Cardiovascular Applications. FDA.
This bibliography is provided for reader reference. The full Future Market Insights report contains the complete reference list with publication dates, URLs, and supporting data for all cited works.
This Report Answers
- Estimating market size and revenue projections from 2026 to 2036.
- Segmentation by device, application, end user, and deployment.
- Regional insights covering more than 30 markets.
- Analysis of enterprise cardiovascular viewer technology and AI integration.
- Competitive landscape assessment.
- Growth opportunities in AI analytics, cloud deployment, and structured reporting.
- Supply chain and healthcare IT evaluation.
- Data delivery in PDF and Excel formats.
Frequently Asked Questions
What is the global market demand for Cardiovascular Enterprise Viewers in 2026?
In 2026, the global Cardiovascular Enterprise Viewer Market is expected to be worth USD 349.39 million, reflecting growing demand for multi-modality cardiac imaging consolidation platforms that improve diagnostic workflow efficiency and enable comprehensive cardiovascular patient assessment.
How big will the market be in 2036?
By 2036, the market is expected to reach USD 507.32 million, supported by aging population cardiovascular imaging growth, AI analytics integration creating platform upgrade demand, cloud deployment expansion, and value-based care requirements for longitudinal cardiac outcome tracking.
How much is demand expected to grow?
Between 2026 and 2036, demand is expected to grow at a CAGR of 3.8%, driven by multi-modality imaging volume growth, clinical workflow efficiency requirements, AI-enhanced cardiovascular analytics integration, and hospital IT modernization programs.
Which device segment leads?
Diagnostic and Monitoring Devices hold 65.0% of the device segment in 2026, reflecting the primary use of enterprise viewers for consolidating cardiac echo, CT, MRI, catheterization, and hemodynamic diagnostic data into unified clinical assessment platforms.
What drives demand in the USA?
The USA at 4.0% reflects high cardiovascular imaging procedure volumes creating data management complexity, advanced hospital IT infrastructure supporting enterprise deployment, and growing AI integration investment in cardiovascular clinical platforms.
What drives demand in South Korea?
South Korea at 3.9% reflects advanced hospital information system adoption enabling rapid enterprise viewer deployment, growing cardiovascular disease burden increasing imaging volumes, and healthcare IT leadership supporting AI-integrated platform adoption.
What is the definition?
The market covers software platforms and integrated systems providing unified visualization, analysis, and reporting of multi-modality cardiovascular imaging data including echocardiography, cardiac CT, MRI, angiography, hemodynamic monitoring, and electrophysiology data within hospital enterprise IT environments.
How is the forecast validated?
Forecasting models use a hybrid bottom up and top down approach, starting with verified hospital IT procurement data, cardiovascular procedure volume statistics, and enterprise software deployment data, validating against healthcare IT spending reports and manufacturer disclosures.
Preview the report firsthand - request a free sample
Get SampleGet the brochure for pricing and purchase details.
Get PDFTable of Content
- Executive Summary
- Global Market Outlook
- Demand-side Trends
- Supply-side Trends
- Technology Roadmap Analysis
- Analysis and Recommendations
- Market Overview
- Market Coverage / Taxonomy
- Market Definition / Scope / Limitations
- Research Methodology
- Chapter Orientation
- Analytical Lens and Working Hypotheses
- Market Structure, Signals, and Trend Drivers
- Benchmarking and Cross-market Comparability
- Market Sizing, Forecasting, and Opportunity Mapping
- Research Design and Evidence Framework
- Desk Research Programme (Secondary Evidence)
- Company Annual and Sustainability Reports
- Peer-reviewed Journals and Academic Literature
- Corporate Websites, Product Literature, and Technical Notes
- Earnings Decks and Investor Briefings
- Statutory Filings and Regulatory Disclosures
- Technical White Papers and Standards Notes
- Trade Journals, Industry Magazines, and Analyst Briefs
- Conference Proceedings, Webinars, and Seminar Materials
- Government Statistics Portals and Public Data Releases
- Press Releases and Reputable Media Coverage
- Specialist Newsletters and Curated Briefings
- Sector Databases and Reference Repositories
- FMI Internal Proprietary Databases and Historical Market Datasets
- Subscription Datasets and Paid Sources
- Social Channels, Communities, and Digital Listening Inputs
- Additional Desk Sources
- Expert Input and Fieldwork (Primary Evidence)
- Primary Modes
- Qualitative Interviews and Expert Elicitation
- Quantitative Surveys and Structured Data Capture
- Blended Approach
- Why Primary Evidence is Used
- Field Techniques
- Interviews
- Surveys
- Focus Groups
- Observational and In-context Research
- Social and Community Interactions
- Stakeholder Universe Engaged
- C-suite Leaders
- Board Members
- Presidents and Vice Presidents
- R&D and Innovation Heads
- Technical Specialists
- Domain Subject-matter Experts
- Scientists
- Physicians and Other Healthcare Professionals
- Governance, Ethics, and Data Stewardship
- Research Ethics
- Data Integrity and Handling
- Primary Modes
- Tooling, Models, and Reference Databases
- Desk Research Programme (Secondary Evidence)
- Data Engineering and Model Build
- Data Acquisition and Ingestion
- Cleaning, Normalisation, and Verification
- Synthesis, Triangulation, and Analysis
- Quality Assurance and Audit Trail
- Market Background
- Market Dynamics
- Drivers
- Restraints
- Opportunity
- Trends
- Scenario Forecast
- Demand in Optimistic Scenario
- Demand in Likely Scenario
- Demand in Conservative Scenario
- Opportunity Map Analysis
- Product Life Cycle Analysis
- Supply Chain Analysis
- Investment Feasibility Matrix
- Value Chain Analysis
- PESTLE and Porter’s Analysis
- Regulatory Landscape
- Regional Parent Market Outlook
- Production and Consumption Statistics
- Import and Export Statistics
- Market Dynamics
- Global Market Analysis 2021 to 2025 and Forecast, 2026 to 2036
- Historical Market Size Value (USD Million) Analysis, 2021 to 2025
- Current and Future Market Size Value (USD Million) Projections, 2026 to 2036
- Y-o-Y Growth Trend Analysis
- Absolute $ Opportunity Analysis
- Global Market Pricing Analysis 2021 to 2025 and Forecast 2026 to 2036
- Global Market Analysis 2021 to 2025 and Forecast 2026 to 2036, By Device
- Introduction / Key Findings
- Historical Market Size Value (USD Million) Analysis By Device, 2021 to 2025
- Current and Future Market Size Value (USD Million) Analysis and Forecast By Device, 2026 to 2036
- Diagnostic and Monitoring Devices
- Therapeutic and Surgical Devices
- CRM Devices
- Catheters
- Diagnostic and Monitoring Devices
- Y-o-Y Growth Trend Analysis By Device, 2021 to 2025
- Absolute $ Opportunity Analysis By Device, 2026 to 2036
- Global Market Analysis 2021 to 2025 and Forecast 2026 to 2036, By Application
- Introduction / Key Findings
- Historical Market Size Value (USD Million) Analysis By Application, 2021 to 2025
- Current and Future Market Size Value (USD Million) Analysis and Forecast By Application, 2026 to 2036
- Coronary Artery Diseases
- Cardiac Arrhythmia
- Heart Failure
- Coronary Artery Diseases
- Y-o-Y Growth Trend Analysis By Application, 2021 to 2025
- Absolute $ Opportunity Analysis By Application, 2026 to 2036
- Global Market Analysis 2021 to 2025 and Forecast 2026 to 2036, By End User
- Introduction / Key Findings
- Historical Market Size Value (USD Million) Analysis By End User, 2021 to 2025
- Current and Future Market Size Value (USD Million) Analysis and Forecast By End User, 2026 to 2036
- Hospitals
- Specialty Clinics
- Hospitals
- Y-o-Y Growth Trend Analysis By End User, 2021 to 2025
- Absolute $ Opportunity Analysis By End User, 2026 to 2036
- Global Market Analysis 2021 to 2025 and Forecast 2026 to 2036, By Deployment
- Introduction / Key Findings
- Historical Market Size Value (USD Million) Analysis By Deployment, 2021 to 2025
- Current and Future Market Size Value (USD Million) Analysis and Forecast By Deployment, 2026 to 2036
- Cloud Based Deployment
- On Premise Deployment
- Hybrid Deployment
- Cloud Based Deployment
- Y-o-Y Growth Trend Analysis By Deployment, 2021 to 2025
- Absolute $ Opportunity Analysis By Deployment, 2026 to 2036
- Global Market Analysis 2021 to 2025 and Forecast 2026 to 2036, By Region
- Introduction
- Historical Market Size Value (USD Million) Analysis By Region, 2021 to 2025
- Current Market Size Value (USD Million) Analysis and Forecast By Region, 2026 to 2036
- North America
- Latin America
- Western Europe
- Eastern Europe
- East Asia
- South Asia and Pacific
- Middle East & Africa
- Market Attractiveness Analysis By Region
- North America Market Analysis 2021 to 2025 and Forecast 2026 to 2036, By Country
- Historical Market Size Value (USD Million) Trend Analysis By Market Taxonomy, 2021 to 2025
- Market Size Value (USD Million) Forecast By Market Taxonomy, 2026 to 2036
- By Country
- USA
- Canada
- Mexico
- By Device
- By Application
- By End User
- By Deployment
- By Country
- Market Attractiveness Analysis
- By Country
- By Device
- By Application
- By End User
- By Deployment
- Key Takeaways
- Latin America Market Analysis 2021 to 2025 and Forecast 2026 to 2036, By Country
- Historical Market Size Value (USD Million) Trend Analysis By Market Taxonomy, 2021 to 2025
- Market Size Value (USD Million) Forecast By Market Taxonomy, 2026 to 2036
- By Country
- Brazil
- Chile
- Rest of Latin America
- By Device
- By Application
- By End User
- By Deployment
- By Country
- Market Attractiveness Analysis
- By Country
- By Device
- By Application
- By End User
- By Deployment
- Key Takeaways
- Western Europe Market Analysis 2021 to 2025 and Forecast 2026 to 2036, By Country
- Historical Market Size Value (USD Million) Trend Analysis By Market Taxonomy, 2021 to 2025
- Market Size Value (USD Million) Forecast By Market Taxonomy, 2026 to 2036
- By Country
- Germany
- UK
- Italy
- Spain
- France
- Nordic
- BENELUX
- Rest of Western Europe
- By Device
- By Application
- By End User
- By Deployment
- By Country
- Market Attractiveness Analysis
- By Country
- By Device
- By Application
- By End User
- By Deployment
- Key Takeaways
- Eastern Europe Market Analysis 2021 to 2025 and Forecast 2026 to 2036, By Country
- Historical Market Size Value (USD Million) Trend Analysis By Market Taxonomy, 2021 to 2025
- Market Size Value (USD Million) Forecast By Market Taxonomy, 2026 to 2036
- By Country
- Russia
- Poland
- Hungary
- Balkan & Baltic
- Rest of Eastern Europe
- By Device
- By Application
- By End User
- By Deployment
- By Country
- Market Attractiveness Analysis
- By Country
- By Device
- By Application
- By End User
- By Deployment
- Key Takeaways
- East Asia Market Analysis 2021 to 2025 and Forecast 2026 to 2036, By Country
- Historical Market Size Value (USD Million) Trend Analysis By Market Taxonomy, 2021 to 2025
- Market Size Value (USD Million) Forecast By Market Taxonomy, 2026 to 2036
- By Country
- China
- Japan
- South Korea
- By Device
- By Application
- By End User
- By Deployment
- By Country
- Market Attractiveness Analysis
- By Country
- By Device
- By Application
- By End User
- By Deployment
- Key Takeaways
- South Asia and Pacific Market Analysis 2021 to 2025 and Forecast 2026 to 2036, By Country
- Historical Market Size Value (USD Million) Trend Analysis By Market Taxonomy, 2021 to 2025
- Market Size Value (USD Million) Forecast By Market Taxonomy, 2026 to 2036
- By Country
- India
- ASEAN
- Australia & New Zealand
- Rest of South Asia and Pacific
- By Device
- By Application
- By End User
- By Deployment
- By Country
- Market Attractiveness Analysis
- By Country
- By Device
- By Application
- By End User
- By Deployment
- Key Takeaways
- Middle East & Africa Market Analysis 2021 to 2025 and Forecast 2026 to 2036, By Country
- Historical Market Size Value (USD Million) Trend Analysis By Market Taxonomy, 2021 to 2025
- Market Size Value (USD Million) Forecast By Market Taxonomy, 2026 to 2036
- By Country
- Kingdom of Saudi Arabia
- Other GCC Countries
- Turkiye
- South Africa
- Other African Union
- Rest of Middle East & Africa
- By Device
- By Application
- By End User
- By Deployment
- By Country
- Market Attractiveness Analysis
- By Country
- By Device
- By Application
- By End User
- By Deployment
- Key Takeaways
- Key Countries Market Analysis
- USA
- Pricing Analysis
- Market Share Analysis, 2025
- By Device
- By Application
- By End User
- By Deployment
- Canada
- Pricing Analysis
- Market Share Analysis, 2025
- By Device
- By Application
- By End User
- By Deployment
- Mexico
- Pricing Analysis
- Market Share Analysis, 2025
- By Device
- By Application
- By End User
- By Deployment
- Brazil
- Pricing Analysis
- Market Share Analysis, 2025
- By Device
- By Application
- By End User
- By Deployment
- Chile
- Pricing Analysis
- Market Share Analysis, 2025
- By Device
- By Application
- By End User
- By Deployment
- Germany
- Pricing Analysis
- Market Share Analysis, 2025
- By Device
- By Application
- By End User
- By Deployment
- UK
- Pricing Analysis
- Market Share Analysis, 2025
- By Device
- By Application
- By End User
- By Deployment
- Italy
- Pricing Analysis
- Market Share Analysis, 2025
- By Device
- By Application
- By End User
- By Deployment
- Spain
- Pricing Analysis
- Market Share Analysis, 2025
- By Device
- By Application
- By End User
- By Deployment
- France
- Pricing Analysis
- Market Share Analysis, 2025
- By Device
- By Application
- By End User
- By Deployment
- India
- Pricing Analysis
- Market Share Analysis, 2025
- By Device
- By Application
- By End User
- By Deployment
- ASEAN
- Pricing Analysis
- Market Share Analysis, 2025
- By Device
- By Application
- By End User
- By Deployment
- Australia & New Zealand
- Pricing Analysis
- Market Share Analysis, 2025
- By Device
- By Application
- By End User
- By Deployment
- China
- Pricing Analysis
- Market Share Analysis, 2025
- By Device
- By Application
- By End User
- By Deployment
- Japan
- Pricing Analysis
- Market Share Analysis, 2025
- By Device
- By Application
- By End User
- By Deployment
- South Korea
- Pricing Analysis
- Market Share Analysis, 2025
- By Device
- By Application
- By End User
- By Deployment
- Russia
- Pricing Analysis
- Market Share Analysis, 2025
- By Device
- By Application
- By End User
- By Deployment
- Poland
- Pricing Analysis
- Market Share Analysis, 2025
- By Device
- By Application
- By End User
- By Deployment
- Hungary
- Pricing Analysis
- Market Share Analysis, 2025
- By Device
- By Application
- By End User
- By Deployment
- Kingdom of Saudi Arabia
- Pricing Analysis
- Market Share Analysis, 2025
- By Device
- By Application
- By End User
- By Deployment
- Turkiye
- Pricing Analysis
- Market Share Analysis, 2025
- By Device
- By Application
- By End User
- By Deployment
- South Africa
- Pricing Analysis
- Market Share Analysis, 2025
- By Device
- By Application
- By End User
- By Deployment
- USA
- Market Structure Analysis
- Competition Dashboard
- Competition Benchmarking
- Market Share Analysis of Top Players
- By Regional
- By Device
- By Application
- By End User
- By Deployment
- Competition Analysis
- Competition Deep Dive
- Philips Healthcare
- Overview
- Product Portfolio
- Profitability by Market Segments (Product/Age /Sales Channel/Region)
- Sales Footprint
- Strategy Overview
- Marketing Strategy
- Product Strategy
- Channel Strategy
- Siemens Healthineers
- GE HealthCare
- Fujifilm Healthcare
- Canon Medical Systems Corporation
- Philips Healthcare
- Competition Deep Dive
- Assumptions & Acronyms Used


