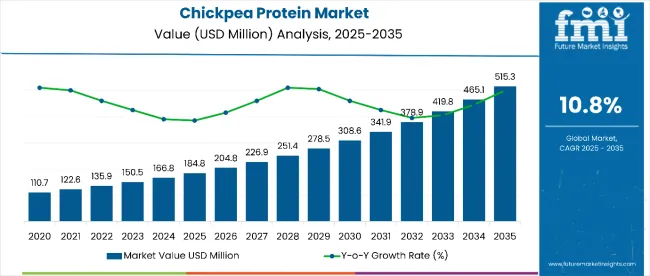
The chickpea protein market is estimated to be valued at USD 184.8 million in 2025 and is projected to reach USD 515.3 million by 2035, registering a compound annual growth rate (CAGR) of 10.8% over the forecast period.
The market is projected to add an absolute dollar opportunity of USD 330.5 million over the forecast period. This reflects a 2.79 times growth at a compound annual growth rate of 10.8%. The market’s evolution is expected to be driven by rising demand for plant-based protein alternatives, clean-label nutrition, and sustainable food sources, particularly in response to increasing vegan, vegetarian, and flexitarian dietary trends.
By 2030, the market is likely to reach USD 308.3 million, accounting for USD 123.5 million in incremental value during the first half of the decade. The remaining USD 207 million is expected during the second half, suggesting a strongly back-loaded growth pattern. Product innovation in texturized protein formulations, functional food applications, and protein fortification is gaining traction due to chickpea protein’s favorable nutritional profile, digestibility, and versatile functional properties.
Leading companies such as ADM, Cargill Inc, International Flavors & Fragrances Inc, Kerry Group, and SunOptaInc are consolidating their positions by strengthening product portfolios and advancing next-generation chickpea protein offerings. Their focus includes high-purity isolates, organic product lines, and value-added formulations targeted at sports nutrition, pharmaceuticals, and personal care sectors, enabling deeper penetration across developed and emerging regions. By investing in innovation, sustainability, and clean-label solutions, these players are enhancing consumer access while capturing growth opportunities in the rapidly expanding plant-based protein market.
The market holds a critical position within the broader plant-based protein sector, driven by rising demand for nutritious, sustainable, and allergen-friendly alternatives. Isolates, representing nearly 48% of product usage, are central to high-performance nutrition and functional food applications. This sector contributes substantially to the global shift toward plant-based diets, fueled by growing health awareness, environmental concerns, and increasing adoption of plant proteins in diverse applications.
The market is evolving with innovations in protein extraction technologies, texture enhancement, and clean-label formulations that improve functionality, digestibility, and appeal. Companies are strengthening their portfolios with specialized chickpea protein ingredients designed for sports supplements, nutraceuticals, and personal care products, aiming to meet shifting consumer preferences. Strategic collaborations with food manufacturers, healthcare firms, and sustainability advocates are reshaping accessibility and positioning chickpea protein as an essential ingredient in health-conscious and eco-friendly product portfolios worldwide.
| Metric | Value |
|---|---|
| Market Value (2025) | USD 184.8 Million |
| Market Forecast Value (2035) | USD 515.3 Million |
| Forecast CAGR (2025 to 2035) | 10.8% |
The chickpea protein market is experiencing significant growth due to rising consumer demand for plant-based, sustainable, and clean-label protein alternatives across industries such as food & beverage, sports nutrition, pharmaceuticals, and personal care. Increasing health awareness and a global shift toward plant-based diets are key factors driving this adoption. It is further supported by advancements in protein extraction technologies and formulation innovations that enhance chickpea protein’s functionality, nutritional profile, and taste.
Growing consumer preference for organic products and eco-friendly ingredients, particularly in emerging markets like China and India, is fueling strong regional growth. In developed markets such as the USA and Europe, demand remains steady due to the increasing use of chickpea protein in sports nutrition supplements, functional foods, and specialty health products.
Key market players are strengthening their positions through product innovation, expansion of organic and isolate protein offerings, and strategic collaborations with food manufacturers and healthcare companies. Emphasis on sustainability, clean-label certifications, and regulatory compliance continues to build consumer trust and supports the long-term expansion of the chickpea protein market.
The market is segmented by product type, nature, end use, and region. By product type, the market is categorized into isolate, concentrate, textured, and hydrolyzed. Based on nature, the market is bifurcated into organic and conventional. In terms of end use, the market is divided into food and beverage processing, sports nutrition, infant nutrition, pharmaceutical products, personal care products, and animal nutrition. Regionally, the market is classified into North America, Latin America, Western Europe, Eastern Europe, Balkans & Baltic, Russia & Belarus, Central Asia, East Asia, South Asia & Pacific, and the Middle East & Africa.
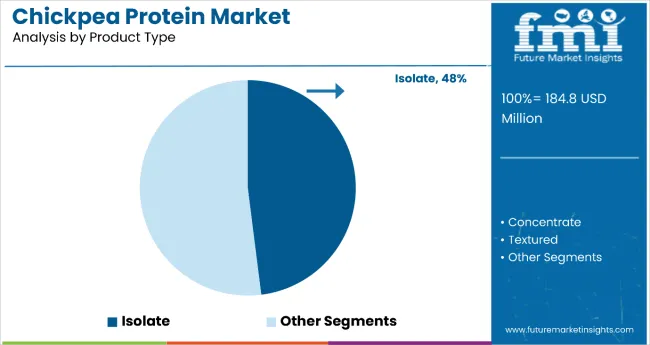
The most lucrative product type segment in the global chickpea protein market is the Isolate segment, which is projected to command a dominant market share of 48% by 2035. Chickpea protein isolates are highly valued for their superior protein concentration, functional properties, and ease of incorporation into diverse formulations, including sports nutrition products, meat alternatives, and pharmaceutical formulations. The isolate form offers higher purity and better digestibility compared to concentrates and textured proteins, making it ideal for use in specialized high-performance nutrition and dietary supplements.
The growing consumer demand for clean-label, allergen-free, and plant-based protein sources substantially catalyzes the growth of the isolate segment. Advances in extraction and processing technologies have enabled manufacturers to produce isolates with enhanced solubility, better taste profiles, and improved bioavailability. Additionally, isolates benefit from increasing adoption in the rapidly expanding sports nutrition market and therapeutic nutrition applications, where protein quality and functionality are critical. This makes the isolate segment a key driver of both revenue and innovation in the chickpea protein market landscape.
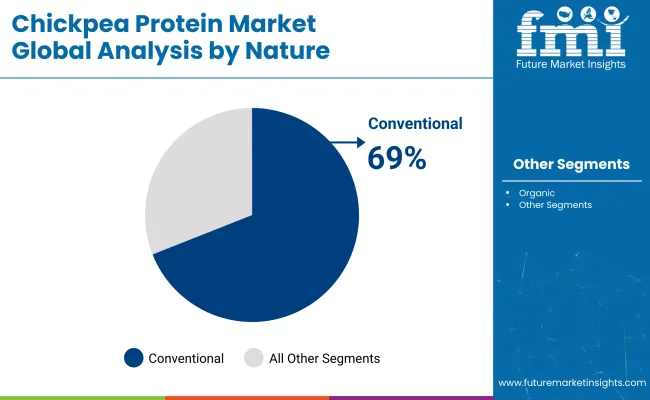
The conventional segment in the chickpea protein market is the most lucrative and is estimated to hold a dominant market share of 69%. This segment commands a significant lead due to its broad availability, cost-effective production methods, and mature supply chains. Conventional chickpea protein is produced using established agricultural practices, enabling large-scale manufacturing that meets demand across industries such as food and beverage processing, sports nutrition, and pharmaceuticals.
The affordability of conventional chickpea protein makes it the preferred choice for mass-market food manufacturers targeting mainstream consumers. Its nutritional benefits, including a well-balanced amino acid profile and allergen-free nature, further strengthen its adoption. While organic chickpea protein is witnessing rapid growth fueled by health-conscious and environmentally aware consumers, the conventional segment's robustness lies in its scalability and consistent supply, making it a backbone of the global chickpea protein market. Manufacturers continue to innovate processing techniques to enhance purity and functionality, keeping this segment highly competitive and profitable.
From 2025 to 2035 is driven by rising consumer awareness about health and nutrition, increasing demand for plant-based and clean-label protein sources, and expanding applications across food, sports nutrition, pharmaceuticals, and personal care sectors. Technological advancements in protein extraction and processing enhance functionality and taste, fueling greater adoption. Increasing availability and acceptance in emerging markets such as India and China further propel market growth.
Health Awareness and Product Innovation Boost Chickpea Protein Market Growth
Growing health consciousness among consumers and rising trends in vegan, vegetarian, and flexitarian diets drive the chickpea protein market. Innovations in isolate and organic chickpea protein, including improved solubility, digestibility, and allergen-free properties, support expanded use in sports nutrition, infant formulas, and nutraceuticals. The development of plant-based meat alternatives and personal care applications also contribute to market expansion.
Innovation and Sustainability Expanding Chickpea Protein Market Opportunities
Advancements in chickpea protein processing include high-purity isolates, organic certifications, and value-added formulations for diversified applications. Sustainable farming and eco-friendly manufacturing practices are increasingly adopted by manufacturers to meet consumer demand for ethical products. Focus on regulatory compliance, quality standards, and clean-label marketing strengthens trust among consumers and food manufacturers, driving long-term market opportunities.
| Countries | CAGR (%) |
|---|---|
| China | 12.0 |
| India | 11.7 |
| United States | 11.4 |
| Brazil | 11.2 |
| Canada | 10.8 |
| United Kingdom | 9.0 |
| Germany | 8.5 |
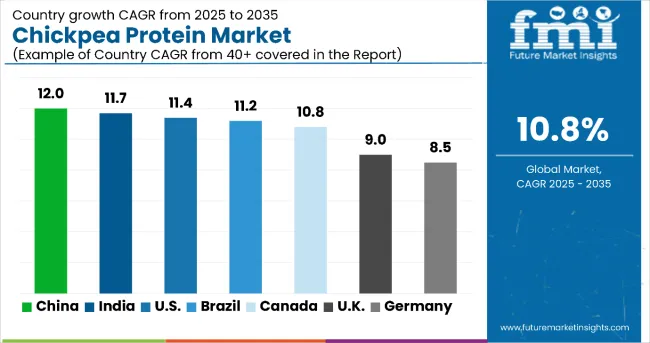
The global chickpea protein market exhibits varied growth rates across key countries, reflecting diverse market dynamics. China leads with a 12.0% CAGR, driven by expanding production and strong demand for clean-label products. India follows at 11.7%, benefiting from its large chickpea production and health-conscious consumers. The USA posts an 11.4% CAGR, propelled by flexible diets and advanced protein extraction. Brazil grows at 11.2%, supported by food processing expansion and exports. Canada’s 10.8% CAGR is fueled by organic preference and sustainability incentives. The UK sees moderate growth at 9.0%, influenced by plant-based diet trends, while Germany’s 8.5% reflects a mature, regulated market. These rates balance emerging market growth with mature market stability.
The report covers an in-depth analysis of 40+ countries; seven top-performing countries are highlighted below.
Revenue from chickpea protein in China is growing at a CAGR of 12.0%, driven by rapid expansion of production capacity and growing consumer awareness of plant-based nutrition. The country’s middle class is increasingly adopting clean-label and allergen-free alternatives, pushing demand higher. Investments in advanced extraction technologies and sustainable farming practices are improving production efficiency. Moreover, online retail platforms have become vital in expanding chickpea protein’s accessibility nationwide. Government initiatives promoting organic farming and nutrition policies further bolster supply capabilities. Leading manufacturers actively collaborate with research institutions to innovate formulations. The country’s urban dietary shifts toward plant proteins enhance market prospects while solidifying China’s strategic position globally.
Revenue from chickpea protein in India is growing at a CAGR of 11.7%, supported by its status as the world’s largest chickpea producer and consumer. Increased health consciousness and prevalence of vegetarian diets foster widespread demand for plant-based proteins. The country’s extensive agricultural base and growing processing units allow significant output expansion. Local manufacturers are advancing innovations in protein concentrates and isolates catering to diverse sectors such as infant nutrition and sports supplements. Government policies incentivize sustainable farming and organic production. Health-focused retail outlets and e-commerce platforms are expanding consumer access. Moreover, research initiatives focused on protein functionalization enhance product quality. India’s dual advantage of domestic consumption and export potential firmly anchors its market leadership.
Revenue from chickpea protein in the United States is growing at a CAGR of 11.4%, fueled by high consumer interest in vegan and flexitarian lifestyles. The isolate protein segment gains popularity through advanced extraction methods, improving product versatility for sports nutrition and therapeutic foods. Retail expansion across supermarkets and e-commerce channels ensures widespread availability. Manufacturers emphasize sustainability, clean-label certifications, and allergen-free claims to resonate with consumers. Investment in reliable supply chains guarantees consistent quality. Awareness programs about environmental benefits build consumer confidence. The organic protein segment also sees a notable rise. Industry collaborations accelerate innovation and deeper market penetration.
Demand for chickpea protein in Brazil grows at a CAGR of 11.2%, supported by an expanding food processing sector and rising consumer health awareness in urban areas. Increasing adoption of plant-based diets fuels demand for protein isolates and concentrates. Domestic players invest in processing technologies and bioactive protein research, enhancing product quality. Export opportunities boost market value and encourage production scalability. The launch of functional and fortified food products further stimulates sales. Improved distribution infrastructure expands reach across regions. Collaboration between agribusiness and food manufacturers fosters innovation. Growing consumer education about the benefits of plant proteins reinforces market stability.
Demand for chickpea protein in Canada experiences a CAGR of 10.8%, driven by strong consumer preference for organic and natural chickpea protein products. Government incentives for sustainable agriculture foster production capacity growth. Specialty sports nutrition brands contribute to increased demand for high-quality isolates. The established food processing industry encourages development of value-added formulations. Retailers offer diverse protein product options, complementing growing organic certification standards that enhance transparency and consumer trust. Public-private partnerships focus on improving supply chain efficiency. A growing emphasis on clean-label products underpins steady and consistent market expansion.
Demand for chickpea protein in the United Kingdom sees a CAGR of 9.0%, influenced by an increasing number of vegan, vegetarian, and flexitarian consumers. Environmental sustainability considerations heavily affect purchasing decisions. The country witnesses rising launches of chickpea protein-blended food products tailored to diverse dietary preferences. Clean-label marketing and availability of organic options gain popularity. Ongoing innovations enhance protein taste and functional profiles. Expansion of retail distribution channels and foodservice incorporation broaden product reach. Collaborations across industry stakeholders raise plant-based protein awareness. Sustainability messaging resonates well with targeted consumer segments.
Demand for chickpea protein in Germany is growing at a CAGR of 8.5%, reflecting steady adoption in the mature European plant-based food landscape. Strong regulatory frameworks ensure high product quality and safety standards. Consumers prioritize allergen-free, bioactive protein products, supporting consistent adoption. Organic certifications and transparent labeling help reinforce trust. Collaboration between manufacturers and research institutes fosters advanced protein extraction and innovative functionalities. Retailers respond with expanded plant-based offerings aligned with consumer health trends. Public awareness campaigns stress environmental benefits. Partnerships focused on research and development drive continued advancement.
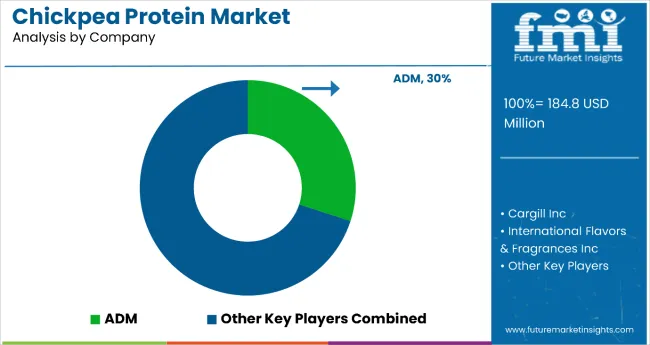
The Chickpea Protein Market is experiencing significant growth globally, driven by rising consumer demand for plant-based nutrition and clean-label ingredients. Leading companies such as Archer Daniels Midland Company (ADM) and Cargill Incorporated are investing heavily in processing innovations to enhance the functionality and solubility of chickpea-derived proteins for use in beverages, meat substitutes, and bakery products.
International Flavors & Fragrances Inc. (IFF) and Kerry Group plc are expanding their product portfolios with chickpea protein isolates and concentrates tailored for vegan and allergen-free formulations. These players are focusing on improving texture, mouthfeel, and flavor profiles to meet consumer expectations for taste parity with animal-based proteins.
SunOpta Inc. is leveraging its expertise in sustainable sourcing and non-GMO ingredient production to strengthen its position in the plant protein space. The surge in flexitarian and vegan diets, particularly across North America and Europe, has accelerated demand for chickpea protein due to its superior amino acid composition and digestibility.
| Items | Values |
|---|---|
| Quantitative Units (2025) | USD 184.8 million |
| Product Type | Isolate, Concentrate, Textured, Hydrolyzed |
| Nature | Organic and Conventional |
| End Use | Food & Beverage Processing, Sports Nutrition, Infant Nutrition, Pharmaceutical Products, Personal Care Products, Animal Nutrition |
| Regions Covered | North America, Latin America, Western Europe, Eastern Europe, Balkans & Baltic, Russia & Belarus, Central Asia, East Asia, South Asia & Pacific, Middle East & Africa |
| Countries Covered | United States, Canada, United Kingdom, Germany, France, China, India, Brazil, Australia, South Korea, Japan, and 40+ other countries |
| Key Companies Profiled |
Archer Daniels Midland Company (ADM), Cargill Incorporated, International Flavors & Fragrances Inc. (IFF), Kerry Group plc, SunOpta Inc. |
| Additional Attributes | Revenue by product type and nature; technological advancements in protein extraction and formulations; demand in sports nutrition and pharmaceuticals; organic and clean-label certifications; sustainable farming; consumer health awareness; plant-based diet adoption |
The global chickpea protein market is estimated to be valued at USD 184.8 million in 2025.
The market size for chickpea protein is projected to reach USD 515.3 million by 2035.
The chickpea protein market is expected to grow at a 10.8% CAGR between 2025 and 2035.
The isolate segment is projected to lead in the chickpea protein market with 48% market share in 2035.
In terms of nature, the conventional segment is projected to command 69% share in the chickpea protein market in 2035.


Our Research Products

The "Full Research Suite" delivers actionable market intel, deep dives on markets or technologies, so clients act faster, cut risk, and unlock growth.

The Leaderboard benchmarks and ranks top vendors, classifying them as Established Leaders, Leading Challengers, or Disruptors & Challengers.

Locates where complements amplify value and substitutes erode it, forecasting net impact by horizon

We deliver granular, decision-grade intel: market sizing, 5-year forecasts, pricing, adoption, usage, revenue, and operational KPIs—plus competitor tracking, regulation, and value chains—across 60 countries broadly.

Spot the shifts before they hit your P&L. We track inflection points, adoption curves, pricing moves, and ecosystem plays to show where demand is heading, why it is changing, and what to do next across high-growth markets and disruptive tech

Real-time reads of user behavior. We track shifting priorities, perceptions of today’s and next-gen services, and provider experience, then pace how fast tech moves from trial to adoption, blending buyer, consumer, and channel inputs with social signals (#WhySwitch, #UX).

Partner with our analyst team to build a custom report designed around your business priorities. From analysing market trends to assessing competitors or crafting bespoke datasets, we tailor insights to your needs.
Supplier Intelligence
Discovery & Profiling
Capacity & Footprint
Performance & Risk
Compliance & Governance
Commercial Readiness
Who Supplies Whom
Scorecards & Shortlists
Playbooks & Docs
Category Intelligence
Definition & Scope
Demand & Use Cases
Cost Drivers
Market Structure
Supply Chain Map
Trade & Policy
Operating Norms
Deliverables
Buyer Intelligence
Account Basics
Spend & Scope
Procurement Model
Vendor Requirements
Terms & Policies
Entry Strategy
Pain Points & Triggers
Outputs
Pricing Analysis
Benchmarks
Trends
Should-Cost
Indexation
Landed Cost
Commercial Terms
Deliverables
Brand Analysis
Positioning & Value Prop
Share & Presence
Customer Evidence
Go-to-Market
Digital & Reputation
Compliance & Trust
KPIs & Gaps
Outputs
Full Research Suite comprises of:
Market outlook & trends analysis
Interviews & case studies
Strategic recommendations
Vendor profiles & capabilities analysis
5-year forecasts
8 regions and 60+ country-level data splits
Market segment data splits
12 months of continuous data updates
DELIVERED AS:
PDF EXCEL ONLINE
Competitive Overview of Chickpea Protein Companies
UK Chickpea Protein Market Insights – Demand, Size & Industry Trends 2025–2035
USA Chickpea Protein Market Report – Trends, Demand & Industry Forecast 2025–2035
ASEAN Chickpea Protein Market Trends – Growth, Demand & Forecast 2025–2035
Europe Chickpea Protein Market Outlook – Size, Share & Forecast 2025–2035
Australia Chickpea Protein Market Outlook – Demand, Trends & Forecast 2025–2035
Latin America Chickpea Protein Market Analysis – Demand, Share & Forecast 2025–2035
Chickpea Flour Market Analysis - Size, Share, and Forecast Outlook 2025 to 2035
Chickpea Milk Market Analysis by Category, Flavor and End Use Through 2025 to 2035
Chickpea Market Trends - Nutrition & Global Trade Insights 2025 to 2035
Demand for Chickpea Flour in EU Size and Share Forecast Outlook 2025 to 2035
Protein-Coating Line Market Forecast Outlook 2025 to 2035
Protein Labelling Market Size and Share Forecast Outlook 2025 to 2035
Protein Puddings Market Size and Share Forecast Outlook 2025 to 2035
Protein/Antibody Engineering Market Size and Share Forecast Outlook 2025 to 2035
Protein Expression Market Size and Share Forecast Outlook 2025 to 2035
Protein Purification Resin Market Size and Share Forecast Outlook 2025 to 2035
Protein Hydrolysate For Animal Feed Application Market Size and Share Forecast Outlook 2025 to 2035
Protein Crisps Market Outlook - Growth, Demand & Forecast 2025 to 2035
Protein Hydrolysate Market Size and Share Forecast Outlook 2025 to 2035

Thank you!
You will receive an email from our Business Development Manager. Please be sure to check your SPAM/JUNK folder too.
Chat With
MaRIA