Demand for organic fertilizer in North America is projected to grow from USD 2.2 billion in 2025 to approximately USD 4.8 billion by 2035, recording an absolute increase of USD 2.6 billion over the forecast period. This translates into total growth of 118.2%, with demand forecast to expand at a compound annual growth rate (CAGR) of 8.2% between 2025 and 2035. According to validated data from FMI’s Chemical Industry Analytics, tracking raw material price and sustainability drivers, overall sales are expected to grow by nearly 2.18X during the same period, supported by rising North America certified organic farming activities, increasing consumer preference for organic produce, and growing demand for sustainable soil management solutions across cereals & grains, fruits & vegetables, and specialty crop operations. North America, led by Canada, United States, and Mexico, continues to demonstrate strong growth potential driven by sustainability regulations and regenerative agriculture initiatives.
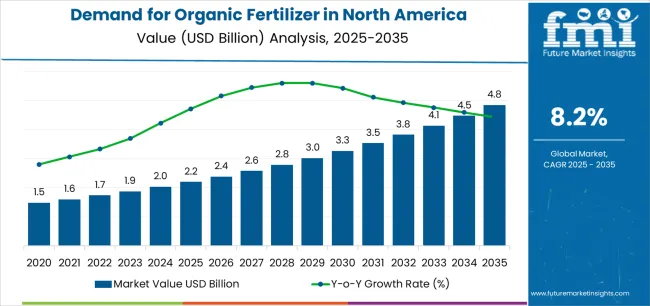
Between 2025 and 2030, North America organic fertilizer demand is projected to expand from USD 2.2 billion to USD 3.2 billion, resulting in a value increase of USD 1 billion, which represents 38.5% of the total forecast growth for the decade. This phase of growth will be shaped by rising North America certified organic acreage globally, particularly across United States, Canada, and Mexico where organic certification standards and consumer demand for organic produce are accelerating fertilizer adoption. Increasing mechanization of organic farming systems and growing adoption of precision agriculture practices with biological inputs continue to drive demand. Fertilizer producers are expanding their production capabilities to address the growing complexity of modern North America organic farming operations and sustainability requirements, with North American operations leading investments in advanced formulation technologies and certified organic input production.
From 2030 to 2035, demand is forecast to grow from USD 3.2 billion to USD 4.8 billion, adding another USD 1.6 billion, which constitutes 61.5% of the overall ten-year expansion. This period is expected to be characterized by expansion of specialized organo-mineral formulations with enhanced nutrient content, integration of advanced microbial inoculants and biostimulant technologies, and development of standardized quality protocols across different crop production systems. The growing adoption of regenerative agriculture practices and soil health monitoring initiatives, particularly in United States and Canada, will drive demand for more sophisticated fertilizer formulations and specialized application capabilities.
Between 2020 and 2025, North America organic fertilizer demand experienced steady expansion, driven by increasing North America certified organic farming activities in row crops and specialty crop production and growing awareness of soil health benefits for operational sustainability and long-term productivity. The sector developed as farming operations, especially in United States, recognized the need for specialized organic inputs and advanced nutrient management systems to improve yields while meeting stringent organic certification standards. Organic farmers and input distributors began emphasizing proper nutrient management and technological upgrades to maintain production efficiency and certification compliance.
| Metric | Value |
|---|---|
| North America Organic Fertilizer Sales Value (2025) | USD 2.2 billion |
| North America Organic Fertilizer Forecast Value (2035) | USD 4.8 billion |
| North America Organic Fertilizer Forecast CAGR (2025–2035) | 8.2% |
Demand expansion is being supported by the rapid increase in North America certified organic farming operations worldwide, with United States and Canada maintaining their positions as organic agriculture leadership regions, and the corresponding need for certified organic fertilizer inputs for crop nutrition, soil fertility management, and sustainable production activities. Modern organic farming operations rely on certified organic fertilizers to ensure compliant crop nutrition, soil health improvement, and optimal yield performance. North America organic agriculture requires comprehensive nutrient management systems including plant-based materials, animal manures, mineral amendments, and microbial inoculants to maintain certification compliance and agronomic effectiveness.
The growing complexity of North America organic farming operations and increasing certification regulations, particularly stringent requirements in United States under USDA National Organic Program and Canadian Organic Standards, are driving demand for certified organic fertilizers from approved manufacturers with appropriate certification and material verification expertise. Organic farmers are increasingly investing in precision application technologies and enhanced-efficiency formulations to improve nutrient utilization, reduce application costs, and enhance crop performance in challenging North America growing environments. Regulatory requirements and organic certification specifications are establishing standardized input procedures that require specialized sourcing capabilities and certified supply chains, with North American operations often setting benchmark standards for global organic farming practices.
Demand is segmented by source, crop type, form, nutrient content, application, and country. By source, sales are divided into plant-based (seaweed, soybean meal, molasses/green-manure, corn gluten/cottonseed meal, others), animal-based, mineral, microorganism, and others. Based on crop type, demand is categorized into cereals & grains (corn, wheat, rice/others), fruits & vegetables, oilseeds & pulses, and others. In terms of form, sales are segmented into dry fertilizer (pellets/granules, powders) and liquid fertilizer. By nutrient content, demand is divided into up to 20%, 20% to 40% (balanced NPK, enriched organo-mineral), 40% to 60%, and above 60%. By application, sales are segmented into farming (row crops, specialty crops, forage/turf) and gardening. By country, demand is divided into United States, Canada, Mexico, Guatemala, Dominican Republic, Costa Rica, and Honduras, with Canada representing a key growth and innovation hub for North America organic fertilizer technologies.
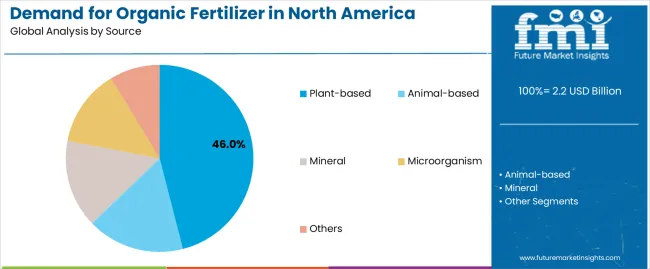
Plant-based organic fertilizers are projected to account for 46% of North America organic fertilizer demand in 2025, making them the leading source category across the sector. This dominance reflects the widespread availability of plant-derived materials including seaweed extracts, soybean meal, molasses, green manure crops, corn gluten meal, and cottonseed meal that provide balanced nutrition and soil conditioning benefits. In North America, particularly United States and Canada, organic certification standards permit diverse plant-based materials that meet allowed substance requirements, ensuring broad adoption across crop production systems. Continuous innovations are improving the efficiency of nutrient extraction, reliability of material sourcing, and cost-effectiveness, enabling organic farmers to maintain certification while optimizing production economics. Advancements in fermentation processing and enzymatic treatment technologies are enhancing nutrient availability by improving material digestibility and plant uptake characteristics.
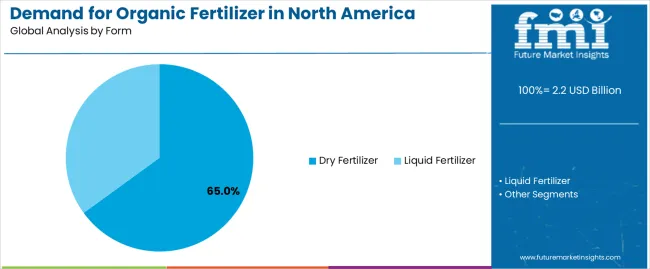
Dry fertilizers are projected to contribute 65% of demand in 2025, making them the single largest formulation segment for North America organic fertilizer. The dry fertilizer category requires specialized processing systems for pelletization (44% segment share) and powder production (21%) that enable efficient handling, storage, and field application. In North America and globally, dry formulations remain the preferred organic fertilizer format for broadcast application, banded placement, and incorporation methods, sustaining steady demand for granulated and pelleted products across row crop and specialty crop systems. Premium dry fertilizer production relies heavily on mechanical processing technologies, binding agents, and quality control systems that ensure particle size consistency, nutrient uniformity, and application accuracy to support precision farming requirements. The segment also benefits from established distribution infrastructure in United States, Canada, and Mexico and ongoing adoption in organic vegetable production systems requiring controlled-release nutrient delivery.
North America organic fertilizer demand is advancing steadily due to increasing North America certified organic farming activities and growing recognition of soil health and sustainability benefits, with United States and Canada serving as key drivers of organic agriculture innovation and certification standards. The sector faces challenges including higher per-unit nutrient costs compared to synthetic alternatives, need for continuous organic certification verification and material compliance, and varying fertilizer performance across different soil types and crop production systems. Precision agriculture initiatives and biostimulant integration programs, particularly advanced in North American operations, continue to influence product specifications and application patterns.
The growing adoption of regenerative agriculture principles, gaining particular traction in United States and Canadian Prairie Provinces, is enabling crop producers to improve soil health metrics without exclusive organic certification, providing environmental benefits and enhanced nutrient cycling efficiency. Soil health programs supported by USDA Natural Resources Conservation Service and provincial agricultural departments offer technical assistance and cost-share funding while encouraging organic matter inputs and biological soil amendments. These initiatives are particularly valuable for transitioning farmers and conventional producers implementing conservation practices that require organic fertilizer supplementation without complete organic system conversion.
Modern organic fertilizer producers, led by North American innovators, are incorporating beneficial microorganism strains and plant biostimulant compounds that improve nutrient availability, enhance plant stress tolerance, and support root development characteristics. Integration of nitrogen-fixing bacteria, phosphate-solubilizing microbes, and mycorrhizal fungi enables more efficient nutrient utilization and comprehensive plant nutrition support. Advanced formulations also support next-generation organic production systems including controlled-environment agriculture and high-value specialty crop operations that demand consistent nutrient delivery and predictable crop response, with North American organic producers increasingly adopting these technologies to meet yield and quality objectives.
| Country | CAGR (2025-2035) |
|---|---|
| USA | 7% |
| Canada | 9.8% |
| Mexico | 8.8% |
| Guatemala | 9.3% |
| Dominican Republic | 9% |
| Costa Rica | 8.5% |
| Honduras | 8.1% |
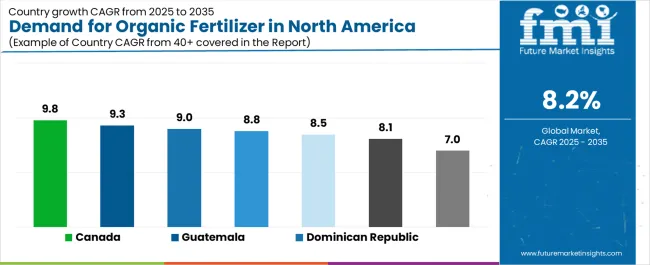
The North America organic fertilizer demand is witnessing strong growth, supported by rising organic certification standards, sustainability initiatives, and the integration of advanced nutrient management systems across farming operations. Canada leads the region with a 9.8% CAGR, reflecting strong investments in Prairie Provinces soil health programs, compliance with manure and compost valorization initiatives, and expansion of organic grain export capacity. Guatemala follows with a 9.3% CAGR, driven by coffee and banana organic certification expansion and smallholder compost hub development. Mexico grows at 8.8%, as high-value fruit and vegetable export operations increasingly adopt drip irrigation with fertigation systems using organic fertilizer solutions.
Demand for North America organic fertilizer in United States is projected to exhibit steady growth with a CAGR of 7% through 2035, driven by large certified organic acreage base exceeding 4.9 million acres, precision agriculture adoption incorporating biological inputs in row crop systems, and retail garden sector expansion supporting residential organic fertilizer consumption. The country's emphasis on organic food production and USDA National Organic Program certification standards is creating sustained demand for diverse organic fertilizer products with appropriate material verification and quality assurance. Major organic fertilizer producers and agricultural retailers are establishing comprehensive distribution networks to support organic farmer needs and regulatory compliance across North American operations. True Organic Products secured approximately USD 5 million USDA Fertilizer Production Expansion Program funding in 2024 to expand Boardman, Oregon production capacity, demonstrating federal support for domestic organic fertilizer manufacturing infrastructure.
Demand for North America organic fertilizer in Canada is expanding at a CAGR of 9.8%, supported by Prairie Provinces soil health improvement programs, manure and compost valorization initiatives converting livestock waste into certified organic fertilizer products, and strong organic grain export growth serving United States and international markets. The country's organic agriculture sector represents approximately 25% of regional organic fertilizer consumption, with increasing adoption across organic wheat, canola, and pulse production systems. Organic fertilizer producers and composting facilities are implementing quality assurance programs to serve expanding North America organic farming activities throughout Canada and cross-border export operations. Agriculture and Agri-Food Canada provides technical assistance and research support strengthening organic input development and agronomic performance optimization.
Demand for North America organic fertilizer in Mexico is growing at a CAGR of 8.8%, driven by high-value organic fruit and vegetable export operations serving United States and international markets, drip irrigation and fertigation system adoption enabling precise organic fertilizer delivery, and expanding certified organic acreage in specialty crop production regions. The country's organic agriculture sector emphasizes export-oriented production systems including organic berries, tomatoes, peppers, and avocados requiring intensive nutrient management and organic certification compliance. Organic farmers and input distributors are investing in liquid organic fertilizer infrastructure and fertigation equipment to address production intensity requirements and maintain product quality standards.
Demand for North America organic fertilizer in Guatemala is expanding at a CAGR of 9.3%, supported by organic coffee and banana certification expansion initiatives, smallholder compost production hub development providing locally-produced organic fertilizers, and international sustainability standards driving organic certification adoption. The country's specialty crop sector represents significant organic fertilizer consumption, with coffee renovation programs and banana plantation management requiring certified organic nutrient inputs. NGO-supported programs and international development initiatives facilitate organic certification access and technical training for smallholder farmers.
Demand for North America organic fertilizer in Dominican Republic is growing at a CAGR of 9%, driven by organic cocoa and banana production clusters, tourism-driven sustainability standards encouraging organic certification, and export-oriented agricultural development supporting certified organic production. The country's tropical crop sector emphasizes organic certification to access premium pricing in international markets while meeting sustainability requirements established by major food companies and certification bodies.
Demand for North America organic fertilizer in Costa Rica is expanding at a CAGR of 8.5%, supported by national sustainability policies promoting organic agriculture, biowaste-to-fertilizer processing facilities converting urban and agricultural waste into organic fertilizer products, and environmental leadership positioning supporting organic certification. The country's comprehensive environmental framework encourages organic farming through policy incentives and technical support programs.
Demand for North America organic fertilizer in Honduras is growing at a CAGR of 8.1%, driven by coffee renovation programs replacing aging coffee plants with improved varieties requiring nutrient supplementation, NGO-backed soil health initiatives providing technical assistance and organic input support, and organic certification adoption among coffee cooperatives. The country's coffee sector represents the primary organic fertilizer application, with smallholder producers implementing organic management practices to access specialty coffee markets.
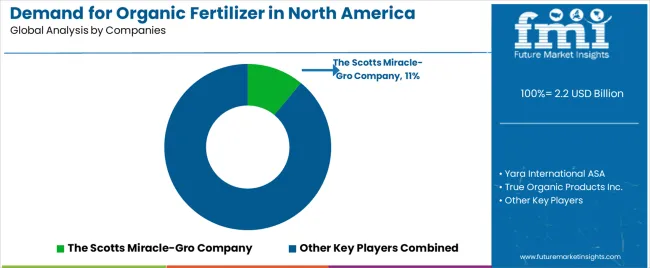
North America organic fertilizer demand is defined by competition among specialized organic input manufacturers, composting operations, and agricultural input distributors, with United States manufacturers maintaining significant regional influence. Producers are investing in advanced processing technologies, organic certification systems, microbial inoculant capabilities, and comprehensive distribution networks to deliver effective, certified, and consistent organic fertilizer solutions across North America farming operations. Strategic partnerships, organic certification excellence, and production capacity expansion are central to strengthening product portfolios and presence across North American farming regions.
The Scotts Miracle-Gro Company, United States-based and a North American industry leader with 11% estimated share, offers comprehensive North America organic fertilizer products including retail garden formulations and professional agricultural grades with focus on brand recognition, product quality, and distribution reach across residential and commercial segments. Yara International ASA, operating globally from Norway with significant North American presence, provides organic-approved mineral fertilizers and organo-mineral blends with emphasis on nutrient efficiency and agronomic support. True Organic Products Inc., following USD 5 million USDA Fertilizer Production Expansion Program award in 2024, is expanding Boardman, Oregon production facility to increase manufacturing capacity for plant-based organic fertilizer products. Sustane Natural Fertilizer Inc. specializes in biosolids-based organic fertilizer production, though faces regulatory scrutiny following New York State proposed five-year biosolids moratorium and EPA PFAS risk assessment warnings issued January 2025.
Wilbur-Ellis Holdings Inc. offers diversified agricultural input distribution including organic fertilizer products across specialty crop and row crop segments. Organic fertilizer producers are establishing comprehensive organic certification programs throughout North American operations, developing enhanced-efficiency formulations with microbial inoculants, and integrating advanced quality control technologies to meet evolving farming operation requirements and organic certification standards across North American crop production systems.
North America organic fertilizer represents a specialized agricultural input category within organic farming and sustainable agriculture applications, projected to grow from USD 2.2 billion in 2025 to USD 4.8 billion by 2035 at an 8.2% CAGR. This critical organic crop nutrition solution—primarily supplied in plant-based, animal-based, and mineral forms for cereals & grains, fruits & vegetables, and specialty crop production—serves as essential infrastructure for organic certification compliance in farming and gardening applications across commercial and residential agricultural sectors. Demand expansion is driven by stringent organic certification regulations under USDA National Organic Program, growing consumer preference for organic food products, expanding certified organic acreage particularly in Canada and United States, and rising emphasis on soil health verification in diverse crop production systems.
Organic Input Certification Standards: Establish comprehensive technical standards for organic fertilizer materials, including allowed substance specifications, prohibited material exclusions, source verification requirements, and processing method criteria that ensure consistent organic compliance in commercial farming applications.
Organic Farming Policy Integration: Develop regulatory frameworks that link organic fertilizer specifications to organic certification standards and crop production requirements, requiring verified material compliance that meets National Organic Program standards, supports certification integrity, and ensures overall organic system credibility.
Supply Chain Traceability Protocols: Implement mandatory material verification standards for organic fertilizer production, ingredient sourcing, and quality documentation in organic input supply chains, including source material certification systems, processing record requirements, and distribution documentation procedures that ensure organic compliance and material authenticity.
Quality Assurance Guidelines: Create specialized guidelines for organic fertilizer nutrient content verification addressing minimum nutrient specifications, organic matter requirements, and prohibited material absence specific to organic crop production compatibility and certification standards.
Transition Support Programs: Provide regulatory frameworks and financial assistance for farmers transitioning to organic production that improve organic fertilizer access, enhance economic viability during transition periods, and support successful organic certification achievement.
Organic Nutrient Management Best Practices: Develop comprehensive technical guidelines for organic fertilizer utilization, application timing optimization, and crop-specific recommendations that maximize agronomic effectiveness, minimize nutrient losses, and ensure reliable organic crop production across different soil types and crop production systems.
Quality Verification Protocols: Establish standardized testing procedures, analytical methods, and certification documentation systems specifically designed for organic fertilizer assessment in diverse farming environments with varying organic certification requirements and crop production specifications.
Performance Benchmarking Systems: Create industry-wide metrics for organic fertilizer agronomic performance, farmer satisfaction, and crop response that enable comparative analysis, identify application best practices, and drive continuous improvement across North American organic farming operations.
Professional Training and Certification: Develop specialized training programs for organic farmers, crop consultants, and input retailers covering organic fertilizer selection, nutrient management principles, and organic system optimization in commercial crop production.
Research Innovation Partnerships: Facilitate collaboration between organic farmers, fertilizer manufacturers, and agricultural research institutions to advance organic fertilizer development and address emerging challenges in soil health improvement and sustainable intensification systems.
Advanced Formulation Development: Invest in research and development of enhanced-efficiency organic fertilizers, controlled-release technologies, and nutrient-enriched formulations that enable superior crop performance while maintaining organic certification compliance and cost competitiveness.
Feedstock Supply Diversification: Develop geographically distributed sourcing strategies with certified organic material suppliers, agricultural residue collection networks, and strategic processing partnerships that ensure raw material availability while minimizing supply disruption risks and organic compliance concerns.
Quality Management Excellence: Engineer comprehensive organic certification capabilities with real-time quality monitoring systems, analytical testing protocols, and validated verification methods that ensure consistent product specifications while reducing batch variation and certification audit concerns.
Technical Service Integration: Create extensive agronomic support with crop-specific recommendations, soil testing interpretation, and nutrient management planning assistance that enhance farmer value while addressing diverse crop production requirements.
Sustainability Innovation: Establish responsible sourcing programs, renewable energy utilization, and circular economy initiatives that reduce production environmental impacts while maintaining product performance and organic certification compliance.
Strategic Fertilizer Selection: Conduct comprehensive assessments of organic fertilizer products, nutrient content specifications, and supplier certifications to optimize input procurement while ensuring crop nutrition requirements and organic certification compliance.
Advanced Nutrient Planning: Implement soil testing programs, crop nutrient requirement analysis, and application timing optimization to maximize organic fertilizer efficiency, reduce input costs, and improve overall crop production profitability.
Organic Certification Integration: Utilize comprehensive input documentation, material verification records, and application tracking to ensure consistent certification compliance while minimizing audit issues and organic system violations.
Crop Rotation Planning: Develop systematic crop rotation strategies that incorporate nitrogen-fixing legumes, cover crop systems, and green manure incorporation while managing external organic fertilizer inputs effectively.
Technology Adoption Investment: Adopt precision application equipment, variable rate technologies, and soil monitoring systems while maintaining organic production practices and managing input investment costs effectively.
Comprehensive Product Offerings: Provide diverse organic fertilizer inventories covering plant-based materials, animal manures, and mineral amendments that enable organic farmers to access appropriate products without extensive supply chain management.
Technical Service Integration: Establish agronomic consultation services, soil testing support, and nutrient management planning assistance that ensure effective product utilization while supporting farmer operational requirements and organic certification compliance.
Certification Documentation Support: Create comprehensive material verification records, organic compliance certificates, and supplier audit documentation that facilitate farmer organic certification processes while minimizing administrative burdens.
Financial Access Facilitation: Offer seasonal payment programs, input financing options, and volume purchase arrangements that enable organic farmers to access quality inputs while managing cash flow constraints during production seasons.
Regional Distribution Networks: Develop strategically positioned distribution facilities, delivery services, and local pickup options that ensure timely product availability while minimizing transportation costs across farming regions.
Production Capacity Financing: Provide capital for organic fertilizer manufacturing facilities, processing technology upgrades, and capacity expansion initiatives that drive demand growth while supporting regional supply security and product availability.
Organic Transition Support: Finance farmer organic certification costs, transition period income support, and infrastructure investments that reduce conversion barriers while enhancing organic acreage expansion and organic fertilizer consumption growth.
Technology Innovation Support: Support organic fertilizer producers in implementing advanced processing systems, establishing microbial inoculation capabilities, and developing enhanced-efficiency formulations that improve competitiveness while ensuring product effectiveness.
Sustainable Agriculture Financing: Fund soil health improvement programs, conservation practice implementation, and organic farming development that enhance environmental performance while maintaining agricultural productivity and economic viability.
Emerging Application Development: Provide financing and technical assistance for controlled-environment organic production in emerging applications, creating new organic fertilizer consumption opportunities while supporting agricultural innovation and local food system development.
| Item | Value |
|---|---|
| Quantitative Units | USD 4.8 billion |
| Source | Plant-based (seaweed, soybean meal, molasses/green-manure, corn gluten/cottonseed meal, others), animal-based, mineral, microorganism, others |
| Crop Type | Cereals & grains (corn, wheat, rice/others), fruits & vegetables, oilseeds & pulses, others |
| Form | Dry fertilizer (pellets/granules, powders), liquid fertilizer |
| Nutrient Content | Up to 20%, 20% to 40% (balanced NPK, enriched organo-mineral), 40% to 60%, above 60% |
| Application | Farming (row crops, specialty crops, forage/turf), gardening |
| Countries Covered | United States, Canada, Mexico, Guatemala, Dominican Republic, Costa Rica, Honduras |
| Key Companies Profiled | The Scotts Miracle-Gro Company, Yara International ASA, True Organic Products Inc., Sustane Natural Fertilizer Inc., Wilbur-Ellis Holdings Inc., Verdesian Life Sciences LLC, Fertoz Ltd., Tessenderlo Group, American Plant Food Corporation, California Organic Fertilizers Inc. |
| Additional Attributes | Dollar sales by source material, crop type, formulation, nutrient content, and application segment, country demand trends across United States, Canada, Mexico, Guatemala, Dominican Republic, Costa Rica, and Honduras, competitive landscape with established North American manufacturers and organic input innovators, farmer preferences for plant-based versus animal-based versus mineral fertilizer formulations, integration with precision agriculture systems and biological soil amendments particularly advanced in United States and Canada, innovations in microbial inoculant technology and organo-mineral formulations, and adoption of soil health monitoring, regenerative agriculture practices, and comprehensive organic certification documentation for enhanced sustainability verification and organic system integrity across North American crop production operations |
The global demand for organic fertilizer in north america is estimated to be valued at USD 2.2 billion in 2025.
The market size for the demand for organic fertilizer in north america is projected to reach USD 4.8 billion by 2035.
The demand for organic fertilizer in north america is expected to grow at a 8.2% CAGR between 2025 and 2035.
The key product types in demand for organic fertilizer in north america are plant-based, animal-based, mineral, microorganism and others.
In terms of form, dry fertilizer segment to command 65.0% share in the demand for organic fertilizer in north america in 2025.


Our Research Products

The "Full Research Suite" delivers actionable market intel, deep dives on markets or technologies, so clients act faster, cut risk, and unlock growth.

The Leaderboard benchmarks and ranks top vendors, classifying them as Established Leaders, Leading Challengers, or Disruptors & Challengers.

Locates where complements amplify value and substitutes erode it, forecasting net impact by horizon

We deliver granular, decision-grade intel: market sizing, 5-year forecasts, pricing, adoption, usage, revenue, and operational KPIs—plus competitor tracking, regulation, and value chains—across 60 countries broadly.

Spot the shifts before they hit your P&L. We track inflection points, adoption curves, pricing moves, and ecosystem plays to show where demand is heading, why it is changing, and what to do next across high-growth markets and disruptive tech

Real-time reads of user behavior. We track shifting priorities, perceptions of today’s and next-gen services, and provider experience, then pace how fast tech moves from trial to adoption, blending buyer, consumer, and channel inputs with social signals (#WhySwitch, #UX).

Partner with our analyst team to build a custom report designed around your business priorities. From analysing market trends to assessing competitors or crafting bespoke datasets, we tailor insights to your needs.
Supplier Intelligence
Discovery & Profiling
Capacity & Footprint
Performance & Risk
Compliance & Governance
Commercial Readiness
Who Supplies Whom
Scorecards & Shortlists
Playbooks & Docs
Category Intelligence
Definition & Scope
Demand & Use Cases
Cost Drivers
Market Structure
Supply Chain Map
Trade & Policy
Operating Norms
Deliverables
Buyer Intelligence
Account Basics
Spend & Scope
Procurement Model
Vendor Requirements
Terms & Policies
Entry Strategy
Pain Points & Triggers
Outputs
Pricing Analysis
Benchmarks
Trends
Should-Cost
Indexation
Landed Cost
Commercial Terms
Deliverables
Brand Analysis
Positioning & Value Prop
Share & Presence
Customer Evidence
Go-to-Market
Digital & Reputation
Compliance & Trust
KPIs & Gaps
Outputs
Full Research Suite comprises of:
Market outlook & trends analysis
Interviews & case studies
Strategic recommendations
Vendor profiles & capabilities analysis
5-year forecasts
8 regions and 60+ country-level data splits
Market segment data splits
12 months of continuous data updates
DELIVERED AS:
PDF EXCEL ONLINE
Organic Fertilizer Industry Analysis in North America Analysis – Size, Share, and Forecast Outlook 2025 to 2035
North America Boat Trailer Market Size and Share Forecast Outlook 2025 to 2035
North America Cryogenic Label Printer Market Size and Share Forecast Outlook 2025 to 2035
North America Chitosan Market Size and Share Forecast Outlook 2025 to 2035
North America Underground Mining Vehicle Market Size and Share Forecast Outlook 2025 to 2035
North America Bulk Aseptic Packaging Market Size and Share Forecast Outlook 2025 to 2035
North America Licorice Extract Market Size and Share Forecast Outlook 2025 to 2035
North America Par Baked Bread Market Size and Share Forecast Outlook 2025 to 2035
North America Silo Bags Market Size and Share Forecast Outlook 2025 to 2035
North America Fresh Meat Packaging Market Size and Share Forecast Outlook 2025 to 2035
North America Ceramic Barbeque Grill Market Size and Share Forecast Outlook 2025 to 2035
North America Temperature Sensor Market Size and Share Forecast Outlook 2025 to 2035
North American Dietary Supplements Market Size and Share Forecast Outlook 2025 to 2035
North America Head-up Display Market Size and Share Forecast Outlook 2025 to 2035
North America, Europe & Asia Pacific Legal Cannabis Market Size and Share Forecast Outlook 2025 to 2035
North America Ceiling Cassette Market Size and Share Forecast Outlook 2025 to 2035
North America Pressure Regulating Valves Market Size and Share Forecast Outlook 2025 to 2035
North America Flame Retardant Thermoplastics Market Size and Share Forecast Outlook 2025 to 2035
Fire Pit Market Analysis in North America - Growth, Trends and Forecast from 2025 to 2035
North America Electrical Testing Services Market - Growth & Demand 2025 to 2035

Thank you!
You will receive an email from our Business Development Manager. Please be sure to check your SPAM/JUNK folder too.
Chat With
MaRIA