Flavoring Cosmetic Formulation Agents Market Size and Share Forecast Outlook 2025 to 2035

A valuation of USD 4,206.7 million is projected for the Flavoring Cosmetic Formulation Agents Market in 2025, which is expected to advance to USD 8,902.3 million by 2035. This represents an absolute increase of USD 4,695.6 million, nearly doubling the market size over the decade. Growth across this period translates into a CAGR of 7.8%, underscoring the sustained demand for functional and clean-label formulations.
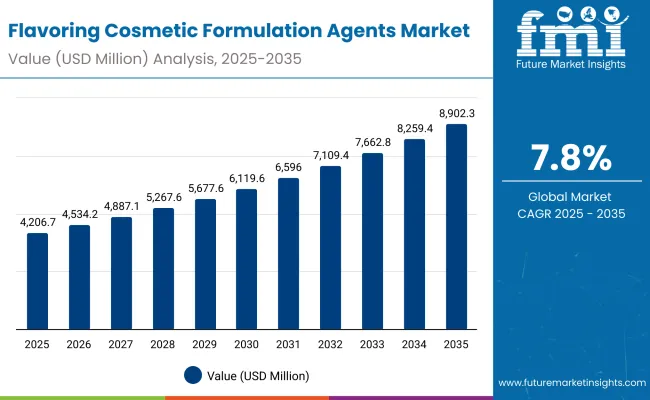
Quick Stats for Flavoring Cosmetic Formulation Agents Market

  • Flavoring Cosmetic Formulation Agents Market Value (2025): USD 4,206.7 Million
  • Flavoring Cosmetic Formulation Agents Market Forecast Value (2035): USD 8,902.3 Million
  • Flavoring Cosmetic Formulation Agents Market Forecast CAGR (2025 to 2035): 7.8%
  • Leading Segment in Flavoring Cosmetic Formulation Agents Market in 2025: Natural Flavors (44.3%)
  • Key Growth Regions in the Flavoring Cosmetic Formulation Agents Market: North America, Asia-Pacific, Europe
  • Top Key Players in the Flavoring Cosmetic Formulation Agents Market: Givaudan, Firmenich (DSM-Firmenich), Symrise, Takasago, Mane, IFF, Sensient, Robertet, Kerry, Bell Flavors & Fragrances

Flavoring Cosmetic Formulation Agents Market

Flavoring Cosmetic Formulation Agents MarketKey Takeaways

Metric Value
Flavoring Cosmetic Formulation Agents Market Estimated Value in (2025E) USD 4,206.7 Million
Flavoring Cosmetic Formulation Agents Market Forecast Value in (2035F) USD 8,902.3 Million
Forecast CAGR (2025 to 2035) 7.80%

Between 2025 and 2030, the market is expected to expand from USD 4,206.7 million to USD 6,119.6 million, reflecting an addition of USD 1,912.9 million that accounts for more than 40% of total growth. This phase will be characterized by rising consumption in oral care and medicated balm categories, where flavor innovation is increasingly used to strengthen compliance and product appeal.

Natural flavors are forecast to dominate with 44.3% of market share in 2025, while oral care applications are anticipated to lead with 39.6%, reaffirming the role of flavor as a driver of consumer loyalty.

From 2030 to 2035, an additional USD 2,782.7 million is expected to be generated, equating to nearly 60% of total growth. This acceleration will be powered by nutracosmetic expansion and enhanced adoption of flavored delivery systems such as beauty gummies.

Liquid formats are projected to remain the leading form with 51.7% share in 2025, sustained by their compatibility with diverse applications. With Asia-Pacific markets such as China and India demonstrating double-digit CAGRs, regional contributions are expected to intensify, reinforcing global market momentum through 2035.

From 2020 to 2024, steady adoption of flavoring solutions was observed across oral care and personal care categories, driven by the rising demand for natural and nature-identical formulations. During this phase, leading players captured strong positions through innovation pipelines and regional expansion, with Europe and North America providing mature demand while Asia-Pacific markets accelerated uptake. Competitive advantages were established through diversified product portfolios and consistent investments in natural ingredient sourcing.

By 2025, the market is expected to reach USD 4,206.7 million, supported by the growth of oral care applications that account for 39.6% share. Looking ahead to 2035, the market is forecast to double to USD 8,902.3 million, with expansion anchored by nutracosmetic adoption and the rising role of liquid formats that already dominate with 51.7% share.

Competitive strategies will increasingly shift toward localized innovation, AI-driven formulation support, and partnerships with nutracosmetic and personal care brands. The focus is expected to transition from ingredient supply alone to ecosystem-based solutions that deliver enhanced consumer experiences.

Why the Flavoring Cosmetic Formulation Agents Market is growing?

The growth of the Flavoring Cosmetic Formulation Agents Market is being driven by evolving consumer preferences and increasing demand for functional formulations. Rising interest in natural and nature-identical ingredients has been observed, as clean-label positioning and regulatory scrutiny encourage a shift away from synthetic options. In oral care, flavoring agents are being adopted to improve product compliance and enhance user experience, while lip care and medicated balms are benefitting from flavor-led differentiation.

Nutracosmetic products such as beauty gummies are also gaining traction, as flavor is leveraged to elevate consumer acceptance of ingestible formats. Technological advancements in flavor extraction and formulation have enabled higher stability, extended shelf life, and improved versatility, further supporting widespread adoption.

Regional growth is being powered by Asia-Pacific markets, where double-digit CAGRs are expected due to expanding middle-class consumption and localized innovation. Overall, market expansion is anticipated to be reinforced by cross-category application, innovation pipelines, and evolving health-and-wellness trends.

Segmental Analysis

The Flavoring Cosmetic Formulation Agents Market has been structured across type, application, and form, each presenting unique growth dynamics. By type, natural flavors are projected to hold the leading position with a 44.3% share in 2025, reflecting the strong shift toward clean-label and health-oriented products.

Within applications, the “Others” category, which includes lip care, medicated balms, and nutracosmetics, is expected to dominate with 60.4% share, underscoring the broadening use of flavoring agents in wellness-driven and lifestyle formulations.

In terms of form, liquid solutions are anticipated to account for the largest share of 51.7% in 2025, highlighting their adaptability, stability, and ease of integration in both oral care and nutracosmetic products. These dominant categories will continue to shape innovation strategies, anchoring the market’s forward trajectory through 2035.
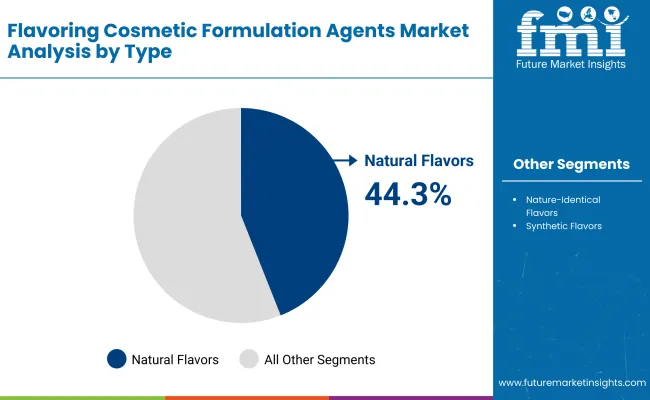
Insights into the Type Segment with Natural Flavors Leading in Market Share

Flavoring Cosmetic Formulation Agents Market By Type

Type Market Value Share, 2025
Natural flavors 44.3%
Others 55.7%

Natural flavors are projected to dominate the type segment with 44.3% share in 2025, equating to USD 1,863.57 million. Growth in this category is being reinforced by the global shift toward clean-label and health-conscious formulations, where natural ingredients are prioritized for consumer trust and regulatory compliance. Oral care, lip care, and nutracosmetic applications are increasingly relying on natural flavors to differentiate products and enhance user experience.

Regulatory favorability in key markets such as North America and Europe is expected to further strengthen adoption. While the “Others” category remains larger in absolute value, natural flavors will represent the most strategic growth avenue as brands align with transparency, sustainability, and consumer-driven demand for authenticity in taste solutions.
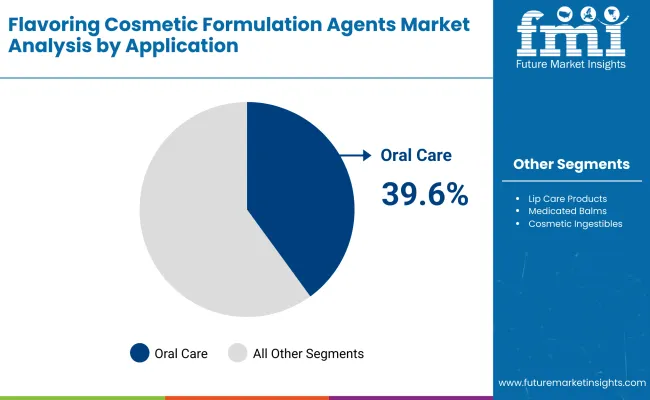
Insights into the Application Segment with Others Dominating the Demand

Flavoring Cosmetic Formulation Agents Market By Application

Application Market Value Share, 2025
Oral care 39.6%
Others 60.4%

The “Others” category in applications is anticipated to dominate with 60.4% share in 2025, worth USD 2,540.85 million, while oral care contributes 39.6% or USD 1,665.85 million. Lip care, medicated balms, and nutracosmetics are fueling this leadership, with flavoring agents being adopted to enhance consumer compliance and product differentiation.

Nutracosmetic innovations such as beauty gummies are expanding rapidly as flavor becomes integral to consumer acceptance and repeat purchases. Medicated and therapeutic lip care products are also increasingly flavor-driven, reinforcing adoption.

While oral care retains importance, the broader “Others” category showcases higher adaptability to emerging wellness and lifestyle preferences. This leadership reflects the evolving role of flavoring agents in extending far beyond traditional oral hygiene categories.
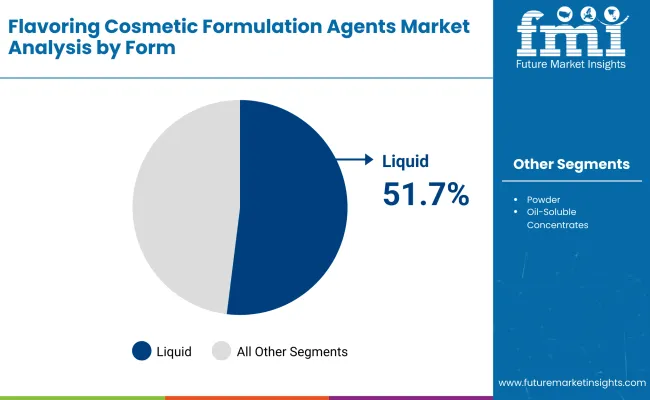
Insights into the Form Segment with Liquid Leading in Market Share

Flavoring Cosmetic Formulation Agents Market By Form

Form Market Value Share, 2025
Liquid 51.7%
Others 48.3%

Liquid formulations are anticipated to dominate the form segment, holding 51.7% share in 2025 with USD 2,174.86 million in sales. Liquids are widely favored due to their high solubility, stability, and ease of incorporation into oral care and nutracosmetic applications. Their compatibility with diverse flavor delivery systems allows for consistent performance in toothpaste, mouthwash, and functional beauty products.

Manufacturers are prioritizing liquid flavor solutions for their efficiency in scaling production and ensuring uniform distribution in formulations. While other formats such as powders and oil-soluble concentrates account for 48.3%, liquid formulations will remain the backbone of the market. The continued preference for liquid solutions reflects their versatility and alignment with innovation pipelines focused on wellness and consumer convenience.

What are the Drivers, Restraints, and Key Trends of the Flavoring Cosmetic Formulation Agents Market?

Despite significant opportunities, the Flavoring Cosmetic Formulation Agents Market is shaped by complex dynamics where cost pressures, regulatory frameworks, and consumer health priorities converge. While innovation accelerates adoption in oral and nutracosmetic applications, challenges persist around compliance, sourcing, and evolving sensory expectations.

Integration of Flavor Science with Functional Wellness

The convergence of flavoring agents with functional wellness solutions is being emphasized as a critical growth driver. Flavor compounds are no longer positioned solely as sensory enhancers but as enablers of adherence in therapeutic oral care and nutracosmetic categories.

The incorporation of scientifically validated, bioactive-compatible flavor systems is allowing manufacturers to expand into health-linked applications where palatability defines product acceptance. By aligning flavor development with clinical research and wellness positioning, long-term partnerships between ingredient suppliers and consumer brands are being fostered. This integration is expected to elevate market credibility, differentiating premium formulations while sustaining consumer trust in wellness-oriented products.

Volatility in Natural Ingredient Supply Chains

A persistent restraint is being observed in the volatility of natural ingredient supply chains, particularly for botanical and plant-derived sources. Seasonal disruptions, regional agricultural dependencies, and sustainability concerns create pricing instability and limit scalability for natural flavors.

Compliance-driven reliance on authenticated sourcing further intensifies exposure to fluctuations in crop yields, transportation constraints, and environmental regulations. As consumer preference shifts toward clean-label formulations, reliance on natural flavors amplifies vulnerability to these challenges.

Strategic investment in resilient supply models, controlled cultivation, and biotech-driven alternatives will be required to overcome these constraints. Without such measures, inconsistent availability of natural raw materials may hinder growth momentum in the decade ahead.
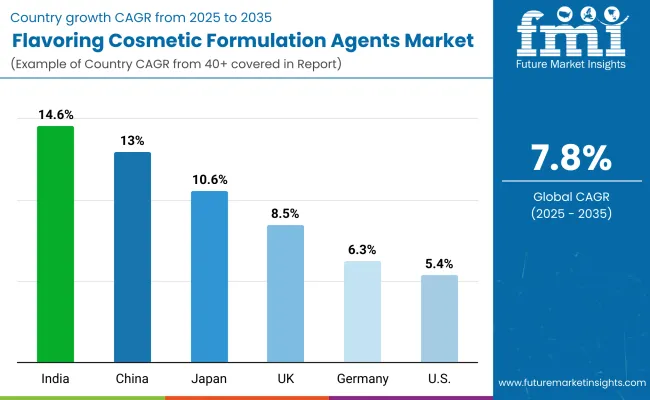
Analysis of Flavoring Cosmetic Formulation Agents Market By Key Countries

Flavoring Cosmetic Formulation Agents Market By Country

Country CAGR
China 13.0%
USA 5.4%
India 14.6%
UK 8.5%
Germany 6.3%
Japan 10.6%

The global Flavoring Cosmetic Formulation Agents Market is projected to expand at varying growth trajectories across key countries, influenced by consumer health priorities, regulatory frameworks, and regional innovation ecosystems.

Asia-Pacific is expected to emerge as the fastest-growing hub, anchored by India at a remarkable 14.6% CAGR and China at 13.0% CAGR through 2035. India’s momentum will be shaped by its expanding nutracosmetic sector, rising disposable incomes, and cost-competitive manufacturing that accelerates flavored product penetration across oral care and wellness brands. China is expected to strengthen its position through large-scale production capabilities and a growing middle-class preference for premium flavored personal care products.

Japan is forecast to grow at 10.6% CAGR, supported by advanced R&D integration and a strong heritage in functional beauty formulations. In Europe, moderate but steady growth is anticipated, led by the UK at 8.5% CAGR and Germany at 6.3%, where regulatory compliance and consumer preference for natural flavors reinforce market stability.

Europe overall is projected at 7.9% CAGR, highlighting resilience in a mature but innovation-driven market. By contrast, the USA is expected to record a slower 5.4% CAGR due to market maturity, though opportunities will be fostered by demand for sustainable and natural ingredient portfolios.
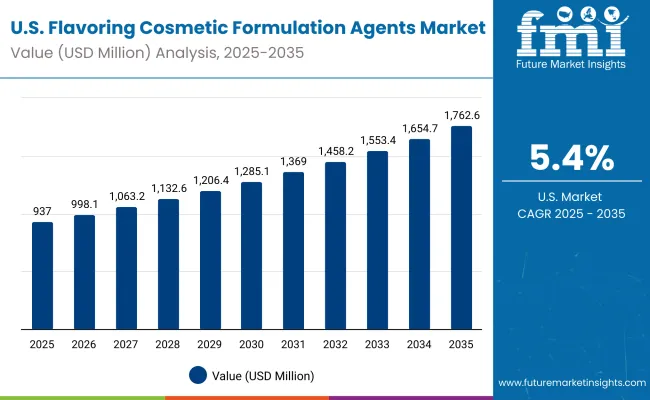
Sales Outlook for Flavoring Agents In the United States

United States Flavoring Cosmetic Formulation Agents Market

Year USA Flavoring Cosmetic Formulation Agents Market (USD Million)
2025 937.04
2026 998.16
2027 1063.26
2028 1132.61
2029 1206.49
2030 1285.18
2031 1369.00
2032 1458.29
2033 1553.41
2034 1654.73
2035 1762.66

The Flavoring Cosmetic Formulation Agents Market in the United States is projected to expand at a CAGR of 6.6% between 2025 and 2035. Growth will be shaped by the integration of natural and functional flavor systems into oral care, lip care, and nutracosmetic products.

Regulatory-driven preference for clean-label solutions is expected to amplify adoption, while innovation pipelines will continue to favor liquid and natural formulations. Industry leaders are anticipated to strengthen partnerships with nutracosmetic and personal care manufacturers to accelerate flavor-driven differentiation.

  • Oral care products are anticipated to remain a major contributor to sustained adoption of flavoring agents.
  • Nutracosmetic brands are integrating advanced flavor systems to enhance consumer compliance and repeat purchase behavior.
  • Liquid-based formulations are being prioritized by manufacturers for ease of incorporation and superior product stability.

Growth and Expansion Outlook for Flavoring Cosmetic Formulation Agents Marketin the United Kingdom

The Flavoring Cosmetic Formulation Agents Market in the United Kingdom is projected to grow at a CAGR of 8.5% between 2025 and 2035. Expansion will be reinforced by increasing alignment with sustainability targets and consumer preference for natural formulations. Regulatory frameworks encouraging transparency in ingredient sourcing are anticipated to accelerate the shift toward clean-label flavor systems. Premiumization trends in oral care and nutracosmetic products will also shape innovation strategies in the region.

  • Clean-label mandates are fostering demand for natural flavor systems across personal care portfolios.
  • Nutracosmetic brands are expected to leverage flavoring agents for differentiation in beauty-from-within formats.
  • Oral care companies are incorporating advanced flavor systems to sustain consumer compliance.
  • Local innovation centers are being utilized to create formulations suited to evolving European consumer preferences.

Growth and Expansion Outlook for Flavoring Cosmetic Formulation Agents Marketin India

The Flavoring Cosmetic Formulation Agents Market in India is projected to grow at a CAGR of 14.6% between 2025 and 2035. Growth will be fueled by rapid expansion in nutracosmetics, functional personal care, and cost-efficient manufacturing. Rising disposable incomes and a growing middle class are expected to boost consumption of flavored health and beauty products. India’s positioning as a key manufacturing hub is anticipated to support export opportunities for regional players.

  • Nutracosmetics such as flavored gummies are driving acceptance of beauty-from-within solutions.
  • Large-scale manufacturing capabilities are positioning India as a global supplier for flavor-infused products.
  • Regulatory flexibility and cost competitiveness are reinforcing demand for diverse flavor systems.
  • Domestic and global brands are forming partnerships to capture growth across both premium and mass-market categories.

Sales Outlook for Flavoring Agents In China

The Flavoring Cosmetic Formulation Agents Market in China is projected to grow at a CAGR of 13.0% between 2025 and 2035. Expansion will be propelled by a rapidly expanding middle class, premiumization in personal care, and increasing demand for functional wellness products. Government initiatives to strengthen domestic ingredient supply chains are also anticipated to reduce dependency on imports.
  • Premium oral care and nutracosmetic segments are driving higher penetration of natural flavor systems.
  • Domestic production is being scaled to ensure stable supply and competitive pricing in the region.
  • Partnerships with international players are fostering innovation in natural and functional flavors.
  • Rising consumer awareness of product safety and quality is shaping demand for transparent, clean-label offerings.

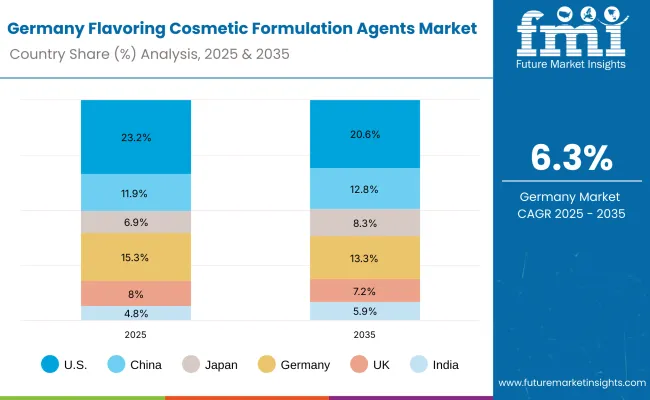
In-depth Analysis of Flavoring Agents In Germany

Germany Flavoring Cosmetic Formulation Agents Market

Country 2025
USA 23.2%
China 11.9%
Japan 6.9%
Germany 15.3%
UK 8.0%
India 4.8%
Country 2035
USA 20.6%
China 12.8%
Japan 8.3%
Germany 13.3%
UK 7.2%
India 5.9%

The Flavoring Cosmetic Formulation Agents Market in Germany is projected to grow at a CAGR of 6.3% between 2025 and 2035. Market expansion will be shaped by strong regulatory frameworks, consumer preference for sustainability, and the dominance of clean-label trends. Manufacturers are expected to prioritize high-quality, traceable flavor systems aligned with EU standards.
  • Strict compliance requirements are reinforcing trust in natural and authenticated flavor systems.
  • Oral care and medicated balm brands are relying on advanced flavor solutions to enhance consumer loyalty.
  • German nutracosmetic producers are incorporating flavoring agents to strengthen brand differentiation.
  • Sustainability commitments are accelerating adoption of plant-derived and bioengineered flavor alternatives.

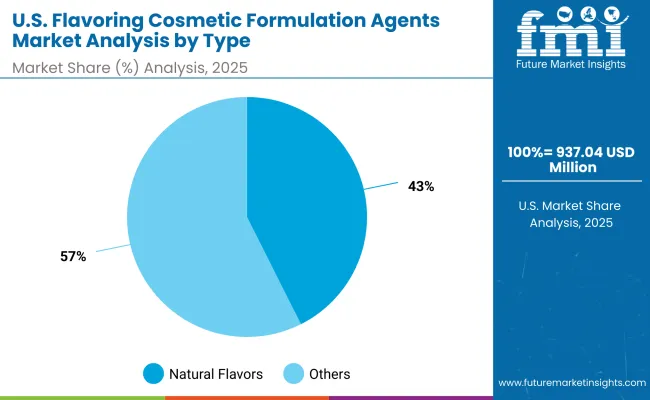
Growth Outlook for Flavoring Cosmetic Formulation Agents Marketin USA

Usa Flavoring Cosmetic Formulation Agents Market

USA By Type Market Value Share, 2025
Natural flavors 42.6%
Others 57.4%

The Flavoring Cosmetic Formulation Agents Market in the United States is projected at USD 937.04 million in 2025. “Others” contribute 57.4%, while natural flavors account for 42.6%, highlighting the dominant role of broader categories including nature-identical and synthetic flavors. This structural lead reflects the entrenched use of cost-efficient formulations across oral care, lip care, and functional wellness products, where stability and scalability are prioritized.

However, the notable share of natural flavors signals a decisive consumer shift toward clean-label and transparent sourcing. As compliance frameworks strengthen and sustainability gains prominence, natural flavors are expected to steadily increase their contribution.

Strategic emphasis will likely shift toward balancing affordability with authenticity, supported by localized innovation hubs and biotech-enabled ingredient development. The interplay between value-driven “Others” and consumer-trusted natural flavors will define the USA growth trajectory.
  • Market in the USA valued at USD 937.04 million in 2025.
  • “Others” lead with 57.4% vs. 42.6% for natural flavors.
  • Growth is shaped by cost efficiency alongside rising clean-label priorities.
  • Natural flavor innovation is expected to reinforce future competitive positioning.

Opportunity Analysis of China Flavoring Cosmetic Formulation Agents Market

China Flavoring Cosmetic Formulation Agents Market

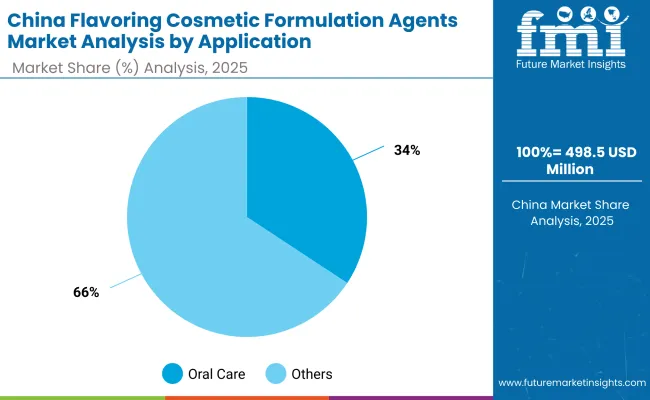
China By Application Market Value Share, 2025
Oral care 34.3%
Others 65.7%

The Flavoring Cosmetic Formulation Agents Market in China is projected at USD 498.58 million in 2025. “Others” dominate with 65.7%, while oral care applications contribute 34.3%, reflecting the country’s diversified adoption across lip care, medicated balms, and nutracosmetic categories. This leadership underscores how lifestyle-driven consumption and the popularity of beauty-from-within products are shaping the market.

Oral care remains a significant contributor, with flavoring agents being integrated into toothpaste and mouthwash to improve user compliance and sensory appeal. However, the broader “Others” category reflects stronger momentum as functional wellness, beauty innovation, and therapeutic applications expand rapidly. The interplay between these segments will define China’s growth path, where domestic innovation and global partnerships are expected to accelerate scaling opportunities.
  • Market in China projected at USD 498.58 million in 2025.
  • “Others” dominate with 65.7% vs. 34.3% for oral care.
  • Growth supported by rising demand in nutracosmetics and functional wellness.
  • Oral care remains significant for maintaining compliance and consumer trust.

Competitive Landscape of Flavoring Cosmetic Formulation Agents Market

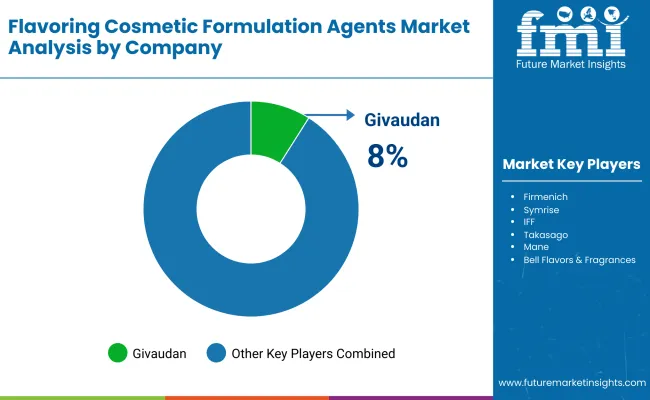
Flavoring Cosmetic Formulation Agents Market By Company

Company Global Value Share 2025
Givaudan 8.0%
Others 92.0%

The Flavoring Cosmetic Formulation Agents Market is moderately fragmented, with global leaders, regional innovators, and niche-focused players competing across oral care, lip care, and nutracosmetic applications. Global ingredient leaders such as Givaudan, Firmenich (DSM-Firmenich), Symrise, IFF, Takasago, Mane, Sensient, Robertet, Kerry, and Bell Flavors & Fragrances hold strong positions due to broad product portfolios, advanced R&D, and global reach.

Among these, Givaudan is the clear leader, capturing 8.0% of global value share in 2025, while the remaining 92.0% is distributed across other players. This leadership is reinforced by Givaudan’s investments in natural and nature-identical flavor systems, which are aligned with clean-label and wellness-driven demand.

Mid-sized companies such as Takasago, Mane, and Sensient are increasingly emphasizing specialization in regional markets, supported by agile innovation and localized production capacities. These players are expected to strengthen their positions by focusing on niche segments such as nutracosmetics and functional lip care.

Smaller, specialized firms including Robertet and Bell Flavors & Fragrances are prioritizing customized flavor solutions, highlighting adaptability to regional consumer trends. Competitive differentiation is shifting from pure flavor portfolios to integrated solutions that combine natural sourcing, biotech-driven innovation, and sustainability-focused supply chains. Strategic collaborations and acquisitions are anticipated to accelerate, as players seek stronger footholds in fast-growing regions such as Asia-Pacific.

Key Developments in Flavoring Cosmetic Formulation Agents Market

  • On February 5, 2025, Sensapure Flavors introduced its OMVE pilot plant for Flavoring Agents.The facility was designed to accelerate small-batch innovation, enabling rapid prototyping of natural flavor systems. Industry experts highlighted it as a major step in bridging lab-scale formulation with commercial beverage applications.
  • On February 13, 2025, researchers published TastePepAI as an AI-driven tool for Flavoring Agents. The framework allowed de novo design of taste peptides, integrating toxicity prediction for safer flavor development. Analysts described it as a breakthrough for precision-based flavor discovery, redefining how natural taste solutions are engineered globally.

Scope of the Report

Item Value
Quantitative Units USD 4,206.7 Million (2025E); USD 8,902.3 Million (2035F)
Type Natural Flavors, Nature-identical Flavors, Synthetic Flavors
Application Oral Care, Lip Care Products, Medicated Balms, Cosmetic Ingestibles (Beauty Gummies)
Form Liquid, Powder, Oil-soluble Concentrates
End-use Industry Oral Care Brands, Lip Care Manufacturers, Nutracosmetic Producers
Regions Covered North America, Europe, East Asia, South Asia & Pacific, Latin America, Middle East & Africa
Countries Covered United States, Canada, Germany, France, United Kingdom, China, Japan, India, Brazil, South Africa
Key Companies Profiled Givaudan, Firmenich (DSM-Firmenich), Symrise, IFF, Takasago, Mane, Sensient, Robertet, Kerry, Bell Flavors & Fragrances
Additional Attributes Market share by type, application, and form; adoption trends in nutracosmetics and oral care; increasing demand for natural and clean-label flavors; technological advances in liquid formulations; regional growth led by Asia-Pacific; competitive focus on sustainability and biotech-enabled flavor solutions

Key Segments

By Type:

  • Natural flavors
  • Nature-identical
  • Synthetic flavors

By Application:

  • Oral care (toothpaste, mouthwash)
  • Lip care products
  • Medicated balms
  • Cosmetic ingestibles (beauty gummies)

By Form:

  • Liquid
  • Powder
  • Oil-soluble concentrates

By End Use:

  • Oral care brands
  • Lip care manufacturers
  • Nutracosmetic producers

By Region:

  • North America
  • Latin America
  • Europe
  • East Asia
  • South Asia & Pacific
  • Middle East and Africa

Table of Content

  1. Executive Summary
    • Global Market Outlook
    • Demand-side Trends
    • Supply-side Trends
    • Technology Roadmap Analysis
    • Analysis and Recommendations
  2. Market Overview
    • Market Coverage / Taxonomy
    • Market Definition / Scope / Limitations
  3. Market Background
    • Market Dynamics
      • Drivers
      • Restraints
      • Opportunity
      • Trends
    • Scenario Forecast
      • Demand in Optimistic Scenario
      • Demand in Likely Scenario
      • Demand in Conservative Scenario
    • Opportunity Map Analysis
    • Product Life Cycle Analysis
    • Supply Chain Analysis
      • Supply Side Participants and their Roles
        • Producers
        • Mid-Level Participants (Traders/ Agents/ Brokers)
        • Wholesalers and Distributors
      • Value Added and Value Created at Node in the Supply Chain
      • List of Raw Material Suppliers
      • List of Existing and Potential Buyer’s
    • Investment Feasibility Matrix
    • Value Chain Analysis
      • Profit Margin Analysis
      • Wholesalers and Distributors
      • Retailers
    • PESTLE and Porter’s Analysis
    • Regulatory Landscape
      • By Key Regions
      • By Key Countries
    • Regional Parent Market Outlook
    • Production and Consumption Statistics
    • Import and Export Statistics
  4. Global Market Analysis 2020 to 2024 and Forecast, 2025 to 2035
    • Historical Market Size Value (USD Million) & Volume (Units) Analysis, 2020 to 2024
    • Current and Future Market Size Value (USD Million) & Volume (Units) Projections, 2025 to 2035
      • Y-o-Y Growth Trend Analysis
      • Absolute $ Opportunity Analysis
  5. Global Market Analysis 2020 to 2024 and Forecast 2025 to 2035, By Type
    • Introduction / Key Findings
    • Historical Market Size Value (USD Million) & Volume (Units) Analysis By Type, 2020 to 2024
    • Current and Future Market Size Value (USD Million) & Volume (Units) Analysis and Forecast By Type, 2025 to 2035
      • Natural flavors
      • Nature-identical
      • Synthetic flavors
    • Y-o-Y Growth Trend Analysis By Type, 2020 to 2024
    • Absolute $ Opportunity Analysis By Type, 2025 to 2035
  6. Global Market Analysis 2020 to 2024 and Forecast 2025 to 2035, By Application
    • Introduction / Key Findings
    • Historical Market Size Value (USD Million) & Volume (Units) Analysis By Application, 2020 to 2024
    • Current and Future Market Size Value (USD Million) & Volume (Units) Analysis and Forecast By Application, 2025 to 2035
      • Oral care (toothpaste, mouthwash)
      • Lip care products
      • Medicated balms
      • Cosmetic ingestibles (beauty gummies)
    • Y-o-Y Growth Trend Analysis By Application, 2020 to 2024
    • Absolute $ Opportunity Analysis By Application, 2025 to 2035
  7. Global Market Analysis 2020 to 2024 and Forecast 2025 to 2035, By Form
    • Introduction / Key Findings
    • Historical Market Size Value (USD Million) & Volume (Units) Analysis By Form, 2020 to 2024
    • Current and Future Market Size Value (USD Million) & Volume (Units) Analysis and Forecast By Form, 2025 to 2035
      • Liquid
      • Powder
      • Oil-soluble concentrates
    • Y-o-Y Growth Trend Analysis By Form, 2020 to 2024
    • Absolute $ Opportunity Analysis By Form, 2025 to 2035
  8. Global Market Analysis 2020 to 2024 and Forecast 2025 to 2035, By End Use
    • Introduction / Key Findings
    • Historical Market Size Value (USD Million) & Volume (Units) Analysis By End Use, 2020 to 2024
    • Current and Future Market Size Value (USD Million) & Volume (Units) Analysis and Forecast By End Use, 2025 to 2035
      • Oral care brands
      • Lip care manufacturers
      • Nutracosmetic producers
    • Y-o-Y Growth Trend Analysis By End Use, 2020 to 2024
    • Absolute $ Opportunity Analysis By End Use, 2025 to 2035
  9. Global Market Analysis 2020 to 2024 and Forecast 2025 to 2035, By Region
    • Introduction
    • Historical Market Size Value (USD Million) & Volume (Units) Analysis By Region, 2020 to 2024
    • Current Market Size Value (USD Million) & Volume (Units) Analysis and Forecast By Region, 2025 to 2035
      • North America
      • Latin America
      • Europe
      • East Asia
      • South Asia & Pacific
      • Middle East and Africa
    • Market Attractiveness Analysis By Region
  10. North America Market Analysis 2020 to 2024 and Forecast 2025 to 2035, By Country
    • Historical Market Size Value (USD Million) & Volume (Units) Trend Analysis By Market Taxonomy, 2020 to 2024
    • Market Size Value (USD Million) & Volume (Units) Forecast By Market Taxonomy, 2025 to 2035
      • By Country
        • USA
        • Canada
      • By Type
      • By Application
      • By Form
      • By End Use
    • Market Attractiveness Analysis
      • By Country
      • By Type
      • By Application
      • By Form
      • By End Use
    • Key Takeaways
  11. Latin America Market Analysis 2020 to 2024 and Forecast 2025 to 2035, By Country
    • Historical Market Size Value (USD Million) & Volume (Units) Trend Analysis By Market Taxonomy, 2020 to 2024
    • Market Size Value (USD Million) & Volume (Units) Forecast By Market Taxonomy, 2025 to 2035
      • By Country
        • Brazil
        • Mexico
        • Colombia
        • Rest of Latin America
      • By Type
      • By Application
      • By Form
      • By End Use
    • Market Attractiveness Analysis
      • By Country
      • By Type
      • By Application
      • By Form
      • By End Use
    • Key Takeaways
  12. Europe Market Analysis 2020 to 2024 and Forecast 2025 to 2035, By Country
    • Historical Market Size Value (USD Million) & Volume (Units) Trend Analysis By Market Taxonomy, 2020 to 2024
    • Market Size Value (USD Million) & Volume (Units) Forecast By Market Taxonomy, 2025 to 2035
      • By Country
        • Germany
        • UK
        • France
        • Italy
        • Spain
        • Belgium
        • Netherlands
        • Nordic
        • Switzerland
        • Russia
        • Poland
        • Rest of Europe
      • By Type
      • By Application
      • By Form
      • By End Use
    • Market Attractiveness Analysis
      • By Country
      • By Type
      • By Application
      • By Form
      • By End Use
    • Key Takeaways
  13. East Asia Market Analysis 2020 to 2024 and Forecast 2025 to 2035, By Country
    • Historical Market Size Value (USD Million) & Volume (Units) Trend Analysis By Market Taxonomy, 2020 to 2024
    • Market Size Value (USD Million) & Volume (Units) Forecast By Market Taxonomy, 2025 to 2035
      • By Country
        • China
        • Japan
        • South Korea
      • By Type
      • By Application
      • By Form
      • By End Use
    • Market Attractiveness Analysis
      • By Country
      • By Type
      • By Application
      • By Form
      • By End Use
    • Key Takeaways
  14. South Asia & Pacific Market Analysis 2020 to 2024 and Forecast 2025 to 2035, By Country
    • Historical Market Size Value (USD Million) & Volume (Units) Trend Analysis By Market Taxonomy, 2020 to 2024
    • Market Size Value (USD Million) & Volume (Units) Forecast By Market Taxonomy, 2025 to 2035
      • By Country
        • India
        • Thailand
        • Malaysia
        • Indonesia
        • Singapore
        • Vietnam
        • Australia
        • New Zealand
        • Rest of South Asia
      • By Type
      • By Application
      • By Form
      • By End Use
    • Market Attractiveness Analysis
      • By Country
      • By Type
      • By Application
      • By Form
      • By End Use
    • Key Takeaways
  15. Middle East and Africa Market Analysis 2020 to 2024 and Forecast 2025 to 2035, By Country
    • Historical Market Size Value (USD Million) & Volume (Units) Trend Analysis By Market Taxonomy, 2020 to 2024
    • Market Size Value (USD Million) & Volume (Units) Forecast By Market Taxonomy, 2025 to 2035
      • By Country
        • Turkey
        • UAE
        • Saudi Arabia
        • Israel
        • Other GCC Countries
        • North Africa
        • South Africa
      • By Type
      • By Application
      • By Form
      • By End Use
    • Market Attractiveness Analysis
      • By Country
      • By Type
      • By Application
      • By Form
      • By End Use
    • Key Takeaways
  16. Key Countries Market Analysis
    • USA
      • Pricing Analysis
      • Market Share Analysis, 2024
        • By Type
        • By Application
        • By Form
        • By End Use
    • Canada
      • Pricing Analysis
      • Market Share Analysis, 2024
        • By Type
        • By Application
        • By Form
        • By End Use
    • Brazil
      • Pricing Analysis
      • Market Share Analysis, 2024
        • By Type
        • By Application
        • By Form
        • By End Use
    • Mexico
      • Pricing Analysis
      • Market Share Analysis, 2024
        • By Type
        • By Application
        • By Form
        • By End Use
    • Colombia
      • Pricing Analysis
      • Market Share Analysis, 2024
        • By Type
        • By Application
        • By Form
        • By End Use
    • Germany
      • Pricing Analysis
      • Market Share Analysis, 2024
        • By Type
        • By Application
        • By Form
        • By End Use
    • UK
      • Pricing Analysis
      • Market Share Analysis, 2024
        • By Type
        • By Application
        • By Form
        • By End Use
    • France
      • Pricing Analysis
      • Market Share Analysis, 2024
        • By Type
        • By Application
        • By Form
        • By End Use
    • Italy
      • Pricing Analysis
      • Market Share Analysis, 2024
        • By Type
        • By Application
        • By Form
        • By End Use
    • Spain
      • Pricing Analysis
      • Market Share Analysis, 2024
        • By Type
        • By Application
        • By Form
        • By End Use
    • Belgium
      • Pricing Analysis
      • Market Share Analysis, 2024
        • By Type
        • By Application
        • By Form
        • By End Use
    • Netherlands
      • Pricing Analysis
      • Market Share Analysis, 2024
        • By Type
        • By Application
        • By Form
        • By End Use
    • Nordic
      • Pricing Analysis
      • Market Share Analysis, 2024
        • By Type
        • By Application
        • By Form
        • By End Use
    • Switzerland
      • Pricing Analysis
      • Market Share Analysis, 2024
        • By Type
        • By Application
        • By Form
        • By End Use
    • Russia
      • Pricing Analysis
      • Market Share Analysis, 2024
        • By Type
        • By Application
        • By Form
        • By End Use
    • Poland
      • Pricing Analysis
      • Market Share Analysis, 2024
        • By Type
        • By Application
        • By Form
        • By End Use
    • China
      • Pricing Analysis
      • Market Share Analysis, 2024
        • By Type
        • By Application
        • By Form
        • By End Use
    • Japan
      • Pricing Analysis
      • Market Share Analysis, 2024
        • By Type
        • By Application
        • By Form
        • By End Use
    • South Korea
      • Pricing Analysis
      • Market Share Analysis, 2024
        • By Type
        • By Application
        • By Form
        • By End Use
    • India
      • Pricing Analysis
      • Market Share Analysis, 2024
        • By Type
        • By Application
        • By Form
        • By End Use
    • Thailand
      • Pricing Analysis
      • Market Share Analysis, 2024
        • By Type
        • By Application
        • By Form
        • By End Use
    • Indonesia
      • Pricing Analysis
      • Market Share Analysis, 2024
        • By Type
        • By Application
        • By Form
        • By End Use
    • Australia
      • Pricing Analysis
      • Market Share Analysis, 2024
        • By Type
        • By Application
        • By Form
        • By End Use
    • New Zealand
      • Pricing Analysis
      • Market Share Analysis, 2024
        • By Type
        • By Application
        • By Form
        • By End Use
    • Turkey
      • Pricing Analysis
      • Market Share Analysis, 2024
        • By Type
        • By Application
        • By Form
        • By End Use
    • UAE
      • Pricing Analysis
      • Market Share Analysis, 2024
        • By Type
        • By Application
        • By Form
        • By End Use
    • Saudi Arabia
      • Pricing Analysis
      • Market Share Analysis, 2024
        • By Type
        • By Application
        • By Form
        • By End Use
    • Israel
      • Pricing Analysis
      • Market Share Analysis, 2024
        • By Type
        • By Application
        • By Form
        • By End Use
    • North Africa
      • Pricing Analysis
      • Market Share Analysis, 2024
        • By Type
        • By Application
        • By Form
        • By End Use
    • South Africa
      • Pricing Analysis
      • Market Share Analysis, 2024
        • By Type
        • By Application
        • By Form
        • By End Use
  17. Market Structure Analysis
    • Competition Dashboard
    • Competition Benchmarking
    • Market Share Analysis of Top Players
      • By Regional
      • By Type
      • By Application
      • By Form
      • By End Use
  18. Competition Analysis
    • Competition Deep Dive
      • Givaudan
        • Overview
        • Product Portfolio
        • Profitability by Market Segments (Product/Age /Sales Channel/Region)
        • Sales Footprint
        • Strategy Overview
          • Marketing Strategy
          • Product Strategy
          • Channel Strategy
      • Firmenich (DSM-Firmenich)
        • Overview
        • Product Portfolio
        • Profitability by Market Segments (Product/Age /Sales Channel/Region)
        • Sales Footprint
        • Strategy Overview
          • Marketing Strategy
          • Product Strategy
          • Channel Strategy
      • Symrise
        • Overview
        • Product Portfolio
        • Profitability by Market Segments (Product/Age /Sales Channel/Region)
        • Sales Footprint
        • Strategy Overview
          • Marketing Strategy
          • Product Strategy
          • Channel Strategy
      • Takasago
        • Overview
        • Product Portfolio
        • Profitability by Market Segments (Product/Age /Sales Channel/Region)
        • Sales Footprint
        • Strategy Overview
          • Marketing Strategy
          • Product Strategy
          • Channel Strategy
      • Mane
        • Overview
        • Product Portfolio
        • Profitability by Market Segments (Product/Age /Sales Channel/Region)
        • Sales Footprint
        • Strategy Overview
          • Marketing Strategy
          • Product Strategy
          • Channel Strategy
      • IFF
        • Overview
        • Product Portfolio
        • Profitability by Market Segments (Product/Age /Sales Channel/Region)
        • Sales Footprint
        • Strategy Overview
          • Marketing Strategy
          • Product Strategy
          • Channel Strategy
      • Sensient
        • Overview
        • Product Portfolio
        • Profitability by Market Segments (Product/Age /Sales Channel/Region)
        • Sales Footprint
        • Strategy Overview
          • Marketing Strategy
          • Product Strategy
          • Channel Strategy
      • Robertet
        • Overview
        • Product Portfolio
        • Profitability by Market Segments (Product/Age /Sales Channel/Region)
        • Sales Footprint
        • Strategy Overview
          • Marketing Strategy
          • Product Strategy
          • Channel Strategy
      • Kerry
        • Overview
        • Product Portfolio
        • Profitability by Market Segments (Product/Age /Sales Channel/Region)
        • Sales Footprint
        • Strategy Overview
          • Marketing Strategy
          • Product Strategy
          • Channel Strategy
      • Bell Flavors & Fragrances
        • Overview
        • Product Portfolio
        • Profitability by Market Segments (Product/Age /Sales Channel/Region)
        • Sales Footprint
        • Strategy Overview
          • Marketing Strategy
          • Product Strategy
          • Channel Strategy
      • Others
        • Overview
        • Product Portfolio
        • Profitability by Market Segments (Product/Age /Sales Channel/Region)
        • Sales Footprint
        • Strategy Overview
          • Marketing Strategy
          • Product Strategy
          • Channel Strategy
  19. Assumptions & Acronyms Used
  20. Research Methodology

List of Tables

  • Table 1: Global Market Value (USD Million) Forecast by Region, 2020-2035
  • Table 2: Global Market Volume (Units) Forecast by Region, 2020-2035
  • Table 3: Global Market Value (USD Million) Forecast by Type, 2020-2035
  • Table 4: Global Market Volume (Units) Forecast by Type, 2020-2035
  • Table 5: Global Market Value (USD Million) Forecast by Application, 2020-2035
  • Table 6: Global Market Volume (Units) Forecast by Application, 2020-2035
  • Table 7: Global Market Value (USD Million) Forecast by Form, 2020-2035
  • Table 8: Global Market Volume (Units) Forecast by Form, 2020-2035
  • Table 9: Global Market Value (USD Million) Forecast by End Use, 2020-2035
  • Table 10: Global Market Volume (Units) Forecast by End Use, 2020-2035
  • Table 11: North America Market Value (USD Million) Forecast by Country, 2020-2035
  • Table 12: North America Market Volume (Units) Forecast by Country, 2020-2035
  • Table 13: North America Market Value (USD Million) Forecast by Type, 2020-2035
  • Table 14: North America Market Volume (Units) Forecast by Type, 2020-2035
  • Table 15: North America Market Value (USD Million) Forecast by Application, 2020-2035
  • Table 16: North America Market Volume (Units) Forecast by Application, 2020-2035
  • Table 17: North America Market Value (USD Million) Forecast by Form, 2020-2035
  • Table 18: North America Market Volume (Units) Forecast by Form, 2020-2035
  • Table 19: North America Market Value (USD Million) Forecast by End Use, 2020-2035
  • Table 20: North America Market Volume (Units) Forecast by End Use, 2020-2035
  • Table 21: Latin America Market Value (USD Million) Forecast by Country, 2020-2035
  • Table 22: Latin America Market Volume (Units) Forecast by Country, 2020-2035
  • Table 23: Latin America Market Value (USD Million) Forecast by Type, 2020-2035
  • Table 24: Latin America Market Volume (Units) Forecast by Type, 2020-2035
  • Table 25: Latin America Market Value (USD Million) Forecast by Application, 2020-2035
  • Table 26: Latin America Market Volume (Units) Forecast by Application, 2020-2035
  • Table 27: Latin America Market Value (USD Million) Forecast by Form, 2020-2035
  • Table 28: Latin America Market Volume (Units) Forecast by Form, 2020-2035
  • Table 29: Latin America Market Value (USD Million) Forecast by End Use, 2020-2035
  • Table 30: Latin America Market Volume (Units) Forecast by End Use, 2020-2035
  • Table 31: Europe Market Value (USD Million) Forecast by Country, 2020-2035
  • Table 32: Europe Market Volume (Units) Forecast by Country, 2020-2035
  • Table 33: Europe Market Value (USD Million) Forecast by Type, 2020-2035
  • Table 34: Europe Market Volume (Units) Forecast by Type, 2020-2035
  • Table 35: Europe Market Value (USD Million) Forecast by Application, 2020-2035
  • Table 36: Europe Market Volume (Units) Forecast by Application, 2020-2035
  • Table 37: Europe Market Value (USD Million) Forecast by Form, 2020-2035
  • Table 38: Europe Market Volume (Units) Forecast by Form, 2020-2035
  • Table 39: Europe Market Value (USD Million) Forecast by End Use, 2020-2035
  • Table 40: Europe Market Volume (Units) Forecast by End Use, 2020-2035
  • Table 41: East Asia Market Value (USD Million) Forecast by Country, 2020-2035
  • Table 42: East Asia Market Volume (Units) Forecast by Country, 2020-2035
  • Table 43: East Asia Market Value (USD Million) Forecast by Type, 2020-2035
  • Table 44: East Asia Market Volume (Units) Forecast by Type, 2020-2035
  • Table 45: East Asia Market Value (USD Million) Forecast by Application, 2020-2035
  • Table 46: East Asia Market Volume (Units) Forecast by Application, 2020-2035
  • Table 47: East Asia Market Value (USD Million) Forecast by Form, 2020-2035
  • Table 48: East Asia Market Volume (Units) Forecast by Form, 2020-2035
  • Table 49: East Asia Market Value (USD Million) Forecast by End Use, 2020-2035
  • Table 50: East Asia Market Volume (Units) Forecast by End Use, 2020-2035
  • Table 51: South Asia & Pacific Market Value (USD Million) Forecast by Country, 2020-2035
  • Table 52: South Asia & Pacific Market Volume (Units) Forecast by Country, 2020-2035
  • Table 53: South Asia & Pacific Market Value (USD Million) Forecast by Type, 2020-2035
  • Table 54: South Asia & Pacific Market Volume (Units) Forecast by Type, 2020-2035
  • Table 55: South Asia & Pacific Market Value (USD Million) Forecast by Application, 2020-2035
  • Table 56: South Asia & Pacific Market Volume (Units) Forecast by Application, 2020-2035
  • Table 57: South Asia & Pacific Market Value (USD Million) Forecast by Form, 2020-2035
  • Table 58: South Asia & Pacific Market Volume (Units) Forecast by Form, 2020-2035
  • Table 59: South Asia & Pacific Market Value (USD Million) Forecast by End Use, 2020-2035
  • Table 60: South Asia & Pacific Market Volume (Units) Forecast by End Use, 2020-2035
  • Table 61: Middle East and Africa Market Value (USD Million) Forecast by Country, 2020-2035
  • Table 62: Middle East and Africa Market Volume (Units) Forecast by Country, 2020-2035
  • Table 63: Middle East and Africa Market Value (USD Million) Forecast by Type, 2020-2035
  • Table 64: Middle East and Africa Market Volume (Units) Forecast by Type, 2020-2035
  • Table 65: Middle East and Africa Market Value (USD Million) Forecast by Application, 2020-2035
  • Table 66: Middle East and Africa Market Volume (Units) Forecast by Application, 2020-2035
  • Table 67: Middle East and Africa Market Value (USD Million) Forecast by Form, 2020-2035
  • Table 68: Middle East and Africa Market Volume (Units) Forecast by Form, 2020-2035
  • Table 69: Middle East and Africa Market Value (USD Million) Forecast by End Use, 2020-2035
  • Table 70: Middle East and Africa Market Volume (Units) Forecast by End Use, 2020-2035

List of Figures

  • Figure 1: Global Market Value (USD Million) by Type, 2025-2035
  • Figure 2: Global Market Value (USD Million) by Application, 2025-2035
  • Figure 3: Global Market Value (USD Million) by Form, 2025-2035
  • Figure 4: Global Market Value (USD Million) by End Use, 2025-2035
  • Figure 5: Global Market Value (USD Million) by Region, 2025-2035
  • Figure 6: Global Market Value (USD Million) Analysis by Region, 2020-2035
  • Figure 7: Global Market Volume (Units) Analysis by Region, 2020-2035
  • Figure 8: Global Market Value Share (%) and BPS Analysis by Region, 2025-2035
  • Figure 9: Global Market Y-o-Y Growth (%) Projections by Region, 2025-2035
  • Figure 10: Global Market Value (USD Million) Analysis by Type, 2020-2035
  • Figure 11: Global Market Volume (Units) Analysis by Type, 2020-2035
  • Figure 12: Global Market Value Share (%) and BPS Analysis by Type, 2025-2035
  • Figure 13: Global Market Y-o-Y Growth (%) Projections by Type, 2025-2035
  • Figure 14: Global Market Value (USD Million) Analysis by Application, 2020-2035
  • Figure 15: Global Market Volume (Units) Analysis by Application, 2020-2035
  • Figure 16: Global Market Value Share (%) and BPS Analysis by Application, 2025-2035
  • Figure 17: Global Market Y-o-Y Growth (%) Projections by Application, 2025-2035
  • Figure 18: Global Market Value (USD Million) Analysis by Form, 2020-2035
  • Figure 19: Global Market Volume (Units) Analysis by Form, 2020-2035
  • Figure 20: Global Market Value Share (%) and BPS Analysis by Form, 2025-2035
  • Figure 21: Global Market Y-o-Y Growth (%) Projections by Form, 2025-2035
  • Figure 22: Global Market Value (USD Million) Analysis by End Use, 2020-2035
  • Figure 23: Global Market Volume (Units) Analysis by End Use, 2020-2035
  • Figure 24: Global Market Value Share (%) and BPS Analysis by End Use, 2025-2035
  • Figure 25: Global Market Y-o-Y Growth (%) Projections by End Use, 2025-2035
  • Figure 26: Global Market Attractiveness by Type, 2025-2035
  • Figure 27: Global Market Attractiveness by Application, 2025-2035
  • Figure 28: Global Market Attractiveness by Form, 2025-2035
  • Figure 29: Global Market Attractiveness by End Use, 2025-2035
  • Figure 30: Global Market Attractiveness by Region, 2025-2035
  • Figure 31: North America Market Value (USD Million) by Type, 2025-2035
  • Figure 32: North America Market Value (USD Million) by Application, 2025-2035
  • Figure 33: North America Market Value (USD Million) by Form, 2025-2035
  • Figure 34: North America Market Value (USD Million) by End Use, 2025-2035
  • Figure 35: North America Market Value (USD Million) by Country, 2025-2035
  • Figure 36: North America Market Value (USD Million) Analysis by Country, 2020-2035
  • Figure 37: North America Market Volume (Units) Analysis by Country, 2020-2035
  • Figure 38: North America Market Value Share (%) and BPS Analysis by Country, 2025-2035
  • Figure 39: North America Market Y-o-Y Growth (%) Projections by Country, 2025-2035
  • Figure 40: North America Market Value (USD Million) Analysis by Type, 2020-2035
  • Figure 41: North America Market Volume (Units) Analysis by Type, 2020-2035
  • Figure 42: North America Market Value Share (%) and BPS Analysis by Type, 2025-2035
  • Figure 43: North America Market Y-o-Y Growth (%) Projections by Type, 2025-2035
  • Figure 44: North America Market Value (USD Million) Analysis by Application, 2020-2035
  • Figure 45: North America Market Volume (Units) Analysis by Application, 2020-2035
  • Figure 46: North America Market Value Share (%) and BPS Analysis by Application, 2025-2035
  • Figure 47: North America Market Y-o-Y Growth (%) Projections by Application, 2025-2035
  • Figure 48: North America Market Value (USD Million) Analysis by Form, 2020-2035
  • Figure 49: North America Market Volume (Units) Analysis by Form, 2020-2035
  • Figure 50: North America Market Value Share (%) and BPS Analysis by Form, 2025-2035
  • Figure 51: North America Market Y-o-Y Growth (%) Projections by Form, 2025-2035
  • Figure 52: North America Market Value (USD Million) Analysis by End Use, 2020-2035
  • Figure 53: North America Market Volume (Units) Analysis by End Use, 2020-2035
  • Figure 54: North America Market Value Share (%) and BPS Analysis by End Use, 2025-2035
  • Figure 55: North America Market Y-o-Y Growth (%) Projections by End Use, 2025-2035
  • Figure 56: North America Market Attractiveness by Type, 2025-2035
  • Figure 57: North America Market Attractiveness by Application, 2025-2035
  • Figure 58: North America Market Attractiveness by Form, 2025-2035
  • Figure 59: North America Market Attractiveness by End Use, 2025-2035
  • Figure 60: North America Market Attractiveness by Country, 2025-2035
  • Figure 61: Latin America Market Value (USD Million) by Type, 2025-2035
  • Figure 62: Latin America Market Value (USD Million) by Application, 2025-2035
  • Figure 63: Latin America Market Value (USD Million) by Form, 2025-2035
  • Figure 64: Latin America Market Value (USD Million) by End Use, 2025-2035
  • Figure 65: Latin America Market Value (USD Million) by Country, 2025-2035
  • Figure 66: Latin America Market Value (USD Million) Analysis by Country, 2020-2035
  • Figure 67: Latin America Market Volume (Units) Analysis by Country, 2020-2035
  • Figure 68: Latin America Market Value Share (%) and BPS Analysis by Country, 2025-2035
  • Figure 69: Latin America Market Y-o-Y Growth (%) Projections by Country, 2025-2035
  • Figure 70: Latin America Market Value (USD Million) Analysis by Type, 2020-2035
  • Figure 71: Latin America Market Volume (Units) Analysis by Type, 2020-2035
  • Figure 72: Latin America Market Value Share (%) and BPS Analysis by Type, 2025-2035
  • Figure 73: Latin America Market Y-o-Y Growth (%) Projections by Type, 2025-2035
  • Figure 74: Latin America Market Value (USD Million) Analysis by Application, 2020-2035
  • Figure 75: Latin America Market Volume (Units) Analysis by Application, 2020-2035
  • Figure 76: Latin America Market Value Share (%) and BPS Analysis by Application, 2025-2035
  • Figure 77: Latin America Market Y-o-Y Growth (%) Projections by Application, 2025-2035
  • Figure 78: Latin America Market Value (USD Million) Analysis by Form, 2020-2035
  • Figure 79: Latin America Market Volume (Units) Analysis by Form, 2020-2035
  • Figure 80: Latin America Market Value Share (%) and BPS Analysis by Form, 2025-2035
  • Figure 81: Latin America Market Y-o-Y Growth (%) Projections by Form, 2025-2035
  • Figure 82: Latin America Market Value (USD Million) Analysis by End Use, 2020-2035
  • Figure 83: Latin America Market Volume (Units) Analysis by End Use, 2020-2035
  • Figure 84: Latin America Market Value Share (%) and BPS Analysis by End Use, 2025-2035
  • Figure 85: Latin America Market Y-o-Y Growth (%) Projections by End Use, 2025-2035
  • Figure 86: Latin America Market Attractiveness by Type, 2025-2035
  • Figure 87: Latin America Market Attractiveness by Application, 2025-2035
  • Figure 88: Latin America Market Attractiveness by Form, 2025-2035
  • Figure 89: Latin America Market Attractiveness by End Use, 2025-2035
  • Figure 90: Latin America Market Attractiveness by Country, 2025-2035
  • Figure 91: Europe Market Value (USD Million) by Type, 2025-2035
  • Figure 92: Europe Market Value (USD Million) by Application, 2025-2035
  • Figure 93: Europe Market Value (USD Million) by Form, 2025-2035
  • Figure 94: Europe Market Value (USD Million) by End Use, 2025-2035
  • Figure 95: Europe Market Value (USD Million) by Country, 2025-2035
  • Figure 96: Europe Market Value (USD Million) Analysis by Country, 2020-2035
  • Figure 97: Europe Market Volume (Units) Analysis by Country, 2020-2035
  • Figure 98: Europe Market Value Share (%) and BPS Analysis by Country, 2025-2035
  • Figure 99: Europe Market Y-o-Y Growth (%) Projections by Country, 2025-2035
  • Figure 100: Europe Market Value (USD Million) Analysis by Type, 2020-2035
  • Figure 101: Europe Market Volume (Units) Analysis by Type, 2020-2035
  • Figure 102: Europe Market Value Share (%) and BPS Analysis by Type, 2025-2035
  • Figure 103: Europe Market Y-o-Y Growth (%) Projections by Type, 2025-2035
  • Figure 104: Europe Market Value (USD Million) Analysis by Application, 2020-2035
  • Figure 105: Europe Market Volume (Units) Analysis by Application, 2020-2035
  • Figure 106: Europe Market Value Share (%) and BPS Analysis by Application, 2025-2035
  • Figure 107: Europe Market Y-o-Y Growth (%) Projections by Application, 2025-2035
  • Figure 108: Europe Market Value (USD Million) Analysis by Form, 2020-2035
  • Figure 109: Europe Market Volume (Units) Analysis by Form, 2020-2035
  • Figure 110: Europe Market Value Share (%) and BPS Analysis by Form, 2025-2035
  • Figure 111: Europe Market Y-o-Y Growth (%) Projections by Form, 2025-2035
  • Figure 112: Europe Market Value (USD Million) Analysis by End Use, 2020-2035
  • Figure 113: Europe Market Volume (Units) Analysis by End Use, 2020-2035
  • Figure 114: Europe Market Value Share (%) and BPS Analysis by End Use, 2025-2035
  • Figure 115: Europe Market Y-o-Y Growth (%) Projections by End Use, 2025-2035
  • Figure 116: Europe Market Attractiveness by Type, 2025-2035
  • Figure 117: Europe Market Attractiveness by Application, 2025-2035
  • Figure 118: Europe Market Attractiveness by Form, 2025-2035
  • Figure 119: Europe Market Attractiveness by End Use, 2025-2035
  • Figure 120: Europe Market Attractiveness by Country, 2025-2035
  • Figure 121: East Asia Market Value (USD Million) by Type, 2025-2035
  • Figure 122: East Asia Market Value (USD Million) by Application, 2025-2035
  • Figure 123: East Asia Market Value (USD Million) by Form, 2025-2035
  • Figure 124: East Asia Market Value (USD Million) by End Use, 2025-2035
  • Figure 125: East Asia Market Value (USD Million) by Country, 2025-2035
  • Figure 126: East Asia Market Value (USD Million) Analysis by Country, 2020-2035
  • Figure 127: East Asia Market Volume (Units) Analysis by Country, 2020-2035
  • Figure 128: East Asia Market Value Share (%) and BPS Analysis by Country, 2025-2035
  • Figure 129: East Asia Market Y-o-Y Growth (%) Projections by Country, 2025-2035
  • Figure 130: East Asia Market Value (USD Million) Analysis by Type, 2020-2035
  • Figure 131: East Asia Market Volume (Units) Analysis by Type, 2020-2035
  • Figure 132: East Asia Market Value Share (%) and BPS Analysis by Type, 2025-2035
  • Figure 133: East Asia Market Y-o-Y Growth (%) Projections by Type, 2025-2035
  • Figure 134: East Asia Market Value (USD Million) Analysis by Application, 2020-2035
  • Figure 135: East Asia Market Volume (Units) Analysis by Application, 2020-2035
  • Figure 136: East Asia Market Value Share (%) and BPS Analysis by Application, 2025-2035
  • Figure 137: East Asia Market Y-o-Y Growth (%) Projections by Application, 2025-2035
  • Figure 138: East Asia Market Value (USD Million) Analysis by Form, 2020-2035
  • Figure 139: East Asia Market Volume (Units) Analysis by Form, 2020-2035
  • Figure 140: East Asia Market Value Share (%) and BPS Analysis by Form, 2025-2035
  • Figure 141: East Asia Market Y-o-Y Growth (%) Projections by Form, 2025-2035
  • Figure 142: East Asia Market Value (USD Million) Analysis by End Use, 2020-2035
  • Figure 143: East Asia Market Volume (Units) Analysis by End Use, 2020-2035
  • Figure 144: East Asia Market Value Share (%) and BPS Analysis by End Use, 2025-2035
  • Figure 145: East Asia Market Y-o-Y Growth (%) Projections by End Use, 2025-2035
  • Figure 146: East Asia Market Attractiveness by Type, 2025-2035
  • Figure 147: East Asia Market Attractiveness by Application, 2025-2035
  • Figure 148: East Asia Market Attractiveness by Form, 2025-2035
  • Figure 149: East Asia Market Attractiveness by End Use, 2025-2035
  • Figure 150: East Asia Market Attractiveness by Country, 2025-2035
  • Figure 151: South Asia & Pacific Market Value (USD Million) by Type, 2025-2035
  • Figure 152: South Asia & Pacific Market Value (USD Million) by Application, 2025-2035
  • Figure 153: South Asia & Pacific Market Value (USD Million) by Form, 2025-2035
  • Figure 154: South Asia & Pacific Market Value (USD Million) by End Use, 2025-2035
  • Figure 155: South Asia & Pacific Market Value (USD Million) by Country, 2025-2035
  • Figure 156: South Asia & Pacific Market Value (USD Million) Analysis by Country, 2020-2035
  • Figure 157: South Asia & Pacific Market Volume (Units) Analysis by Country, 2020-2035
  • Figure 158: South Asia & Pacific Market Value Share (%) and BPS Analysis by Country, 2025-2035
  • Figure 159: South Asia & Pacific Market Y-o-Y Growth (%) Projections by Country, 2025-2035
  • Figure 160: South Asia & Pacific Market Value (USD Million) Analysis by Type, 2020-2035
  • Figure 161: South Asia & Pacific Market Volume (Units) Analysis by Type, 2020-2035
  • Figure 162: South Asia & Pacific Market Value Share (%) and BPS Analysis by Type, 2025-2035
  • Figure 163: South Asia & Pacific Market Y-o-Y Growth (%) Projections by Type, 2025-2035
  • Figure 164: South Asia & Pacific Market Value (USD Million) Analysis by Application, 2020-2035
  • Figure 165: South Asia & Pacific Market Volume (Units) Analysis by Application, 2020-2035
  • Figure 166: South Asia & Pacific Market Value Share (%) and BPS Analysis by Application, 2025-2035
  • Figure 167: South Asia & Pacific Market Y-o-Y Growth (%) Projections by Application, 2025-2035
  • Figure 168: South Asia & Pacific Market Value (USD Million) Analysis by Form, 2020-2035
  • Figure 169: South Asia & Pacific Market Volume (Units) Analysis by Form, 2020-2035
  • Figure 170: South Asia & Pacific Market Value Share (%) and BPS Analysis by Form, 2025-2035
  • Figure 171: South Asia & Pacific Market Y-o-Y Growth (%) Projections by Form, 2025-2035
  • Figure 172: South Asia & Pacific Market Value (USD Million) Analysis by End Use, 2020-2035
  • Figure 173: South Asia & Pacific Market Volume (Units) Analysis by End Use, 2020-2035
  • Figure 174: South Asia & Pacific Market Value Share (%) and BPS Analysis by End Use, 2025-2035
  • Figure 175: South Asia & Pacific Market Y-o-Y Growth (%) Projections by End Use, 2025-2035
  • Figure 176: South Asia & Pacific Market Attractiveness by Type, 2025-2035
  • Figure 177: South Asia & Pacific Market Attractiveness by Application, 2025-2035
  • Figure 178: South Asia & Pacific Market Attractiveness by Form, 2025-2035
  • Figure 179: South Asia & Pacific Market Attractiveness by End Use, 2025-2035
  • Figure 180: South Asia & Pacific Market Attractiveness by Country, 2025-2035
  • Figure 181: Middle East and Africa Market Value (USD Million) by Type, 2025-2035
  • Figure 182: Middle East and Africa Market Value (USD Million) by Application, 2025-2035
  • Figure 183: Middle East and Africa Market Value (USD Million) by Form, 2025-2035
  • Figure 184: Middle East and Africa Market Value (USD Million) by End Use, 2025-2035
  • Figure 185: Middle East and Africa Market Value (USD Million) by Country, 2025-2035
  • Figure 186: Middle East and Africa Market Value (USD Million) Analysis by Country, 2020-2035
  • Figure 187: Middle East and Africa Market Volume (Units) Analysis by Country, 2020-2035
  • Figure 188: Middle East and Africa Market Value Share (%) and BPS Analysis by Country, 2025-2035
  • Figure 189: Middle East and Africa Market Y-o-Y Growth (%) Projections by Country, 2025-2035
  • Figure 190: Middle East and Africa Market Value (USD Million) Analysis by Type, 2020-2035
  • Figure 191: Middle East and Africa Market Volume (Units) Analysis by Type, 2020-2035
  • Figure 192: Middle East and Africa Market Value Share (%) and BPS Analysis by Type, 2025-2035
  • Figure 193: Middle East and Africa Market Y-o-Y Growth (%) Projections by Type, 2025-2035
  • Figure 194: Middle East and Africa Market Value (USD Million) Analysis by Application, 2020-2035
  • Figure 195: Middle East and Africa Market Volume (Units) Analysis by Application, 2020-2035
  • Figure 196: Middle East and Africa Market Value Share (%) and BPS Analysis by Application, 2025-2035
  • Figure 197: Middle East and Africa Market Y-o-Y Growth (%) Projections by Application, 2025-2035
  • Figure 198: Middle East and Africa Market Value (USD Million) Analysis by Form, 2020-2035
  • Figure 199: Middle East and Africa Market Volume (Units) Analysis by Form, 2020-2035
  • Figure 200: Middle East and Africa Market Value Share (%) and BPS Analysis by Form, 2025-2035
  • Figure 201: Middle East and Africa Market Y-o-Y Growth (%) Projections by Form, 2025-2035
  • Figure 202: Middle East and Africa Market Value (USD Million) Analysis by End Use, 2020-2035
  • Figure 203: Middle East and Africa Market Volume (Units) Analysis by End Use, 2020-2035
  • Figure 204: Middle East and Africa Market Value Share (%) and BPS Analysis by End Use, 2025-2035
  • Figure 205: Middle East and Africa Market Y-o-Y Growth (%) Projections by End Use, 2025-2035
  • Figure 206: Middle East and Africa Market Attractiveness by Type, 2025-2035
  • Figure 207: Middle East and Africa Market Attractiveness by Application, 2025-2035
  • Figure 208: Middle East and Africa Market Attractiveness by Form, 2025-2035
  • Figure 209: Middle East and Africa Market Attractiveness by End Use, 2025-2035
  • Figure 210: Middle East and Africa Market Attractiveness by Country, 2025-2035

Frequently Asked Questions

How big is the Flavoring Cosmetic Formulation Agents Market in 2025?

The global Flavoring Cosmetic Formulation Agents Market is estimated to be valued at USD 4,206.7 million in 2025.

What will be the size of the Flavoring Cosmetic Formulation Agents Market in 2035?

The market size for the Flavoring Cosmetic Formulation Agents Market is projected to reach USD 8,902.3 million by 2035.

How much will be the Flavoring Cosmetic Formulation Agents Market growth between 2025 and 2035?

The Flavoring Cosmetic Formulation Agents Market is expected to grow at a 7.8% CAGR between 2025 and 2035.

What are the key product types in the Flavoring Cosmetic Formulation Agents Market?

The key product types in the Flavoring Cosmetic Formulation Agents Market are natural flavors, nature-identical flavors, and synthetic flavors.

Which application segment will contribute a significant share in the Flavoring Cosmetic Formulation Agents Market in 2025?

In terms of application, the “Others” category, which includes lip care, medicated balms, and nutracosmetics, is expected to command 60.4% share in the Flavoring Cosmetic Formulation Agents Market in 2025.

Explore Similar Insights

Future Market Insights

Flavoring Cosmetic Formulation Agents Market

Chat With

MaRIA

Hi There, I am MaRIA, Your Market Research Intelligence Assistant. How may I help you?