Fluorescence-Activated Cell Sorting Market Size and Share Forecast Outlook 2025 to 2035

The Fluorescence-Activated Cell Sorting Market is estimated to be valued at USD 3.8 billion in 2025 and is projected to reach USD 7.7 billion by 2035, registering a compound annual growth rate (CAGR) of 7.4% over the forecast period.
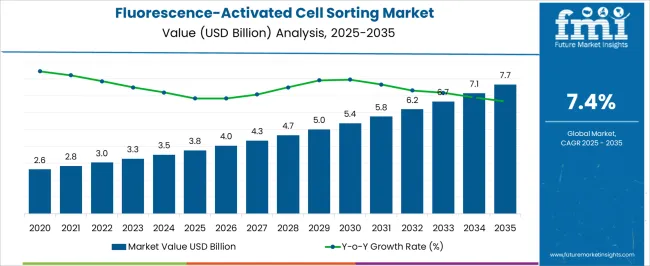
Quick Stats for Fluorescence-Activated Cell Sorting Market

  • Fluorescence-Activated Cell Sorting Market Value (2025): USD 3.8 billion
  • Fluorescence-Activated Cell Sorting Market Forecast Value (2035): USD 7.7 billion
  • Fluorescence-Activated Cell Sorting Market Forecast CAGR: 7.4%
  • Leading Segment in Fluorescence-Activated Cell Sorting Market in 2025: Immunology And Cancer Research (44.6%)
  • Key Growth Regions in Fluorescence-Activated Cell Sorting Market: North America, Asia-Pacific, Europe
  • Top Key Players in Fluorescence-Activated Cell Sorting Market: Becton Dickinson and Company, Danaher Corporation, Thermo Fisher ScientificInc., Agilent TechnologiesInc., Luminex Corporation, Bio-Rad LaboratoriesInc., Miltenyi Biotec, Sysmex Corporation, StratedigmInc., Apogee Flow Systems Ltd., Sony BiotechnologyInc., Enzo Life Sciences Inc, Merck KGaA

Fluorescence Activated Cell Sorting Market Market Value Analysis

Fluorescence-Activated Cell Sorting Market Key Takeaways

Metric Value
Fluorescence-Activated Cell Sorting Market Estimated Value in (2025 E) USD 3.8 billion
Fluorescence-Activated Cell Sorting Market Forecast Value in (2035 F) USD 7.7 billion
Forecast CAGR (2025 to 2035) 7.4%

Why is the Fluorescence-Activated Cell Sorting Market Growing?

The Fluorescence-Activated Cell Sorting market is being expanded steadily by advancements in biomedical research and personalized medicine. The current scenario reflects growing investments in cell-based research, immunotherapy, and cancer diagnostics, where precise cell separation technologies are critical. Increasing prevalence of chronic diseases and the need for targeted therapies are contributing to the adoption of advanced sorting methods that support high-throughput, accurate, and reproducible results.

The market outlook is strengthened by the integration of fluorescence-based cell sorting techniques in multi-omics research, enabling better understanding of disease pathways. The rising collaboration between academic institutions and healthcare companies is further fueling research-based applications.

Improvements in automation and miniaturization are making sorting systems more accessible to laboratories with limited infrastructure, while the ongoing development of novel biomarkers is expanding the scope of cell-based analysis In the future, the growing demand for cell therapy, regenerative medicine, and advanced drug screening is expected to enhance investments in sorting technologies, reinforcing the market’s growth and opening avenues for innovation in cell isolation and molecular characterization.

Segmental Analysis

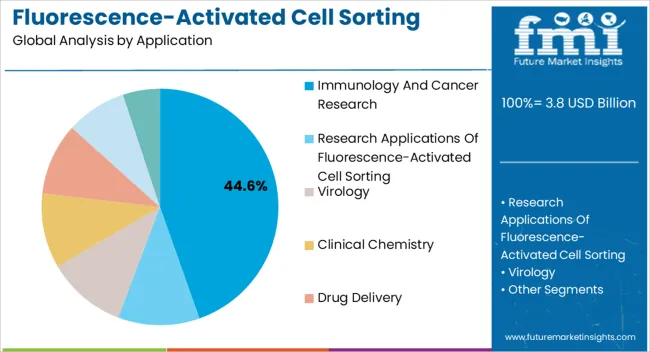
The fluorescence-activated cell sorting market is segmented by application, end user, and geographic regions. By application, fluorescence-activated cell sorting market is divided into Immunology And Cancer Research, Research Applications Of Fluorescence-Activated Cell Sorting, Virology, Clinical Chemistry, Drug Delivery, Others, and Clinical Applications Of Fluorescence-Activated Cell Sorting.

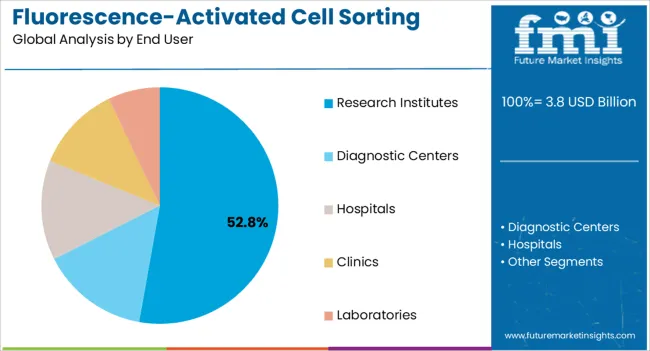
In terms of end user, fluorescence-activated cell sorting market is classified into Research Institutes, Diagnostic Centers, Hospitals, Clinics, and Laboratories. Regionally, the fluorescence-activated cell sorting industry is classified into North America, Latin America, Western Europe, Eastern Europe, Balkan & Baltic Countries, Russia & Belarus, Central Asia, East Asia, South Asia & Pacific, and the Middle East & Africa.
Insights into the Immunology And Cancer Research Application Segment

Fluorescence Activated Cell Sorting Market Analysis By End User

The Immunology and Cancer Research application is expected to hold 44.60% of the Fluorescence-Activated Cell Sorting market share in 2025, emerging as the largest application segment. The dominance of this segment is being attributed to the critical role that cell sorting plays in identifying and isolating immune cell subtypes and tumor cells for advanced research. Increasing interest in immunotherapies and precision oncology has necessitated the use of highly specific sorting techniques that enable the study of rare cell populations and functional assays.

The segment’s growth has been supported by rising funding from public and private organizations for cancer-related research and drug discovery. The adoption of fluorescence-based methods is being accelerated by their compatibility with multi-parameter analysis and real-time detection capabilities.

As research programs aim to better understand immune responses and tumor microenvironments, the demand for cell sorting technologies has been expanded The future outlook is expected to remain robust, as ongoing advancements in biomarker discovery and personalized medicine approaches further encourage the application of cell sorting in immunological and oncological studies.
Insights into the Research Institutes End User Segment

Fluorescence Activated Cell Sorting Market Analysis By Application

The Research Institutes end user segment is projected to hold 52.80% of the Fluorescence-Activated Cell Sorting market revenue in 2025, making it the leading segment among end users. This leadership is being attributed to the growing need for advanced cell analysis tools in academic and government-funded research facilities. The segment’s expansion has been supported by increasing investments in basic and translational research, where cell sorting systems are essential for studying cell differentiation, signaling pathways, and disease mechanisms.

The adoption of fluorescence-based sorting techniques has been accelerated by their ability to deliver high sensitivity, specificity, and reproducibility, which are critical in cell biology and therapeutic research. In addition, the demand has been fueled by collaborations between research institutes and pharmaceutical companies aimed at enhancing drug discovery pipelines and developing novel therapies.

With the continuous rise in cell-based research projects and global scientific collaborations, the requirement for advanced, automated sorting solutions has been expanded The future growth of this segment is expected to be driven by increasing availability of funding, as well as the integration of sorting platforms into multi-disciplinary research workflows.

Fluorescence-Activated Cell Sorting Market Overview

Flow cytometry is a procedure that analyzes chemical and physical characteristics of certain particles in a fluid while passing through at least one laser. These cell components are labelled with fluorescence and when laser is passed, these cell components emit light at various wavelengths.

Fluorescence-Activated Cell Sorting is an advanced type of flow cytometry which is used for sorting heterogeneous mixture of living cells based on light scattering properties and fluorescent labelling of the cells.

The suspension of these cells is contained in a rapidly moving, narrow liquid stream, through which vibration caused the liquid stream to break in single droplets. Prior the vibration, liquid stream is passed through one or more laser beams which further allows the fluorescence pattern of individual cell to be identified.

This liquid stream is further broken into droplets depending upon the characteristics chosen from the initial fluorescence analysis. These droplets then pass via an array of electrostatic deflectors. These deflectors divert the droplets in wells or test tubes according to their charge.
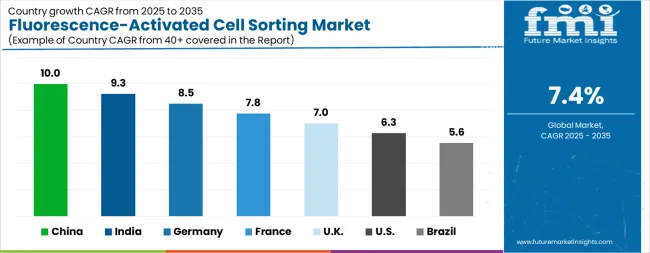
Analysis of Fluorescence-Activated Cell Sorting Market By Key Countries

Fluorescence Activated Cell Sorting Market Cagr Analysis By Country

Country CAGR
China 10.0%
India 9.3%
Germany 8.5%
France 7.8%
UK 7.0%
USA 6.3%
Brazil 5.6%

Country-wise Analysis

The Fluorescence-Activated Cell Sorting Market is expected to register a CAGR of 7.4% during the forecast period, exhibiting varied country level momentum. China leads with the highest CAGR of 10.0%, followed by India at 9.3%. Developed markets such as Germany, France, and the UK continue to expand steadily, while the USA is likely to grow at consistent rates. Brazil posts the lowest CAGR at 5.6%, yet still underscores a broadly positive trajectory for the global Fluorescence-Activated Cell Sorting Market. In 2024, Germany held a dominant revenue in the Western Europe market and is expected to grow with a CAGR of 8.5%. The USA Fluorescence-Activated Cell Sorting Market is estimated to be valued at USD 1.4 billion in 2025 and is anticipated to reach a valuation of USD 2.6 billion by 2035. Sales are projected to rise at a CAGR of 6.3% over the forecast period between 2025 and 2035. While Japan and South Korea markets are estimated to be valued at USD 195.2 million and USD 99.1 million respectively in 2025.
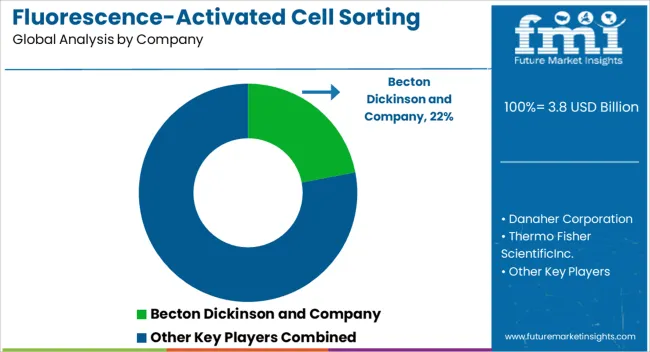
Key Players in the Fluorescence-Activated Cell Sorting Market

Fluorescence Activated Cell Sorting Market Analysis By Company

  • Becton Dickinson and Company
  • Danaher Corporation
  • Thermo Fisher ScientificInc.
  • Agilent TechnologiesInc.
  • Luminex Corporation
  • Bio-Rad LaboratoriesInc.
  • Miltenyi Biotec
  • Sysmex Corporation
  • StratedigmInc.
  • Apogee Flow Systems Ltd.
  • Sony BiotechnologyInc.
  • Enzo Life Sciences Inc
  • Merck KGaA

Scope of the Report

Item Value
Quantitative Units USD 3.8 Billion
Application Immunology And Cancer Research, Research Applications Of Fluorescence-Activated Cell Sorting, Virology, Clinical Chemistry, Drug Delivery, Others, and Clinical Applications Of Fluorescence-Activated Cell Sorting
End User Research Institutes, Diagnostic Centers, Hospitals, Clinics, and Laboratories
Regions Covered North America, Europe, Asia-Pacific, Latin America, Middle East & Africa
Country Covered United States, Canada, Germany, France, United Kingdom, China, Japan, India, Brazil, South Africa
Key Companies Profiled Becton Dickinson and Company, Danaher Corporation, Thermo Fisher ScientificInc., Agilent TechnologiesInc., Luminex Corporation, Bio-Rad LaboratoriesInc., Miltenyi Biotec, Sysmex Corporation, StratedigmInc., Apogee Flow Systems Ltd., Sony BiotechnologyInc., Enzo Life Sciences Inc, and Merck KGaA

Fluorescence-Activated Cell Sorting Market by Segments

Application:

  • Immunology And Cancer Research
  • Research Applications Of Fluorescence-Activated Cell Sorting
  • Virology
  • Clinical Chemistry
  • Drug Delivery
  • Others
  • Clinical Applications Of Fluorescence-Activated Cell Sorting

End User:

  • Research Institutes
  • Diagnostic Centers
  • Hospitals
  • Clinics
  • Laboratories

Region:

  • North America
    • USA
    • Canada
    • Mexico
  • Latin America
    • Brazil
    • Chile
    • Rest of Latin America
  • Western Europe
    • Germany
    • UK
    • Italy
    • Spain
    • France
    • Nordic
    • BENELUX
    • Rest of Western Europe
  • Eastern Europe
    • Russia
    • Poland
    • Hungary
    • Balkan & Baltic
    • Rest of Eastern Europe
  • East Asia
    • China
    • Japan
    • South Korea
  • South Asia and Pacific
    • India
    • ASEAN
    • Australia & New Zealand
    • Rest of South Asia and Pacific
  • Middle East & Africa
    • Kingdom of Saudi Arabia
    • Other GCC Countries
    • Turkiye
    • South Africa
    • Other African Union
    • Rest of Middle East & Africa

Table of Content

  1. Executive Summary
    • Global Market Outlook
    • Demand-side Trends
    • Supply-side Trends
    • Technology Roadmap Analysis
    • Analysis and Recommendations
  2. Market Overview
    • Market Coverage / Taxonomy
    • Market Definition / Scope / Limitations
  3. Market Background
    • Market Dynamics
      • Drivers
      • Restraints
      • Opportunity
      • Trends
    • Scenario Forecast
      • Demand in Optimistic Scenario
      • Demand in Likely Scenario
      • Demand in Conservative Scenario
    • Opportunity Map Analysis
    • Product Life Cycle Analysis
    • Supply Chain Analysis
    • Investment Feasibility Matrix
    • Value Chain Analysis
    • PESTLE and Porter’s Analysis
    • Regulatory Landscape
    • Regional Parent Market Outlook
    • Production and Consumption Statistics
    • Import and Export Statistics
  4. Global Market Analysis 2020 to 2024 and Forecast, 2025 to 2035
    • Historical Market Size Value (USD Million) Analysis, 2020 to 2024
    • Current and Future Market Size Value (USD Million) Projections, 2025 to 2035
      • Y-o-Y Growth Trend Analysis
      • Absolute $ Opportunity Analysis
  5. Global Market Pricing Analysis 2020 to 2024 and Forecast 2025 to 2035
  6. Global Market Analysis 2020 to 2024 and Forecast 2025 to 2035, By Application
    • Introduction / Key Findings
    • Historical Market Size Value (USD Million) Analysis By Application, 2020 to 2024
    • Current and Future Market Size Value (USD Million) Analysis and Forecast By Application, 2025 to 2035
      • Immunology And Cancer Research
      • Research Applications Of Fluorescence-Activated Cell Sorting
      • Virology
      • Clinical Chemistry
      • Drug Delivery
      • Others
      • Clinical Applications Of Fluorescence-Activated Cell Sorting
    • Y-o-Y Growth Trend Analysis By Application, 2020 to 2024
    • Absolute $ Opportunity Analysis By Application, 2025 to 2035
  7. Global Market Analysis 2020 to 2024 and Forecast 2025 to 2035, By End User
    • Introduction / Key Findings
    • Historical Market Size Value (USD Million) Analysis By End User, 2020 to 2024
    • Current and Future Market Size Value (USD Million) Analysis and Forecast By End User, 2025 to 2035
      • Research Institutes
      • Diagnostic Centers
      • Hospitals
      • Clinics
      • Laboratories
    • Y-o-Y Growth Trend Analysis By End User, 2020 to 2024
    • Absolute $ Opportunity Analysis By End User, 2025 to 2035
  8. Global Market Analysis 2020 to 2024 and Forecast 2025 to 2035, By Region
    • Introduction
    • Historical Market Size Value (USD Million) Analysis By Region, 2020 to 2024
    • Current Market Size Value (USD Million) Analysis and Forecast By Region, 2025 to 2035
      • North America
      • Latin America
      • Western Europe
      • Eastern Europe
      • East Asia
      • South Asia and Pacific
      • Middle East & Africa
    • Market Attractiveness Analysis By Region
  9. North America Market Analysis 2020 to 2024 and Forecast 2025 to 2035, By Country
    • Historical Market Size Value (USD Million) Trend Analysis By Market Taxonomy, 2020 to 2024
    • Market Size Value (USD Million) Forecast By Market Taxonomy, 2025 to 2035
      • By Country
        • USA
        • Canada
        • Mexico
      • By Application
      • By End User
    • Market Attractiveness Analysis
      • By Country
      • By Application
      • By End User
    • Key Takeaways
  10. Latin America Market Analysis 2020 to 2024 and Forecast 2025 to 2035, By Country
    • Historical Market Size Value (USD Million) Trend Analysis By Market Taxonomy, 2020 to 2024
    • Market Size Value (USD Million) Forecast By Market Taxonomy, 2025 to 2035
      • By Country
        • Brazil
        • Chile
        • Rest of Latin America
      • By Application
      • By End User
    • Market Attractiveness Analysis
      • By Country
      • By Application
      • By End User
    • Key Takeaways
  11. Western Europe Market Analysis 2020 to 2024 and Forecast 2025 to 2035, By Country
    • Historical Market Size Value (USD Million) Trend Analysis By Market Taxonomy, 2020 to 2024
    • Market Size Value (USD Million) Forecast By Market Taxonomy, 2025 to 2035
      • By Country
        • Germany
        • UK
        • Italy
        • Spain
        • France
        • Nordic
        • BENELUX
        • Rest of Western Europe
      • By Application
      • By End User
    • Market Attractiveness Analysis
      • By Country
      • By Application
      • By End User
    • Key Takeaways
  12. Eastern Europe Market Analysis 2020 to 2024 and Forecast 2025 to 2035, By Country
    • Historical Market Size Value (USD Million) Trend Analysis By Market Taxonomy, 2020 to 2024
    • Market Size Value (USD Million) Forecast By Market Taxonomy, 2025 to 2035
      • By Country
        • Russia
        • Poland
        • Hungary
        • Balkan & Baltic
        • Rest of Eastern Europe
      • By Application
      • By End User
    • Market Attractiveness Analysis
      • By Country
      • By Application
      • By End User
    • Key Takeaways
  13. East Asia Market Analysis 2020 to 2024 and Forecast 2025 to 2035, By Country
    • Historical Market Size Value (USD Million) Trend Analysis By Market Taxonomy, 2020 to 2024
    • Market Size Value (USD Million) Forecast By Market Taxonomy, 2025 to 2035
      • By Country
        • China
        • Japan
        • South Korea
      • By Application
      • By End User
    • Market Attractiveness Analysis
      • By Country
      • By Application
      • By End User
    • Key Takeaways
  14. South Asia and Pacific Market Analysis 2020 to 2024 and Forecast 2025 to 2035, By Country
    • Historical Market Size Value (USD Million) Trend Analysis By Market Taxonomy, 2020 to 2024
    • Market Size Value (USD Million) Forecast By Market Taxonomy, 2025 to 2035
      • By Country
        • India
        • ASEAN
        • Australia & New Zealand
        • Rest of South Asia and Pacific
      • By Application
      • By End User
    • Market Attractiveness Analysis
      • By Country
      • By Application
      • By End User
    • Key Takeaways
  15. Middle East & Africa Market Analysis 2020 to 2024 and Forecast 2025 to 2035, By Country
    • Historical Market Size Value (USD Million) Trend Analysis By Market Taxonomy, 2020 to 2024
    • Market Size Value (USD Million) Forecast By Market Taxonomy, 2025 to 2035
      • By Country
        • Kingdom of Saudi Arabia
        • Other GCC Countries
        • Turkiye
        • South Africa
        • Other African Union
        • Rest of Middle East & Africa
      • By Application
      • By End User
    • Market Attractiveness Analysis
      • By Country
      • By Application
      • By End User
    • Key Takeaways
  16. Key Countries Market Analysis
    • USA
      • Pricing Analysis
      • Market Share Analysis, 2024
        • By Application
        • By End User
    • Canada
      • Pricing Analysis
      • Market Share Analysis, 2024
        • By Application
        • By End User
    • Mexico
      • Pricing Analysis
      • Market Share Analysis, 2024
        • By Application
        • By End User
    • Brazil
      • Pricing Analysis
      • Market Share Analysis, 2024
        • By Application
        • By End User
    • Chile
      • Pricing Analysis
      • Market Share Analysis, 2024
        • By Application
        • By End User
    • Germany
      • Pricing Analysis
      • Market Share Analysis, 2024
        • By Application
        • By End User
    • UK
      • Pricing Analysis
      • Market Share Analysis, 2024
        • By Application
        • By End User
    • Italy
      • Pricing Analysis
      • Market Share Analysis, 2024
        • By Application
        • By End User
    • Spain
      • Pricing Analysis
      • Market Share Analysis, 2024
        • By Application
        • By End User
    • France
      • Pricing Analysis
      • Market Share Analysis, 2024
        • By Application
        • By End User
    • India
      • Pricing Analysis
      • Market Share Analysis, 2024
        • By Application
        • By End User
    • ASEAN
      • Pricing Analysis
      • Market Share Analysis, 2024
        • By Application
        • By End User
    • Australia & New Zealand
      • Pricing Analysis
      • Market Share Analysis, 2024
        • By Application
        • By End User
    • China
      • Pricing Analysis
      • Market Share Analysis, 2024
        • By Application
        • By End User
    • Japan
      • Pricing Analysis
      • Market Share Analysis, 2024
        • By Application
        • By End User
    • South Korea
      • Pricing Analysis
      • Market Share Analysis, 2024
        • By Application
        • By End User
    • Russia
      • Pricing Analysis
      • Market Share Analysis, 2024
        • By Application
        • By End User
    • Poland
      • Pricing Analysis
      • Market Share Analysis, 2024
        • By Application
        • By End User
    • Hungary
      • Pricing Analysis
      • Market Share Analysis, 2024
        • By Application
        • By End User
    • Kingdom of Saudi Arabia
      • Pricing Analysis
      • Market Share Analysis, 2024
        • By Application
        • By End User
    • Turkiye
      • Pricing Analysis
      • Market Share Analysis, 2024
        • By Application
        • By End User
    • South Africa
      • Pricing Analysis
      • Market Share Analysis, 2024
        • By Application
        • By End User
  17. Market Structure Analysis
    • Competition Dashboard
    • Competition Benchmarking
    • Market Share Analysis of Top Players
      • By Regional
      • By Application
      • By End User
  18. Competition Analysis
    • Competition Deep Dive
      • Becton Dickinson and Company
        • Overview
        • Product Portfolio
        • Profitability by Market Segments (Product/Age /Sales Channel/Region)
        • Sales Footprint
        • Strategy Overview
          • Marketing Strategy
          • Product Strategy
          • Channel Strategy
      • Danaher Corporation
      • Thermo Fisher ScientificInc.
      • Agilent TechnologiesInc.
      • Luminex Corporation
      • Bio-Rad LaboratoriesInc.
      • Miltenyi Biotec
      • Sysmex Corporation
      • StratedigmInc.
      • Apogee Flow Systems Ltd.
      • Sony BiotechnologyInc.
      • Enzo Life Sciences Inc
      • Merck KGaA
  19. Assumptions & Acronyms Used
  20. Research Methodology

List of Tables

  • Table 1: Global Fluorescence-Activated Cell Sorting Market Value (USD Mn) Forecast by Region, 2020-2035
  • Table 2: Global Fluorescence-Activated Cell Sorting Market Value (USD Mn) Forecast by Application , 2020-2035
  • Table 3: Global Fluorescence-Activated Cell Sorting Market Value (USD Mn) Forecast by End User, 2020-2035
  • Table 4: North America Fluorescence-Activated Cell Sorting Market Value (USD Mn) Forecast by Country, 2020-2035
  • Table 5: North America Fluorescence-Activated Cell Sorting Market Value (USD Mn) Forecast by Application , 2020-2035
  • Table 6: North America Fluorescence-Activated Cell Sorting Market Value (USD Mn) Forecast by End User, 2020-2035
  • Table 7: Latin America Fluorescence-Activated Cell Sorting Market Value (USD Mn) Forecast by Country, 2020-2035
  • Table 8: Latin America Fluorescence-Activated Cell Sorting Market Value (USD Mn) Forecast by Application , 2020-2035
  • Table 9: Latin America Fluorescence-Activated Cell Sorting Market Value (USD Mn) Forecast by End User, 2020-2035
  • Table 10: Western Europe Fluorescence-Activated Cell Sorting Market Value (USD Mn) Forecast by Country, 2020-2035
  • Table 11: Western Europe Fluorescence-Activated Cell Sorting Market Value (USD Mn) Forecast by Application , 2020-2035
  • Table 12: Western Europe Fluorescence-Activated Cell Sorting Market Value (USD Mn) Forecast by End User, 2020-2035
  • Table 13: Eastern Europe Fluorescence-Activated Cell Sorting Market Value (USD Mn) Forecast by Country, 2020-2035
  • Table 14: Eastern Europe Fluorescence-Activated Cell Sorting Market Value (USD Mn) Forecast by Application , 2020-2035
  • Table 15: Eastern Europe Fluorescence-Activated Cell Sorting Market Value (USD Mn) Forecast by End User, 2020-2035
  • Table 16: East Asia Fluorescence-Activated Cell Sorting Market Value (USD Mn) Forecast by Country, 2020-2035
  • Table 17: East Asia Fluorescence-Activated Cell Sorting Market Value (USD Mn) Forecast by Application , 2020-2035
  • Table 18: East Asia Fluorescence-Activated Cell Sorting Market Value (USD Mn) Forecast by End User, 2020-2035
  • Table 19: South Asia and Pacific Fluorescence-Activated Cell Sorting Market Value (USD Mn) Forecast by Country, 2020-2035
  • Table 20: South Asia and Pacific Fluorescence-Activated Cell Sorting Market Value (USD Mn) Forecast by Application , 2020-2035
  • Table 21: South Asia and Pacific Fluorescence-Activated Cell Sorting Market Value (USD Mn) Forecast by End User, 2020-2035
  • Table 22: Middle East & Africa Fluorescence-Activated Cell Sorting Market Value (USD Mn) Forecast by Country, 2020-2035
  • Table 23: Middle East & Africa Fluorescence-Activated Cell Sorting Market Value (USD Mn) Forecast by Application , 2020-2035
  • Table 24: Middle East & Africa Fluorescence-Activated Cell Sorting Market Value (USD Mn) Forecast by End User, 2020-2035

List of Figures

  • Figure 1: Global Fluorescence-Activated Cell Sorting Market Pricing Analysis
  • Figure 2: Global Fluorescence-Activated Cell Sorting Market Value (USD Mn) Forecast 2020-2035
  • Figure 3: Global Fluorescence-Activated Cell Sorting Market Value Share and BPS Analysis by Application , 2025 and 2035
  • Figure 4: Global Fluorescence-Activated Cell Sorting Market Y-o-Y Growth Comparison by Application , 2025-2035
  • Figure 5: Global Fluorescence-Activated Cell Sorting Market Attractiveness Analysis by Application
  • Figure 6: Global Fluorescence-Activated Cell Sorting Market Value Share and BPS Analysis by End User, 2025 and 2035
  • Figure 7: Global Fluorescence-Activated Cell Sorting Market Y-o-Y Growth Comparison by End User, 2025-2035
  • Figure 8: Global Fluorescence-Activated Cell Sorting Market Attractiveness Analysis by End User
  • Figure 9: Global Fluorescence-Activated Cell Sorting Market Value (USD Mn) Share and BPS Analysis by Region, 2025 and 2035
  • Figure 10: Global Fluorescence-Activated Cell Sorting Market Y-o-Y Growth Comparison by Region, 2025-2035
  • Figure 11: Global Fluorescence-Activated Cell Sorting Market Attractiveness Analysis by Region
  • Figure 12: North America Fluorescence-Activated Cell Sorting Market Incremental Dollar Opportunity, 2025-2035
  • Figure 13: Latin America Fluorescence-Activated Cell Sorting Market Incremental Dollar Opportunity, 2025-2035
  • Figure 14: Western Europe Fluorescence-Activated Cell Sorting Market Incremental Dollar Opportunity, 2025-2035
  • Figure 15: Eastern Europe Fluorescence-Activated Cell Sorting Market Incremental Dollar Opportunity, 2025-2035
  • Figure 16: East Asia Fluorescence-Activated Cell Sorting Market Incremental Dollar Opportunity, 2025-2035
  • Figure 17: South Asia and Pacific Fluorescence-Activated Cell Sorting Market Incremental Dollar Opportunity, 2025-2035
  • Figure 18: Middle East & Africa Fluorescence-Activated Cell Sorting Market Incremental Dollar Opportunity, 2025-2035
  • Figure 19: North America Fluorescence-Activated Cell Sorting Market Value Share and BPS Analysis by Country, 2025 and 2035
  • Figure 20: North America Fluorescence-Activated Cell Sorting Market Value Share and BPS Analysis by Application , 2025 and 2035
  • Figure 21: North America Fluorescence-Activated Cell Sorting Market Y-o-Y Growth Comparison by Application , 2025-2035
  • Figure 22: North America Fluorescence-Activated Cell Sorting Market Attractiveness Analysis by Application
  • Figure 23: North America Fluorescence-Activated Cell Sorting Market Value Share and BPS Analysis by End User, 2025 and 2035
  • Figure 24: North America Fluorescence-Activated Cell Sorting Market Y-o-Y Growth Comparison by End User, 2025-2035
  • Figure 25: North America Fluorescence-Activated Cell Sorting Market Attractiveness Analysis by End User
  • Figure 26: Latin America Fluorescence-Activated Cell Sorting Market Value Share and BPS Analysis by Country, 2025 and 2035
  • Figure 27: Latin America Fluorescence-Activated Cell Sorting Market Value Share and BPS Analysis by Application , 2025 and 2035
  • Figure 28: Latin America Fluorescence-Activated Cell Sorting Market Y-o-Y Growth Comparison by Application , 2025-2035
  • Figure 29: Latin America Fluorescence-Activated Cell Sorting Market Attractiveness Analysis by Application
  • Figure 30: Latin America Fluorescence-Activated Cell Sorting Market Value Share and BPS Analysis by End User, 2025 and 2035
  • Figure 31: Latin America Fluorescence-Activated Cell Sorting Market Y-o-Y Growth Comparison by End User, 2025-2035
  • Figure 32: Latin America Fluorescence-Activated Cell Sorting Market Attractiveness Analysis by End User
  • Figure 33: Western Europe Fluorescence-Activated Cell Sorting Market Value Share and BPS Analysis by Country, 2025 and 2035
  • Figure 34: Western Europe Fluorescence-Activated Cell Sorting Market Value Share and BPS Analysis by Application , 2025 and 2035
  • Figure 35: Western Europe Fluorescence-Activated Cell Sorting Market Y-o-Y Growth Comparison by Application , 2025-2035
  • Figure 36: Western Europe Fluorescence-Activated Cell Sorting Market Attractiveness Analysis by Application
  • Figure 37: Western Europe Fluorescence-Activated Cell Sorting Market Value Share and BPS Analysis by End User, 2025 and 2035
  • Figure 38: Western Europe Fluorescence-Activated Cell Sorting Market Y-o-Y Growth Comparison by End User, 2025-2035
  • Figure 39: Western Europe Fluorescence-Activated Cell Sorting Market Attractiveness Analysis by End User
  • Figure 40: Eastern Europe Fluorescence-Activated Cell Sorting Market Value Share and BPS Analysis by Country, 2025 and 2035
  • Figure 41: Eastern Europe Fluorescence-Activated Cell Sorting Market Value Share and BPS Analysis by Application , 2025 and 2035
  • Figure 42: Eastern Europe Fluorescence-Activated Cell Sorting Market Y-o-Y Growth Comparison by Application , 2025-2035
  • Figure 43: Eastern Europe Fluorescence-Activated Cell Sorting Market Attractiveness Analysis by Application
  • Figure 44: Eastern Europe Fluorescence-Activated Cell Sorting Market Value Share and BPS Analysis by End User, 2025 and 2035
  • Figure 45: Eastern Europe Fluorescence-Activated Cell Sorting Market Y-o-Y Growth Comparison by End User, 2025-2035
  • Figure 46: Eastern Europe Fluorescence-Activated Cell Sorting Market Attractiveness Analysis by End User
  • Figure 47: East Asia Fluorescence-Activated Cell Sorting Market Value Share and BPS Analysis by Country, 2025 and 2035
  • Figure 48: East Asia Fluorescence-Activated Cell Sorting Market Value Share and BPS Analysis by Application , 2025 and 2035
  • Figure 49: East Asia Fluorescence-Activated Cell Sorting Market Y-o-Y Growth Comparison by Application , 2025-2035
  • Figure 50: East Asia Fluorescence-Activated Cell Sorting Market Attractiveness Analysis by Application
  • Figure 51: East Asia Fluorescence-Activated Cell Sorting Market Value Share and BPS Analysis by End User, 2025 and 2035
  • Figure 52: East Asia Fluorescence-Activated Cell Sorting Market Y-o-Y Growth Comparison by End User, 2025-2035
  • Figure 53: East Asia Fluorescence-Activated Cell Sorting Market Attractiveness Analysis by End User
  • Figure 54: South Asia and Pacific Fluorescence-Activated Cell Sorting Market Value Share and BPS Analysis by Country, 2025 and 2035
  • Figure 55: South Asia and Pacific Fluorescence-Activated Cell Sorting Market Value Share and BPS Analysis by Application , 2025 and 2035
  • Figure 56: South Asia and Pacific Fluorescence-Activated Cell Sorting Market Y-o-Y Growth Comparison by Application , 2025-2035
  • Figure 57: South Asia and Pacific Fluorescence-Activated Cell Sorting Market Attractiveness Analysis by Application
  • Figure 58: South Asia and Pacific Fluorescence-Activated Cell Sorting Market Value Share and BPS Analysis by End User, 2025 and 2035
  • Figure 59: South Asia and Pacific Fluorescence-Activated Cell Sorting Market Y-o-Y Growth Comparison by End User, 2025-2035
  • Figure 60: South Asia and Pacific Fluorescence-Activated Cell Sorting Market Attractiveness Analysis by End User
  • Figure 61: Middle East & Africa Fluorescence-Activated Cell Sorting Market Value Share and BPS Analysis by Country, 2025 and 2035
  • Figure 62: Middle East & Africa Fluorescence-Activated Cell Sorting Market Value Share and BPS Analysis by Application , 2025 and 2035
  • Figure 63: Middle East & Africa Fluorescence-Activated Cell Sorting Market Y-o-Y Growth Comparison by Application , 2025-2035
  • Figure 64: Middle East & Africa Fluorescence-Activated Cell Sorting Market Attractiveness Analysis by Application
  • Figure 65: Middle East & Africa Fluorescence-Activated Cell Sorting Market Value Share and BPS Analysis by End User, 2025 and 2035
  • Figure 66: Middle East & Africa Fluorescence-Activated Cell Sorting Market Y-o-Y Growth Comparison by End User, 2025-2035
  • Figure 67: Middle East & Africa Fluorescence-Activated Cell Sorting Market Attractiveness Analysis by End User
  • Figure 68: Global Fluorescence-Activated Cell Sorting Market - Tier Structure Analysis
  • Figure 69: Global Fluorescence-Activated Cell Sorting Market - Company Share Analysis

Frequently Asked Questions

How big is the fluorescence-activated cell sorting market in 2025?

The global fluorescence-activated cell sorting market is estimated to be valued at USD 3.8 billion in 2025.

What will be the size of fluorescence-activated cell sorting market in 2035?

The market size for the fluorescence-activated cell sorting market is projected to reach USD 7.7 billion by 2035.

How much will be the fluorescence-activated cell sorting market growth between 2025 and 2035?

The fluorescence-activated cell sorting market is expected to grow at a 7.4% CAGR between 2025 and 2035.

What are the key product types in the fluorescence-activated cell sorting market?

The key product types in fluorescence-activated cell sorting market are immunology and cancer research, research applications of fluorescence-activated cell sorting, virology, clinical chemistry, drug delivery, others and clinical applications of fluorescence-activated cell sorting.

Which end user segment to contribute significant share in the fluorescence-activated cell sorting market in 2025?

In terms of end user, research institutes segment to command 52.8% share in the fluorescence-activated cell sorting market in 2025.

Explore Similar Insights

Future Market Insights

Fluorescence-Activated Cell Sorting Market

Chat With MaRIA

Chat With

MaRIA

Hi There, I am MaRIA, Your Market Research Intelligence Assistant. How may I help you?