Fusion Bag Market Analysis Size and Share Forecast Outlook 2025 to 2035

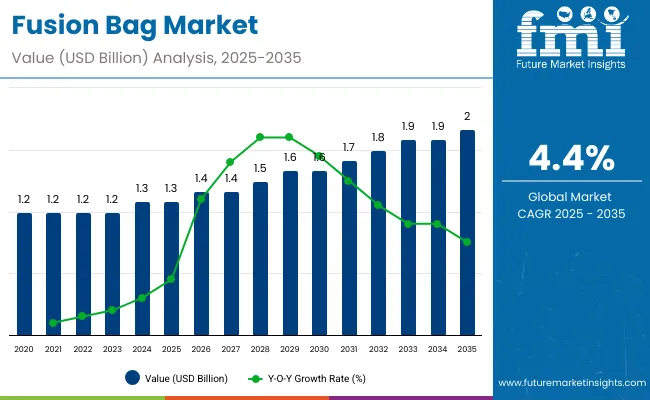
The fusion bag market is expected to grow from USD 1.3 billion in 2025 to USD 2.1 billion by 2035, resulting in a total increase of USD 0.8 billion over the forecast decade. This represents a 61.5% total expansion, with the market advancing at a compound annual growth rate (CAGR) of 4.4%. Over ten years, the market grows by a 1.6 multiple.
Quick Stats for Fusion Bag Market

  • Market Value (2025): USD 1.3 billion
  • Market Forecast Value (2035): USD 2.1 billion
  • Market Forecast CAGR: 4.4%
  • Leading Segment in 2025: Single-use Fusion Bag (47.6%)
  • Key Growth Regions: Asia-Pacific (India is the fastest-growing market with 5.1% CAGR)
  • Top Key Players: Rishi FIBC Solutions, AmeriGlobe LLC, HPBL, Global-Pak, Inc., Bulk Lift International, LLC, Bulk Containers India Pvt Ltd.

Fusion Bag Market

Metric Value
Industry Size (2025E) USD 1.3 billion
Industry Value (2035F) USD 2.1 billion
CAGR (2025 to 2035) 4.4%

In the first five years (2025-2030), the market progresses from USD 1.3 billion to USD 1.6 billion, contributing USD 0.3 billion, or 37.5% of total decade growth. This phase is shaped by adoption in biopharmaceutical mixing and liquid transfer, driven by the need for sterility and contamination-free handling. Increasing demand from vaccine manufacturers further supports expansion.

In the second half (2030-2035), the market grows from USD 1.6 billion to USD 2.1 billion, adding USD 0.5 billion, or 62.5% of the total growth. This acceleration is supported by automation in cell culture processes, multi-layer film innovations, and growing CMO outsourcing. Rising focus on single-use sterile storage and flexible capacity expansion in biologics manufacturing makes fusion bags central to the bioprocessing supply chain.

From 2020 to 2024, the fusion bag market expanded from USD 1.0 billion to USD 1.2 billion, driven by the growing adoption of sterile, single-use systems in biopharmaceutical manufacturing. Over 65% of revenue was controlled by established OEMs offering standardized bag assemblies for liquid transfer and cell culture. Leaders such as Sartorius, Thermo Fisher Scientific, and Pall Corporation emphasized sterile integrity, gamma irradiation validation, and secure fluid pathways. Differentiation relied on film compatibility, scalability across volumes, and assurance of sterility, while advanced monitoring sensors remained secondary features. Service-based validation and sterilization audits accounted for under 15% of total market value, with most clients prioritizing upfront capital procurement.

By 2035, the fusion bag market will reach USD 2.1 billion, growing at a CAGR of 4.40%, with software-integrated bag systems and automation accounting for over 40% of value. Competition will increase as new players deliver modular multi-use systems, IoT-enabled sterility tracking, and predictive monitoring for bioprocess consistency. Established companies are shifting toward hybrid models, embedding digital twin platforms, automated leak detection, and traceable sterilization mapping. Emerging entrants such as GEA Group, ILC Dover, and Meissner Filtration are gaining traction with recyclable materials, advanced biocompatibility, and enhanced scalability for vaccine manufacturing, gene therapies, and biologics production.

Why is the Fusion Bag Market growing?

The rising adoption of single-use bioprocessing systems in the pharmaceutical and biotechnology industries is driving growth in the fusion bag market. These bags ensure sterility, reduce contamination risks, and streamline fluid handling processes. Growing vaccine production, biologics manufacturing, and expansion of contract manufacturing organizations are key factors supporting demand.

Fusion bags featuring medical-grade films, gamma sterilization compatibility, and robust sealing technologies are gaining popularity for their ability to maintain product integrity during storage and transport. Their scalability, easy integration into automated systems, and reduced cleaning requirements support operational efficiency. Sustainability trends favouring lightweight, disposable solutions further reinforce their adoption in global bioprocessing applications.

Segmental Analysis

The market is segmented by type, material, application, capacity, end use, and region. Type segmentation includes single-use and multi-use fusion bags, meeting varied bioprocessing requirements for sterility and cost efficiency. Material covers medical-grade PE, multi-layer film, and TPU, providing durability, barrier performance, and chemical resistance. Applications include biopharmaceutical mixing, liquid transfer, cell culture, and sterile storage, ensuring compliance with stringent process standards. Capacity segmentation spans <5L, 5-50L, 50-500L, and 500L, supporting scalability across R&D and commercial manufacturing. End-use industries include biotech companies, CMOs, and vaccine manufacturers. Regionally, the market is segmented into North America, Europe, Asia-Pacific, Latin America, and the Middle East & Africa.
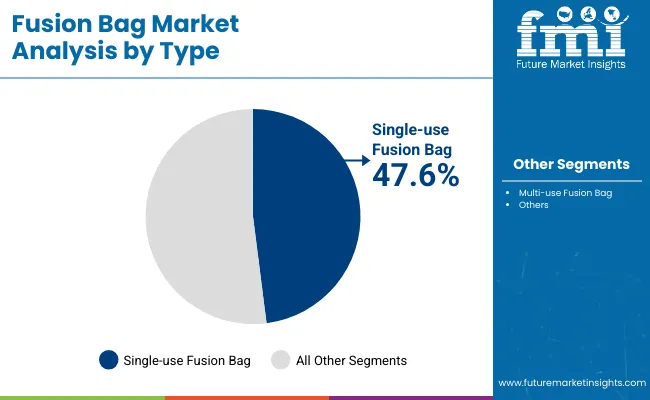
Single-Use Fusion Bags Dominate with Cost-Effectiveness and Contamination Control

Fusion Bag Market By Type

Single-use fusion bags are projected to account for 47.6% of the market in 2025, driven by their ability to reduce cross-contamination risks and cleaning costs. These disposable solutions eliminate the need for sterilization between uses, ensuring operational efficiency in biopharmaceutical production. Their adoption is widespread in facilities requiring flexibility across multiple product batches.

The surge in biologics and personalized medicine production reinforces demand for single-use formats. They allow quick setup, rapid turnaround, and scalability in pilot to commercial operations. Their compatibility with sterile connectors and manifolds further supports use in GMP-compliant environments, making them a standard in modern bioprocessing workflows.
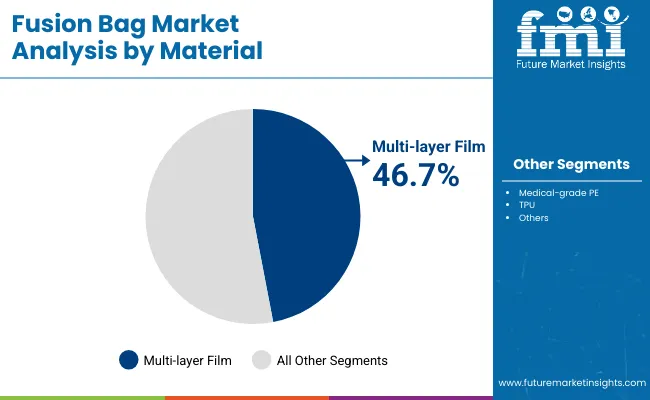
Multi-Layer Films Lead Materials with Enhanced Durability and Barrier Strength

Fusion Bag Market By Material

Multi-layer films are forecast to capture 46.7% of the market in 2025, as they combine polymer layers to deliver superior strength and chemical resistance. These films enhance puncture resistance and protect against leachable, ensuring integrity during storage and transport of sensitive biologics.

Their adoption is supported by the growing complexity of biopharmaceutical formulations requiring higher stability. Multi-layer construction enables optimal gas barrier performance while maintaining transparency for visual inspection. As regulatory expectations for packaging quality intensify, multi-layer films provide assurance of product safety and compliance.
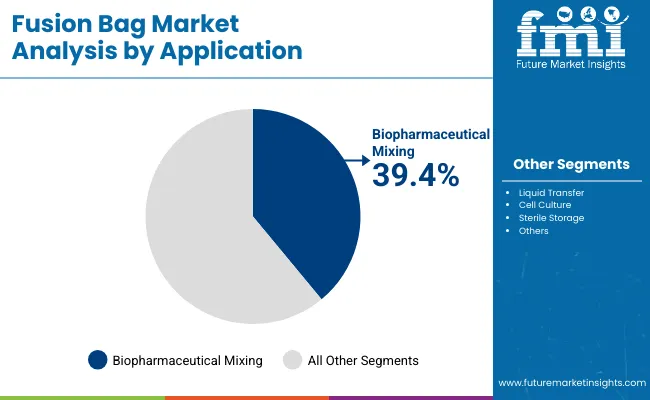
Biopharmaceutical Mixing Leads Applications with Strong Process Demand

Fusion Bag Market By Application

Biopharmaceutical mixing is expected to represent 39.4% of market share in 2025, as fusion bags provide sterile, closed systems for critical upstream and downstream processes. They enable homogenous mixing of cell cultures, buffers, and media with reduced contamination risks compared to open systems.

Their ease of integration with single-use mixers and sensors makes them indispensable in biomanufacturing. Demand is reinforced by the need for scalable solutions that support batch flexibility and reduced cleaning validation requirements. This makes biopharmaceutical mixing the most prominent application in single-use technology adoption.
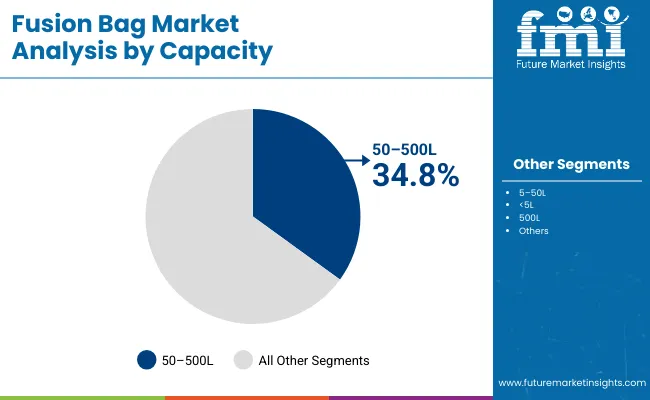
Mid-Range Capacity (50-500L) Gains with Flexibility Across Production Scales

Fusion Bag Market Capacity

Bags with 50-500L capacity are projected to hold 34.8% of the market in 2025, balancing scalability and operational efficiency. These mid-range formats are widely adopted in pilot-scale production and clinical manufacturing, where frequent product changeovers are common.

Their modularity allows seamless transition from R&D to commercial-scale manufacturing without infrastructure overhauls. They provide sufficient volume for production while remaining manageable in handling and installation. This makes them a preferred option for facilities producing multiple biologic products in parallel.
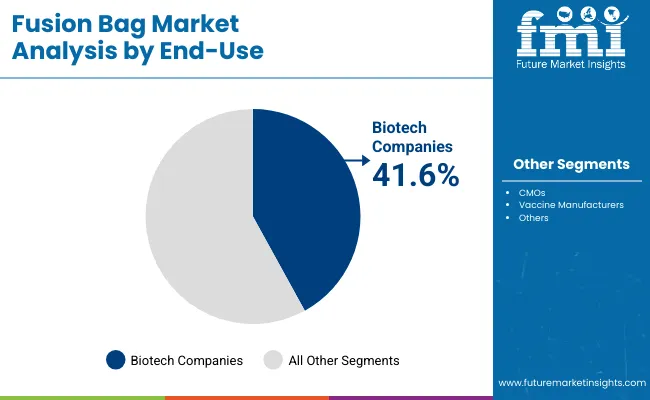
Biotech Companies Lead End-Use with Strong Innovation and Product Pipelines

Fusion Bag Market End Use

Biotech companies are forecast to account for 41.6% of demand in 2025, as their expanding pipelines of biologics and cell therapies rely heavily on single-use systems. Fusion bags support flexibility in production, enabling companies to accelerate time-to-market for new treatments.

Adoption is reinforced by venture-backed funding and partnerships that prioritize scalable manufacturing infrastructure. These companies value the reduced capital expenditure associated with single-use bags compared to stainless-steel systems. As biologics and advanced therapies grow, biotech firms remain the key drivers of fusion bag adoption globally.

What are the Drivers, Restraints, and Key Trends of the Fusion Bag Market?

The fusion bag market is growing as biopharmaceutical companies adopt single-use and multi-use bags for sterile liquid handling, storage, and transport. These bags offer contamination control, scalability, and flexibility compared to stainless-steel systems. However, high validation costs and material compatibility issues restrain adoption. Advances in multi-layer films, automation-friendly formats, and sustainable bioprocessing are shaping the market’s next growth phase.

Sterility Assurance, Flexibility, and Bioprocess Efficiency Driving Adoption

Fusion bags are increasingly used in cell culture, vaccine manufacturing, and biopharmaceutical mixing due to their sterile and closed-system operation. Their single-use design reduces cleaning requirements, cross-contamination risks, and turnaround time, improving overall production efficiency. The flexibility to scale from small lab volumes to large commercial batches enhances their utility across R&D and manufacturing. Integration with automated mixing systems further optimizes process reliability. These benefits make fusion bags essential for biologics and personalized medicine production.

High Validation Costs, Supply Risks, and Material Limitations Restraining Growth

Adoption faces hurdles as biopharma firms must invest heavily in validating fusion bag systems for regulatory compliance. Material compatibility with solvents, buffers, and culture media can limit their use in certain processes. Dependence on a few suppliers creates supply chain vulnerabilities, as shortages or delays can disrupt production timelines. High costs compared to traditional equipment deter smaller biotech firms from large-scale implementation. Additionally, disposal of single-use plastic bags raises environmental and regulatory concerns in some regions.

Multi-layer Films, Automation Integration, and Sustainability Trends Emerging

Key trends include the development of advanced multi-layer films that enhance durability, chemical resistance, and oxygen barrier properties. Automation integration is accelerating, with fusion bags increasingly designed for compatibility with automated filling, mixing, and monitoring systems. Sustainability initiatives are driving interest in recyclable or biodegradable polymer materials. Customizable bag capacities and modular systems provide flexibility across applications from lab-scale research to large vaccine manufacturing. These innovations are positioning fusion bags as critical enablers of efficient, scalable, and eco-conscious bioprocessing solutions.
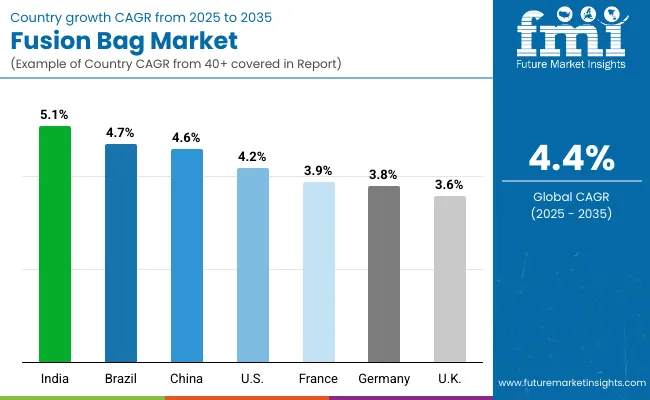
Analysis of Fusion Bag Market by Key Countries

Fusion Bag Market By Country

The global fusion bag market is steadily expanding, driven by demand in biopharmaceutical manufacturing, vaccine production, and cell culture applications. Asia-Pacific is emerging as a growth hotspot, with India and China leading adoption due to strong investments in life sciences infrastructure and biologics production. Developed markets such as the USA, Germany, and Japan remain innovation leaders, advancing sterile, multi-layer bag technologies and automation to ensure efficiency, regulatory compliance, and consistent product quality across diverse bioprocessing applications worldwide.
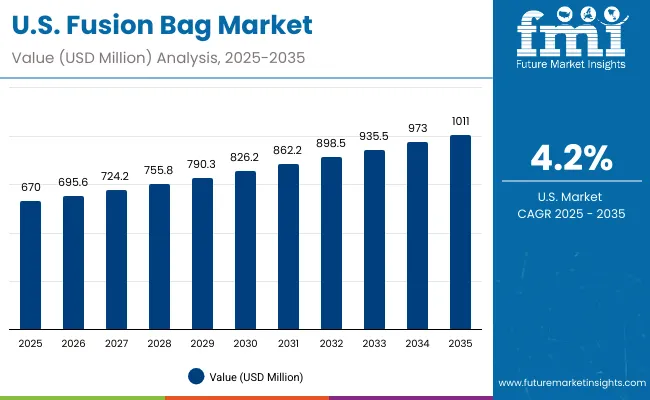
Sales Outlook for Fusion Bag Market United States

Fusion Bag Market Usa

The USA market is projected to grow at a CAGR of 4.2% from 2025 to 2035, driven by strong demand from biotech firms, CMOs, and vaccine manufacturers. Growth is supported by high adoption of sterile, disposable systems that reduce cross-contamination and meet FDA compliance. Investments in automation and AI-driven monitoring are enhancing production reliability. Vendors are focusing on customized, scalable fusion bags with integrated sterile connectors to meet evolving industry needs for flexible bioprocessing environments.
  • Biotech companies deploy fusion bags to streamline vaccine and therapeutic production.
  • CMOs use sterile disposable bags for multi-product manufacturing flexibility.
  • OEMs develop AI-integrated bags ensuring real-time monitoring and compliance.

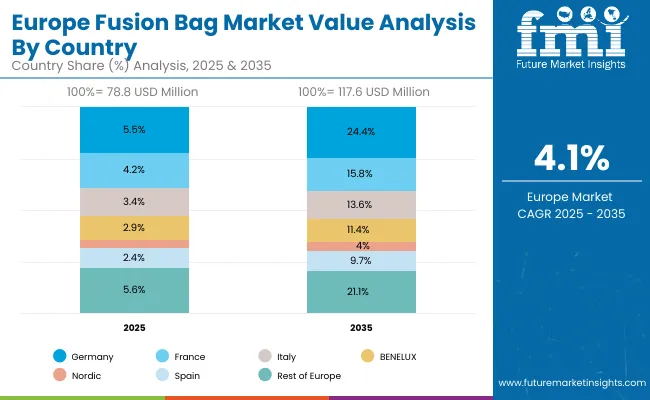
Growth Outlook for Fusion Bag Market Germany

Fusion Bag Market Europe

Germany’s market is expected to grow at a CAGR of 3.8%, anchored by its advanced pharmaceutical and biotechnology industries. Fusion bags are being adopted for sterile storage, cell culture, and large-scale mixing processes. Rising emphasis on modular, contamination-free solutions is driving demand. German OEMs are also investing in predictive maintenance features and eco-friendly materials. The market is shaped by strict EU regulatory compliance, requiring robust sterilization, traceability, and GMP-certified production systems across laboratories and manufacturing plants.

  • Pharma producers integrate fusion bags for sterile cell culture expansion.
  • German OEMs design modular bags with contamination control features.
  • EU regulations drive demand for traceable, GMP-certified disposable systems.

Expansion Outlook for Fusion Bag Market United Kingdom

The UK market is forecast to grow at a CAGR of 3.6%, supported by a strong pipeline of biologics, contract research, and vaccine development programs. Fusion bags are being used for liquid transfer, storage, and sterile mixing applications in both established firms and startups. Demand is further supported by government-backed healthcare R&D funding. Local suppliers are innovating compact, flexible bags designed to minimize downtime and cleaning costs, aligning with GMP and export requirements in biopharma.

  • Biologics developers rely on fusion bags for sterile transfer operations.
  • Startups adopt disposable bags to scale vaccine development quickly.
  • OEMs provide flexible bag formats reducing downtime in GMP facilities.

Sales Outlook for Fusion Bag Market China

China’s market is projected to grow at a CAGR of 4.6%, fuelled by government investments in biotechnology and pharmaceutical manufacturing. Fusion bags are widely used in vaccine production and biopharmaceutical mixing due to their sterility and scalability. Local manufacturers are scaling production of affordable, high-quality bags to meet rising demand. Government policies encouraging domestic production of biologics are supporting strong market adoption. Increased R&D in cell culture applications also contributes to steady expansion in the region.

  • Vaccine manufacturers deploy bags for high-volume sterile production lines.
  • Local OEMs scale affordable bag solutions to meet domestic demand.
  • Government incentives promote wider adoption in biologics manufacturing.

Growth Outlook for Fusion Bag Market India

India is forecast to record the fastest growth at a CAGR of 5.1%, driven by rapid expansion of biopharmaceutical exports, vaccine manufacturing, and contract production services. Fusion bags are being increasingly used for sterile storage, mixing, and transport of sensitive liquids. Startups and SMEs are adopting cost-effective disposable bag systems to replace stainless steel. Export-focused players demand solutions meeting stringent global compliance standards, pushing OEMs to deliver high-performance, single-use bag technologies at competitive pricing.
  • Vaccine firms adopt bags for efficient sterile liquid storage and mixing.
  • SMEs prefer disposable bags to reduce cleaning and sterilization costs.
  • Exporters demand compliant bags meeting FDA and EMA requirements.

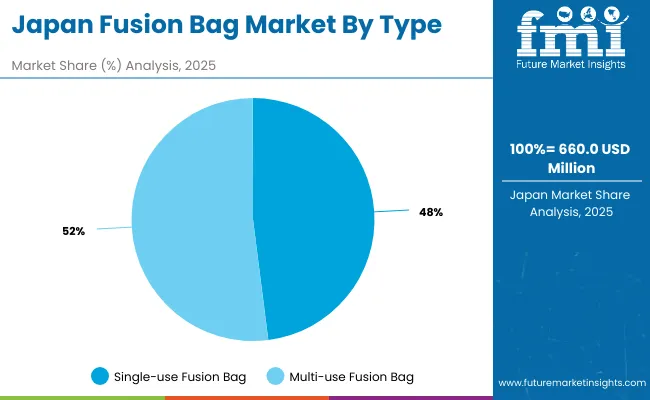
Growth Outlook for Fusion Bag Market Japan

Fusion Bag Market Japan

Japan’s market is projected to grow at a CAGR of 4.1%, with rising use of fusion bags in enzyme production, cell therapy, and fermentation. Companies are adopting sterile, UV-resistant materials to improve product longevity and safety. Precision-focused innovations are enhancing reliability in pharmaceutical environments. The demand for compact, multi-use designs is increasing in small-scale labs, while large firms emphasize automation-compatible bag systems for industrial-scale production. Regulatory adherence and high-quality standards shape product offerings in the Japanese market.
  • Biotech labs integrate fusion bags for enzyme and cell therapy research.
  • Firms adopt UV-resistant bags ensuring sterility and long-term reliability.
  • OEMs design automation-compatible bags for large-scale manufacturing plants.

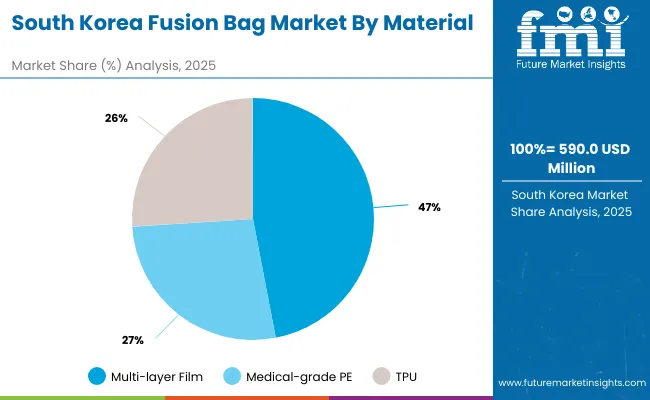
Expansion Outlook for Fusion Bag Market South Korea

Fusion Bag Market South Korea

South Korea’s market is expected to grow at a CAGR of 3.5%, led by demand from biologics, ginseng-based healthcare, and contract manufacturing services. Fusion bags are widely used for sterile mixing, storage, and transfer of biopharmaceutical liquids. Local firms are developing compact, disposable formats aligned with global GMP compliance standards. Growing export opportunities in biosimilars and vaccines are boosting adoption. Enhanced collaboration between Korean biotech companies and global pharmaceutical firms is also shaping market growth.
  • Biologics firms adopt bags for sterile storage and transport of liquids.
  • Local OEMs provide cost-effective disposable bag formats for GMP use.
  • Vaccine producers expand demand with export-driven production requirements.

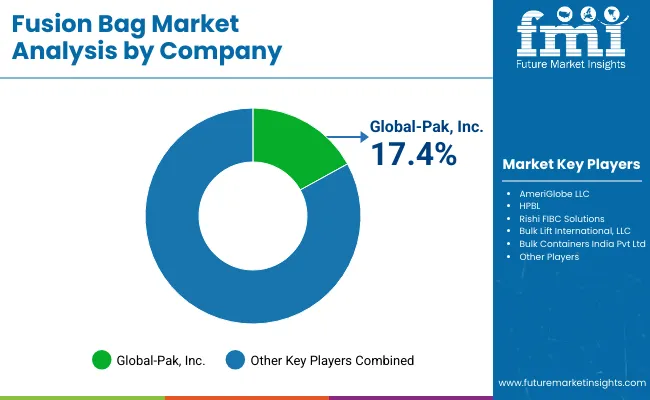
Competitive Landscape of Fusion Bag Market

Fusion Bag Market By Company

The fusion bag market is moderately fragmented, with bulk packaging manufacturers, polymer specialists, and container solution providers competing across biopharmaceutical, chemical, and food-grade applications. Global leaders such as Rishi FIBC Solutions, AmeriGlobe LLC, and HPBL hold notable market share, driven by durable medical-grade polymers, sterile construction, and adherence to FDA and EU regulatory standards. Their strategies increasingly emphasize capacity scalability, contamination-free handling, and integration with automated filling and transfer systems.

Established mid-sized players including Global-Pak, Inc. and Bulk Lift International, LLC are supporting adoption of multi-use fusion bags featuring reinforced seams, anti-leakage valves, and multi-layer barrier films. These companies are especially active in vaccine storage, bioreactor feeds, and chemical transfer, offering tailored designs, flexible capacities, and enhanced puncture resistance to meet stringent industry requirements.

Specialized regional producers such as Bulk Containers India Pvt Ltd focus on customized solutions for biotechnology firms and contract manufacturers. Their strengths lie in cost-effective engineering, rapid prototyping, and integration with cold chain systems for temperature-sensitive products, ensuring reliable sterility, extended shelf stability, and compatibility with evolving pharmaceutical and bioprocessing demands.

Key Development of Fusion Bag Market

  • On August 18, 2025, Rishi FIBC’s official blog published a detailed post titled “Fusion Bags for Complex Bulk Packaging”, emphasizing their use in food processing, nutraceuticals, fine chemicals, and powder metallurgy. The blog highlights benefit like leak prevention, faster filling/discharging, sustainability, and compliance with HACCP and GMP standards.
  • In July 2024, AmeriGlobe's official product and innovation pages confirm that its Fusion Bulk Bag technology has undergone extensive quality validation, thousands of bags have been tested, and the design is locked in via a computer-controlled manufacturing process ensuring consistent production. Furthermore, every bag is subjected to non-destructive load testing to verify bond strength before shipping.

Key Companies

  • Rishi FIBC Solutions
  • AmeriGlobe LLC
  • HPBL
  • Global-Pak, Inc.
  • Bulk Lift International, LLC
  • Bulk Containers India Pvt Ltd

Scope of Report

Item Value
Quantitative Units USD 1.3 Billion
By Type Single-use Fusion Bag, Multi-use Fusion Bag
By Material Medical-grade PE, Multi-layer Film, TPU
By Application Biopharmaceutical Mixing, Liquid Transfer, Cell Culture, Sterile Storage
By Capacity <5L, 5-50L, 50-500L, 500L
By End-Use Biotech Companies, CMOs, Vaccine Manufacturers
Key Companies Profiled Rishi FIBC Solutions, AmeriGlobe LLC, HPBL, Global-Pak, Inc., Bulk Lift International, LLC, Bulk Containers India Pvt Ltd
Additional Attributes Increasing adoption of single-use bags in bioprocessing for contamination control, preference for multi-layer films to enhance durability and sterility, strong demand from CMOs and biotech companies for scalable storage and mixing solutions, integration of TPU materials for flexibility and chemical resistance, and growing utilization in vaccine production to meet global immunization and pandemic preparedness needs.

Key Segmentation

By Type:

  • Single-use Fusion Bag
  • Multi-use Fusion Bag

By Material:

  • Medical-grade PE
  • Multi-layer Film
  • TPU

By Application:

  • Biopharmaceutical Mixing
  • Liquid Transfer
  • Cell Culture
  • Sterile Storage

By Capacity:

  • <5L
  • 5–50L
  • 50–500L
  • 500L

By End-Use:

  • Biotech Companies
  • CMOs
  • Vaccine Manufacturers

By Region:

  • North America
  • Europe
  • Asia-Pacific
  • Latin America
  • Middle East & Africa

Table of Content

  1. Executive Summary
    • Global Market Outlook
    • Demand-side Trends
    • Supply-side Trends
    • Technology Roadmap Analysis
    • Analysis and Recommendations
  2. Market Overview
    • Market Coverage / Taxonomy
    • Market Definition / Scope / Limitations
  3. Market Background
    • Market Dynamics
      • Drivers
      • Restraints
      • Opportunity
      • Trends
    • Scenario Forecast
      • Demand in Optimistic Scenario
      • Demand in Likely Scenario
      • Demand in Conservative Scenario
    • Opportunity Map Analysis
    • Product Life Cycle Analysis
    • Supply Chain Analysis
      • Supply Side Participants and their Roles
        • Producers
        • Mid-Level Participants (Traders/ Agents/ Brokers)
        • Wholesalers and Distributors
      • Value Added and Value Created at Node in the Supply Chain
      • List of Raw Material Suppliers
      • List of Existing and Potential Buyer’s
    • Investment Feasibility Matrix
    • Value Chain Analysis
      • Profit Margin Analysis
      • Wholesalers and Distributors
      • Retailers
    • PESTLE and Porter’s Analysis
    • Regulatory Landscape
      • By Key Regions
      • By Key Countries
    • Regional Parent Market Outlook
    • Production and Consumption Statistics
    • Import and Export Statistics
  4. Global Market Analysis 2020 to 2024 and Forecast, 2025 to 2035
    • Historical Market Size Value (USD Billion) & Volume (Units) Analysis, 2020 to 2024
    • Current and Future Market Size Value (USD Billion) & Volume (Units) Projections, 2025 to 2035
      • Y-o-Y Growth Trend Analysis
      • Absolute $ Opportunity Analysis
  5. Global Market Pricing Analysis 2020 to 2024 and Forecast 2025 to 2035
  6. Global Market Analysis 2020 to 2024 and Forecast 2025 to 2035, By Type
    • Introduction / Key Findings
    • Historical Market Size Value (USD Billion) & Volume (Units) Analysis By Type, 2020 to 2024
    • Current and Future Market Size Value (USD Billion) & Volume (Units) Analysis and Forecast By Type, 2025 to 2035
      • Single-use
      • Multi-use
    • Y-o-Y Growth Trend Analysis By Type, 2020 to 2024
    • Absolute $ Opportunity Analysis By Type, 2025 to 2035
  7. Global Market Analysis 2020 to 2024 and Forecast 2025 to 2035, By Material
    • Introduction / Key Findings
    • Historical Market Size Value (USD Billion) & Volume (Units) Analysis By Material, 2020 to 2024
    • Current and Future Market Size Value (USD Billion) & Volume (Units) Analysis and Forecast By Material, 2025 to 2035
      • Multi-layer Film
      • Medical-grade PE
      • TPU
    • Y-o-Y Growth Trend Analysis By Material, 2020 to 2024
    • Absolute $ Opportunity Analysis By Material, 2025 to 2035
  8. Global Market Analysis 2020 to 2024 and Forecast 2025 to 2035, By Application
    • Introduction / Key Findings
    • Historical Market Size Value (USD Billion) & Volume (Units) Analysis By Application, 2020 to 2024
    • Current and Future Market Size Value (USD Billion) & Volume (Units) Analysis and Forecast By Application, 2025 to 2035
      • Biopharmaceutical Mixing
      • Liquid Transfer
      • Cell Culture
      • Sterile Storage
    • Y-o-Y Growth Trend Analysis By Application, 2020 to 2024
    • Absolute $ Opportunity Analysis By Application, 2025 to 2035
  9. Global Market Analysis 2020 to 2024 and Forecast 2025 to 2035, By Capacity
    • Introduction / Key Findings
    • Historical Market Size Value (USD Billion) & Volume (Units) Analysis By Capacity, 2020 to 2024
    • Current and Future Market Size Value (USD Billion) & Volume (Units) Analysis and Forecast By Capacity, 2025 to 2035
      • 50-500L
      • 5-50L
      • <5L
      • 500L
    • Y-o-Y Growth Trend Analysis By Capacity, 2020 to 2024
    • Absolute $ Opportunity Analysis By Capacity, 2025 to 2035
  10. Global Market Analysis 2020 to 2024 and Forecast 2025 to 2035, By End-Use
    • Introduction / Key Findings
    • Historical Market Size Value (USD Billion) & Volume (Units) Analysis By End-Use, 2020 to 2024
    • Current and Future Market Size Value (USD Billion) & Volume (Units) Analysis and Forecast By End-Use, 2025 to 2035
      • Biotech Companies
      • CMOs
      • Vaccine Manufacturers
    • Y-o-Y Growth Trend Analysis By End-Use, 2020 to 2024
    • Absolute $ Opportunity Analysis By End-Use, 2025 to 2035
  11. Global Market Analysis 2020 to 2024 and Forecast 2025 to 2035, By Region
    • Introduction
    • Historical Market Size Value (USD Billion) & Volume (Units) Analysis By Region, 2020 to 2024
    • Current Market Size Value (USD Billion) & Volume (Units) Analysis and Forecast By Region, 2025 to 2035
      • North America
      • Latin America
      • Europe
      • East Asia
      • South Asia
      • Oceania
      • MEA
    • Market Attractiveness Analysis By Region
  12. North America Market Analysis 2020 to 2024 and Forecast 2025 to 2035, By Country
    • Historical Market Size Value (USD Billion) & Volume (Units) Trend Analysis By Market Taxonomy, 2020 to 2024
    • Market Size Value (USD Billion) & Volume (Units) Forecast By Market Taxonomy, 2025 to 2035
      • By Country
        • USA
        • Canada
      • By Type
      • By Material
      • By Application
      • By Capacity
      • By End-Use
    • Market Attractiveness Analysis
      • By Country
      • By Type
      • By Material
      • By Application
      • By Capacity
      • By End-Use
    • Key Takeaways
  13. Latin America Market Analysis 2020 to 2024 and Forecast 2025 to 2035, By Country
    • Historical Market Size Value (USD Billion) & Volume (Units) Trend Analysis By Market Taxonomy, 2020 to 2024
    • Market Size Value (USD Billion) & Volume (Units) Forecast By Market Taxonomy, 2025 to 2035
      • By Country
        • Brazil
        • Mexico
        • Argentina
        • Chile
        • Peru
        • Rest of Latin America
      • By Type
      • By Material
      • By Application
      • By Capacity
      • By End-Use
    • Market Attractiveness Analysis
      • By Country
      • By Type
      • By Material
      • By Application
      • By Capacity
      • By End-Use
    • Key Takeaways
  14. Europe Market Analysis 2020 to 2024 and Forecast 2025 to 2035, By Country
    • Historical Market Size Value (USD Billion) & Volume (Units) Trend Analysis By Market Taxonomy, 2020 to 2024
    • Market Size Value (USD Billion) & Volume (Units) Forecast By Market Taxonomy, 2025 to 2035
      • By Country
        • Germany
        • Italy
        • France
        • UK
        • Spain
        • Russia
        • BENELUX
        • Rest of Europe
      • By Type
      • By Material
      • By Application
      • By Capacity
      • By End-Use
    • Market Attractiveness Analysis
      • By Country
      • By Type
      • By Material
      • By Application
      • By Capacity
      • By End-Use
    • Key Takeaways
  15. East Asia Market Analysis 2020 to 2024 and Forecast 2025 to 2035, By Country
    • Historical Market Size Value (USD Billion) & Volume (Units) Trend Analysis By Market Taxonomy, 2020 to 2024
    • Market Size Value (USD Billion) & Volume (Units) Forecast By Market Taxonomy, 2025 to 2035
      • By Country
        • China
        • Japan
        • South Korea
      • By Type
      • By Material
      • By Application
      • By Capacity
      • By End-Use
    • Market Attractiveness Analysis
      • By Country
      • By Type
      • By Material
      • By Application
      • By Capacity
      • By End-Use
    • Key Takeaways
  16. South Asia Market Analysis 2020 to 2024 and Forecast 2025 to 2035, By Country
    • Historical Market Size Value (USD Billion) & Volume (Units) Trend Analysis By Market Taxonomy, 2020 to 2024
    • Market Size Value (USD Billion) & Volume (Units) Forecast By Market Taxonomy, 2025 to 2035
      • By Country
        • India
        • Thailand
        • Malaysia
        • Indonesia
        • Rest of South Asia
      • By Type
      • By Material
      • By Application
      • By Capacity
      • By End-Use
    • Market Attractiveness Analysis
      • By Country
      • By Type
      • By Material
      • By Application
      • By Capacity
      • By End-Use
    • Key Takeaways
  17. Oceania Market Analysis 2020 to 2024 and Forecast 2025 to 2035, By Country
    • Historical Market Size Value (USD Billion) & Volume (Units) Trend Analysis By Market Taxonomy, 2020 to 2024
    • Market Size Value (USD Billion) & Volume (Units) Forecast By Market Taxonomy, 2025 to 2035
      • By Country
        • Australia
        • New Zealand
      • By Type
      • By Material
      • By Application
      • By Capacity
      • By End-Use
    • Market Attractiveness Analysis
      • By Country
      • By Type
      • By Material
      • By Application
      • By Capacity
      • By End-Use
    • Key Takeaways
  18. MEA Market Analysis 2020 to 2024 and Forecast 2025 to 2035, By Country
    • Historical Market Size Value (USD Billion) & Volume (Units) Trend Analysis By Market Taxonomy, 2020 to 2024
    • Market Size Value (USD Billion) & Volume (Units) Forecast By Market Taxonomy, 2025 to 2035
      • By Country
        • GCC
        • Rest of MEA
      • By Type
      • By Material
      • By Application
      • By Capacity
      • By End-Use
    • Market Attractiveness Analysis
      • By Country
      • By Type
      • By Material
      • By Application
      • By Capacity
      • By End-Use
    • Key Takeaways
  19. Key Countries Market Analysis
    • USA
      • Pricing Analysis
      • Market Share Analysis, 2024
        • By Type
        • By Material
        • By Application
        • By Capacity
        • By End-Use
    • Canada
      • Pricing Analysis
      • Market Share Analysis, 2024
        • By Type
        • By Material
        • By Application
        • By Capacity
        • By End-Use
    • Brazil
      • Pricing Analysis
      • Market Share Analysis, 2024
        • By Type
        • By Material
        • By Application
        • By Capacity
        • By End-Use
    • Mexico
      • Pricing Analysis
      • Market Share Analysis, 2024
        • By Type
        • By Material
        • By Application
        • By Capacity
        • By End-Use
    • Argentina
      • Pricing Analysis
      • Market Share Analysis, 2024
        • By Type
        • By Material
        • By Application
        • By Capacity
        • By End-Use
  20. Market Structure Analysis
    • Competition Dashboard
    • Competition Benchmarking
    • Market Share Analysis of Top Players
      • By Regional
      • By Type
      • By Material
      • By Application
      • By Capacity
      • By End-Use
  21. Competition Analysis
    • Competition Deep Dive
      • Rishi FIBC Solutions
        • Overview
        • Product Portfolio
        • Profitability by Market Segments (Product/Age /Sales Channel/Region)
        • Sales Footprint
        • Strategy Overview
          • Marketing Strategy
          • Product Strategy
          • Channel Strategy
      • AmeriGlobe LLC
        • Overview
        • Product Portfolio
        • Profitability by Market Segments (Product/Age /Sales Channel/Region)
        • Sales Footprint
        • Strategy Overview
          • Marketing Strategy
          • Product Strategy
          • Channel Strategy
      • HPBL
        • Overview
        • Product Portfolio
        • Profitability by Market Segments (Product/Age /Sales Channel/Region)
        • Sales Footprint
        • Strategy Overview
          • Marketing Strategy
          • Product Strategy
          • Channel Strategy
      • Global-Pak, Inc.
        • Overview
        • Product Portfolio
        • Profitability by Market Segments (Product/Age /Sales Channel/Region)
        • Sales Footprint
        • Strategy Overview
          • Marketing Strategy
          • Product Strategy
          • Channel Strategy
      • Bulk Lift International, LLC
        • Overview
        • Product Portfolio
        • Profitability by Market Segments (Product/Age /Sales Channel/Region)
        • Sales Footprint
        • Strategy Overview
          • Marketing Strategy
          • Product Strategy
          • Channel Strategy
      • Bulk Containers India Pvt Ltd
        • Overview
        • Product Portfolio
        • Profitability by Market Segments (Product/Age /Sales Channel/Region)
        • Sales Footprint
        • Strategy Overview
          • Marketing Strategy
          • Product Strategy
          • Channel Strategy
  22. Assumptions & Acronyms Used
  23. Research Methodology

List of Tables

  • Table 1: Global Market Value (USD Billion) Forecast by Region, 2020-2035
  • Table 2: Global Market Volume (Units) Forecast by Region, 2020-2035
  • Table 3: Global Market Value (USD Billion) Forecast by Type, 2020-2035
  • Table 4: Global Market Volume (Units) Forecast by Type, 2020-2035
  • Table 5: Global Market Value (USD Billion) Forecast by Material, 2020-2035
  • Table 6: Global Market Volume (Units) Forecast by Material, 2020-2035
  • Table 7: Global Market Value (USD Billion) Forecast by Application, 2020-2035
  • Table 8: Global Market Volume (Units) Forecast by Application, 2020-2035
  • Table 9: Global Market Value (USD Billion) Forecast by Capacity, 2020-2035
  • Table 10: Global Market Volume (Units) Forecast by Capacity, 2020-2035
  • Table 11: Global Market Value (USD Billion) Forecast by End-Use, 2020-2035
  • Table 12: Global Market Volume (Units) Forecast by End-Use, 2020-2035
  • Table 13: North America Market Value (USD Billion) Forecast by Country, 2020-2035
  • Table 14: North America Market Volume (Units) Forecast by Country, 2020-2035
  • Table 15: North America Market Value (USD Billion) Forecast by Type, 2020-2035
  • Table 16: North America Market Volume (Units) Forecast by Type, 2020-2035
  • Table 17: North America Market Value (USD Billion) Forecast by Material, 2020-2035
  • Table 18: North America Market Volume (Units) Forecast by Material, 2020-2035
  • Table 19: North America Market Value (USD Billion) Forecast by Application, 2020-2035
  • Table 20: North America Market Volume (Units) Forecast by Application, 2020-2035
  • Table 21: North America Market Value (USD Billion) Forecast by Capacity, 2020-2035
  • Table 22: North America Market Volume (Units) Forecast by Capacity, 2020-2035
  • Table 23: North America Market Value (USD Billion) Forecast by End-Use, 2020-2035
  • Table 24: North America Market Volume (Units) Forecast by End-Use, 2020-2035
  • Table 25: Latin America Market Value (USD Billion) Forecast by Country, 2020-2035
  • Table 26: Latin America Market Volume (Units) Forecast by Country, 2020-2035
  • Table 27: Latin America Market Value (USD Billion) Forecast by Type, 2020-2035
  • Table 28: Latin America Market Volume (Units) Forecast by Type, 2020-2035
  • Table 29: Latin America Market Value (USD Billion) Forecast by Material, 2020-2035
  • Table 30: Latin America Market Volume (Units) Forecast by Material, 2020-2035
  • Table 31: Latin America Market Value (USD Billion) Forecast by Application, 2020-2035
  • Table 32: Latin America Market Volume (Units) Forecast by Application, 2020-2035
  • Table 33: Latin America Market Value (USD Billion) Forecast by Capacity, 2020-2035
  • Table 34: Latin America Market Volume (Units) Forecast by Capacity, 2020-2035
  • Table 35: Latin America Market Value (USD Billion) Forecast by End-Use, 2020-2035
  • Table 36: Latin America Market Volume (Units) Forecast by End-Use, 2020-2035
  • Table 37: Europe Market Value (USD Billion) Forecast by Country, 2020-2035
  • Table 38: Europe Market Volume (Units) Forecast by Country, 2020-2035
  • Table 39: Europe Market Value (USD Billion) Forecast by Type, 2020-2035
  • Table 40: Europe Market Volume (Units) Forecast by Type, 2020-2035
  • Table 41: Europe Market Value (USD Billion) Forecast by Material, 2020-2035
  • Table 42: Europe Market Volume (Units) Forecast by Material, 2020-2035
  • Table 43: Europe Market Value (USD Billion) Forecast by Application, 2020-2035
  • Table 44: Europe Market Volume (Units) Forecast by Application, 2020-2035
  • Table 45: Europe Market Value (USD Billion) Forecast by Capacity, 2020-2035
  • Table 46: Europe Market Volume (Units) Forecast by Capacity, 2020-2035
  • Table 47: Europe Market Value (USD Billion) Forecast by End-Use, 2020-2035
  • Table 48: Europe Market Volume (Units) Forecast by End-Use, 2020-2035
  • Table 49: East Asia Market Value (USD Billion) Forecast by Country, 2020-2035
  • Table 50: East Asia Market Volume (Units) Forecast by Country, 2020-2035
  • Table 51: East Asia Market Value (USD Billion) Forecast by Type, 2020-2035
  • Table 52: East Asia Market Volume (Units) Forecast by Type, 2020-2035
  • Table 53: East Asia Market Value (USD Billion) Forecast by Material, 2020-2035
  • Table 54: East Asia Market Volume (Units) Forecast by Material, 2020-2035
  • Table 55: East Asia Market Value (USD Billion) Forecast by Application, 2020-2035
  • Table 56: East Asia Market Volume (Units) Forecast by Application, 2020-2035
  • Table 57: East Asia Market Value (USD Billion) Forecast by Capacity, 2020-2035
  • Table 58: East Asia Market Volume (Units) Forecast by Capacity, 2020-2035
  • Table 59: East Asia Market Value (USD Billion) Forecast by End-Use, 2020-2035
  • Table 60: East Asia Market Volume (Units) Forecast by End-Use, 2020-2035
  • Table 61: South Asia Market Value (USD Billion) Forecast by Country, 2020-2035
  • Table 62: South Asia Market Volume (Units) Forecast by Country, 2020-2035
  • Table 63: South Asia Market Value (USD Billion) Forecast by Type, 2020-2035
  • Table 64: South Asia Market Volume (Units) Forecast by Type, 2020-2035
  • Table 65: South Asia Market Value (USD Billion) Forecast by Material, 2020-2035
  • Table 66: South Asia Market Volume (Units) Forecast by Material, 2020-2035
  • Table 67: South Asia Market Value (USD Billion) Forecast by Application, 2020-2035
  • Table 68: South Asia Market Volume (Units) Forecast by Application, 2020-2035
  • Table 69: South Asia Market Value (USD Billion) Forecast by Capacity, 2020-2035
  • Table 70: South Asia Market Volume (Units) Forecast by Capacity, 2020-2035
  • Table 71: South Asia Market Value (USD Billion) Forecast by End-Use, 2020-2035
  • Table 72: South Asia Market Volume (Units) Forecast by End-Use, 2020-2035
  • Table 73: Oceania Market Value (USD Billion) Forecast by Country, 2020-2035
  • Table 74: Oceania Market Volume (Units) Forecast by Country, 2020-2035
  • Table 75: Oceania Market Value (USD Billion) Forecast by Type, 2020-2035
  • Table 76: Oceania Market Volume (Units) Forecast by Type, 2020-2035
  • Table 77: Oceania Market Value (USD Billion) Forecast by Material, 2020-2035
  • Table 78: Oceania Market Volume (Units) Forecast by Material, 2020-2035
  • Table 79: Oceania Market Value (USD Billion) Forecast by Application, 2020-2035
  • Table 80: Oceania Market Volume (Units) Forecast by Application, 2020-2035
  • Table 81: Oceania Market Value (USD Billion) Forecast by Capacity, 2020-2035
  • Table 82: Oceania Market Volume (Units) Forecast by Capacity, 2020-2035
  • Table 83: Oceania Market Value (USD Billion) Forecast by End-Use, 2020-2035
  • Table 84: Oceania Market Volume (Units) Forecast by End-Use, 2020-2035
  • Table 85: MEA Market Value (USD Billion) Forecast by Country, 2020-2035
  • Table 86: MEA Market Volume (Units) Forecast by Country, 2020-2035
  • Table 87: MEA Market Value (USD Billion) Forecast by Type, 2020-2035
  • Table 88: MEA Market Volume (Units) Forecast by Type, 2020-2035
  • Table 89: MEA Market Value (USD Billion) Forecast by Material, 2020-2035
  • Table 90: MEA Market Volume (Units) Forecast by Material, 2020-2035
  • Table 91: MEA Market Value (USD Billion) Forecast by Application, 2020-2035
  • Table 92: MEA Market Volume (Units) Forecast by Application, 2020-2035
  • Table 93: MEA Market Value (USD Billion) Forecast by Capacity, 2020-2035
  • Table 94: MEA Market Volume (Units) Forecast by Capacity, 2020-2035
  • Table 95: MEA Market Value (USD Billion) Forecast by End-Use, 2020-2035
  • Table 96: MEA Market Volume (Units) Forecast by End-Use, 2020-2035

List of Figures

  • Figure 1: Global Market Volume (Units) Forecast 2020-2035
  • Figure 2: Global Market Pricing Analysis
  • Figure 3: Global Market Value (USD Billion) Forecast 2020-2035
  • Figure 4: Global Market Value Share and BPS Analysis by Type, 2025 and 2035
  • Figure 5: Global Market Y-o-Y Growth Comparison by Type, 2025-2035
  • Figure 6: Global Market Attractiveness Analysis by Type
  • Figure 7: Global Market Value Share and BPS Analysis by Material, 2025 and 2035
  • Figure 8: Global Market Y-o-Y Growth Comparison by Material, 2025-2035
  • Figure 9: Global Market Attractiveness Analysis by Material
  • Figure 10: Global Market Value Share and BPS Analysis by Application, 2025 and 2035
  • Figure 11: Global Market Y-o-Y Growth Comparison by Application, 2025-2035
  • Figure 12: Global Market Attractiveness Analysis by Application
  • Figure 13: Global Market Value Share and BPS Analysis by Capacity, 2025 and 2035
  • Figure 14: Global Market Y-o-Y Growth Comparison by Capacity, 2025-2035
  • Figure 15: Global Market Attractiveness Analysis by Capacity
  • Figure 16: Global Market Value Share and BPS Analysis by End-Use, 2025 and 2035
  • Figure 17: Global Market Y-o-Y Growth Comparison by End-Use, 2025-2035
  • Figure 18: Global Market Attractiveness Analysis by End-Use
  • Figure 19: Global Market Value (USD Billion) Share and BPS Analysis by Region, 2025 and 2035
  • Figure 20: Global Market Y-o-Y Growth Comparison by Region, 2025-2035
  • Figure 21: Global Market Attractiveness Analysis by Region
  • Figure 22: North America Market Incremental $ Opportunity, 2025-2035
  • Figure 23: Latin America Market Incremental $ Opportunity, 2025-2035
  • Figure 24: Europe Market Incremental $ Opportunity, 2025-2035
  • Figure 25: East Asia Market Incremental $ Opportunity, 2025-2035
  • Figure 26: South Asia Market Incremental $ Opportunity, 2025-2035
  • Figure 27: Oceania Market Incremental $ Opportunity, 2025-2035
  • Figure 28: MEA Market Incremental $ Opportunity, 2025-2035
  • Figure 29: North America Market Value Share and BPS Analysis by Country, 2025 and 2035
  • Figure 30: North America Market Value Share and BPS Analysis by Type, 2025 and 2035
  • Figure 31: North America Market Y-o-Y Growth Comparison by Type, 2025-2035
  • Figure 32: North America Market Attractiveness Analysis by Type
  • Figure 33: North America Market Value Share and BPS Analysis by Material, 2025 and 2035
  • Figure 34: North America Market Y-o-Y Growth Comparison by Material, 2025-2035
  • Figure 35: North America Market Attractiveness Analysis by Material
  • Figure 36: North America Market Value Share and BPS Analysis by Application, 2025 and 2035
  • Figure 37: North America Market Y-o-Y Growth Comparison by Application, 2025-2035
  • Figure 38: North America Market Attractiveness Analysis by Application
  • Figure 39: North America Market Value Share and BPS Analysis by Capacity, 2025 and 2035
  • Figure 40: North America Market Y-o-Y Growth Comparison by Capacity, 2025-2035
  • Figure 41: North America Market Attractiveness Analysis by Capacity
  • Figure 42: North America Market Value Share and BPS Analysis by End-Use, 2025 and 2035
  • Figure 43: North America Market Y-o-Y Growth Comparison by End-Use, 2025-2035
  • Figure 44: North America Market Attractiveness Analysis by End-Use
  • Figure 45: Latin America Market Value Share and BPS Analysis by Country, 2025 and 2035
  • Figure 46: Latin America Market Value Share and BPS Analysis by Type, 2025 and 2035
  • Figure 47: Latin America Market Y-o-Y Growth Comparison by Type, 2025-2035
  • Figure 48: Latin America Market Attractiveness Analysis by Type
  • Figure 49: Latin America Market Value Share and BPS Analysis by Material, 2025 and 2035
  • Figure 50: Latin America Market Y-o-Y Growth Comparison by Material, 2025-2035
  • Figure 51: Latin America Market Attractiveness Analysis by Material
  • Figure 52: Latin America Market Value Share and BPS Analysis by Application, 2025 and 2035
  • Figure 53: Latin America Market Y-o-Y Growth Comparison by Application, 2025-2035
  • Figure 54: Latin America Market Attractiveness Analysis by Application
  • Figure 55: Latin America Market Value Share and BPS Analysis by Capacity, 2025 and 2035
  • Figure 56: Latin America Market Y-o-Y Growth Comparison by Capacity, 2025-2035
  • Figure 57: Latin America Market Attractiveness Analysis by Capacity
  • Figure 58: Latin America Market Value Share and BPS Analysis by End-Use, 2025 and 2035
  • Figure 59: Latin America Market Y-o-Y Growth Comparison by End-Use, 2025-2035
  • Figure 60: Latin America Market Attractiveness Analysis by End-Use
  • Figure 61: Europe Market Value Share and BPS Analysis by Country, 2025 and 2035
  • Figure 62: Europe Market Value Share and BPS Analysis by Type, 2025 and 2035
  • Figure 63: Europe Market Y-o-Y Growth Comparison by Type, 2025-2035
  • Figure 64: Europe Market Attractiveness Analysis by Type
  • Figure 65: Europe Market Value Share and BPS Analysis by Material, 2025 and 2035
  • Figure 66: Europe Market Y-o-Y Growth Comparison by Material, 2025-2035
  • Figure 67: Europe Market Attractiveness Analysis by Material
  • Figure 68: Europe Market Value Share and BPS Analysis by Application, 2025 and 2035
  • Figure 69: Europe Market Y-o-Y Growth Comparison by Application, 2025-2035
  • Figure 70: Europe Market Attractiveness Analysis by Application
  • Figure 71: Europe Market Value Share and BPS Analysis by Capacity, 2025 and 2035
  • Figure 72: Europe Market Y-o-Y Growth Comparison by Capacity, 2025-2035
  • Figure 73: Europe Market Attractiveness Analysis by Capacity
  • Figure 74: Europe Market Value Share and BPS Analysis by End-Use, 2025 and 2035
  • Figure 75: Europe Market Y-o-Y Growth Comparison by End-Use, 2025-2035
  • Figure 76: Europe Market Attractiveness Analysis by End-Use
  • Figure 77: East Asia Market Value Share and BPS Analysis by Country, 2025 and 2035
  • Figure 78: East Asia Market Value Share and BPS Analysis by Type, 2025 and 2035
  • Figure 79: East Asia Market Y-o-Y Growth Comparison by Type, 2025-2035
  • Figure 80: East Asia Market Attractiveness Analysis by Type
  • Figure 81: East Asia Market Value Share and BPS Analysis by Material, 2025 and 2035
  • Figure 82: East Asia Market Y-o-Y Growth Comparison by Material, 2025-2035
  • Figure 83: East Asia Market Attractiveness Analysis by Material
  • Figure 84: East Asia Market Value Share and BPS Analysis by Application, 2025 and 2035
  • Figure 85: East Asia Market Y-o-Y Growth Comparison by Application, 2025-2035
  • Figure 86: East Asia Market Attractiveness Analysis by Application
  • Figure 87: East Asia Market Value Share and BPS Analysis by Capacity, 2025 and 2035
  • Figure 88: East Asia Market Y-o-Y Growth Comparison by Capacity, 2025-2035
  • Figure 89: East Asia Market Attractiveness Analysis by Capacity
  • Figure 90: East Asia Market Value Share and BPS Analysis by End-Use, 2025 and 2035
  • Figure 91: East Asia Market Y-o-Y Growth Comparison by End-Use, 2025-2035
  • Figure 92: East Asia Market Attractiveness Analysis by End-Use
  • Figure 93: South Asia Market Value Share and BPS Analysis by Country, 2025 and 2035
  • Figure 94: South Asia Market Value Share and BPS Analysis by Type, 2025 and 2035
  • Figure 95: South Asia Market Y-o-Y Growth Comparison by Type, 2025-2035
  • Figure 96: South Asia Market Attractiveness Analysis by Type
  • Figure 97: South Asia Market Value Share and BPS Analysis by Material, 2025 and 2035
  • Figure 98: South Asia Market Y-o-Y Growth Comparison by Material, 2025-2035
  • Figure 99: South Asia Market Attractiveness Analysis by Material
  • Figure 100: South Asia Market Value Share and BPS Analysis by Application, 2025 and 2035
  • Figure 101: South Asia Market Y-o-Y Growth Comparison by Application, 2025-2035
  • Figure 102: South Asia Market Attractiveness Analysis by Application
  • Figure 103: South Asia Market Value Share and BPS Analysis by Capacity, 2025 and 2035
  • Figure 104: South Asia Market Y-o-Y Growth Comparison by Capacity, 2025-2035
  • Figure 105: South Asia Market Attractiveness Analysis by Capacity
  • Figure 106: South Asia Market Value Share and BPS Analysis by End-Use, 2025 and 2035
  • Figure 107: South Asia Market Y-o-Y Growth Comparison by End-Use, 2025-2035
  • Figure 108: South Asia Market Attractiveness Analysis by End-Use
  • Figure 109: Oceania Market Value Share and BPS Analysis by Country, 2025 and 2035
  • Figure 110: Oceania Market Value Share and BPS Analysis by Type, 2025 and 2035
  • Figure 111: Oceania Market Y-o-Y Growth Comparison by Type, 2025-2035
  • Figure 112: Oceania Market Attractiveness Analysis by Type
  • Figure 113: Oceania Market Value Share and BPS Analysis by Material, 2025 and 2035
  • Figure 114: Oceania Market Y-o-Y Growth Comparison by Material, 2025-2035
  • Figure 115: Oceania Market Attractiveness Analysis by Material
  • Figure 116: Oceania Market Value Share and BPS Analysis by Application, 2025 and 2035
  • Figure 117: Oceania Market Y-o-Y Growth Comparison by Application, 2025-2035
  • Figure 118: Oceania Market Attractiveness Analysis by Application
  • Figure 119: Oceania Market Value Share and BPS Analysis by Capacity, 2025 and 2035
  • Figure 120: Oceania Market Y-o-Y Growth Comparison by Capacity, 2025-2035
  • Figure 121: Oceania Market Attractiveness Analysis by Capacity
  • Figure 122: Oceania Market Value Share and BPS Analysis by End-Use, 2025 and 2035
  • Figure 123: Oceania Market Y-o-Y Growth Comparison by End-Use, 2025-2035
  • Figure 124: Oceania Market Attractiveness Analysis by End-Use
  • Figure 125: MEA Market Value Share and BPS Analysis by Country, 2025 and 2035
  • Figure 126: MEA Market Value Share and BPS Analysis by Type, 2025 and 2035
  • Figure 127: MEA Market Y-o-Y Growth Comparison by Type, 2025-2035
  • Figure 128: MEA Market Attractiveness Analysis by Type
  • Figure 129: MEA Market Value Share and BPS Analysis by Material, 2025 and 2035
  • Figure 130: MEA Market Y-o-Y Growth Comparison by Material, 2025-2035
  • Figure 131: MEA Market Attractiveness Analysis by Material
  • Figure 132: MEA Market Value Share and BPS Analysis by Application, 2025 and 2035
  • Figure 133: MEA Market Y-o-Y Growth Comparison by Application, 2025-2035
  • Figure 134: MEA Market Attractiveness Analysis by Application
  • Figure 135: MEA Market Value Share and BPS Analysis by Capacity, 2025 and 2035
  • Figure 136: MEA Market Y-o-Y Growth Comparison by Capacity, 2025-2035
  • Figure 137: MEA Market Attractiveness Analysis by Capacity
  • Figure 138: MEA Market Value Share and BPS Analysis by End-Use, 2025 and 2035
  • Figure 139: MEA Market Y-o-Y Growth Comparison by End-Use, 2025-2035
  • Figure 140: MEA Market Attractiveness Analysis by End-Use
  • Figure 141: Global Market - Tier Structure Analysis
  • Figure 142: Global Market - Company Share Analysis

Frequently Asked Questions

How big is the fusion bag market in 2025?

The global fusion bag market is estimated to be valued at USD 1.3 billion in 2025.

What will be the size of the fusion bag market in 2035?

The market size for the fusion bag market is projected to reach USD 2.1 billion by 2035.

How much will be the fusion bag market growth between 2025 and 2035?

The fusion bag market is expected to grow at a CAGR of 4.4% between 2025 and 2035.

What are the key types in the fusion bag market?

The key types in the fusion bag market include single-use fusion bags and multi-use fusion bags.

Which type segment is expected to contribute significant share in the fusion bag market in 2025?

The single-use fusion bag segment is expected to account for the highest share of 47.6% in the fusion bag market in 2025.

Explore Similar Insights

Future Market Insights

Fusion Bag Market