

- Market Size (2026)
- USD 307.1 million
- Forecast (2036)
- USD 775.0 million
- CAGR (2026 to 2036)
- 9.7%
How big is Gout Nutrition Products Market in 2026?
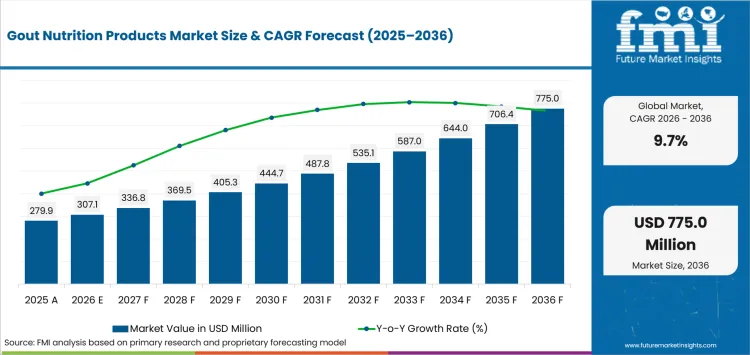
USD 307.1 million in 2026 and USD 775.0 million by 2036 at a 9.7% CAGR.
Demand for gout nutrition products is projected to expand at 9.7% CAGR between 2026 and 2036 with valuation rising from USD 307.1 million to USD 775.0 million. The demand is driven primarily by consumers already buying supplements beside medical care. NIH's Office of Dietary Supplements states in its 2025-2029 plan that the USA supplement category includes more than 100,000 products. That breadth lowers the behavioral barrier to trial without proving a gout-treatment effect.
Ingredient availability sets a separate constraint because tart cherry holds the leading key-ingredient share. USDA NASS forecast USA tart cherry production at 91.0 million pounds in June 2026 compared with 142.2 million pounds in 2025. A smaller crop can tighten concentrate supply or raise sourcing risk before brands reach the consumer. Formulators therefore need stable specifications and alternate sourcing plans as the market expands.
Key Takeaways
- Demand is rising where consumers place nutrition products beside prescribed gout care and keep the role clearly adjunctive.
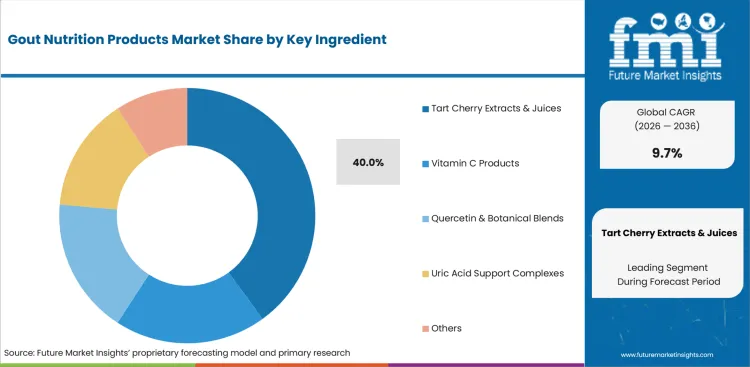
- By key ingredient, tart cherry extracts & juices are projected to account for 40.0% in 2026 attributable to familiar beverage and concentrate formats.
- Supplements are estimated to hold 45.9% of product type in 2026 driven by repeatable dosing and broad retail availability.
- Flare-adjunct support is set to capture 50.1% of use context in 2026 supported by purchase interest during painful recurrent flares.
- Disease-treatment claims can move a food supplement toward medicine or drug regulation and raise the cost of compliant positioning.
- Some of the key players in this market include NOW Health Group, Nature's Way, Swanson Health, Thorne, Pharmavite (Nature Made), Cheribundi, Ajinomoto, and GNC.
Analyst Perspective
"Gout nutrition products earn repeat use when the serving fits long-term gout management and the claim never competes with prescribed therapy. Tart cherry familiarity can start a trial, but ingredient identity and claim control determine whether the product survives retailer and regulator review."
- Nandini Roy Choudhury, Principal Consultant, Future Market Insights
How is the gout nutrition products market segmented?
The market is segmented by key ingredient, product type, use context, form, sales channel and region.
The gout nutrition products market is segmented by key ingredient, product type, use context, form, sales channel and region. Key ingredients include tart cherry extracts & juices, vitamin C products, quercetin & botanical blends, uric acid support complexes and others. Product types cover supplements, functional beverages, low-purine snacks and others. Use context includes flare-adjunct support, daily maintenance and others. Forms include capsules - tablets, liquids & juices, powders & gummies and others. Sales channels include online - DTC, retail pharmacy, supermarkets & hypermarkets, specialty & health stores and others.
How do tart cherry extracts & juices shape demand within the key ingredient category?
Tart cherry gives the category a recognizable food-derived ingredient that fits juice and concentrated supplement formats. In November 2025 USDA Agricultural Marketing Service proposed an 81% free share and 19% restricted share for the 2024-25 crop. The rule controls how much fruit handlers can sell into primary outlets and therefore affects concentrate availability for botanical supplements.
- Based on key ingredient, tart cherry extracts & juices are projected to account for 40.0% in 2026 attributable to recognition and flexible ingestible formats.
- Brands still need lot-level identity and composition controls because juice concentrate and standardized extract can differ materially.
Why do supplements lead the product type category?
Supplements fit consumers who want measured servings without changing meals or carrying a beverage. CDC reported in May 2026 that 38.7% of USA adults used two or more dietary supplements in the prior 30 days. That behavior gives gout-focused formulas a familiar purchasing context beside other dietary supplements.
- By product type, supplements are estimated to hold 45.9% in 2026 driven by standard serving sizes and broad pharmacy or digital availability.
- Repeat purchasing depends on tolerable serving burden and compliant claims because consumers may already take several products beside prescribed medicines.
What supports flare-adjunct support within the use context category?
Flare-adjunct use begins with an episodic problem rather than a daily wellness objective. A January 2025 USA survey study found 6.6 gout flares per year among participants with gout. Nearly 72% were unreported to physicians or were pretreated or prevented. That gap can prompt self-management interest in sports nutrition and related recovery routines without turning nutrition into therapy.
- In 2026, flare-adjunct support is expected to lead use context with 50.1% share supported by purchase interest concentrated during painful episodes.
- Repeat use depends on a clear adjunct role and a serving routine consumers can maintain between clinical visits.
Why do capsules - tablets lead the form category?
Capsules and tablets simplify dose comparison for botanicals and multi-ingredient blends that do not need a beverage base. NOW Health Group expanded the ISO/IEC 17025 scope of its chemical and biological laboratories in June 2025. The added analytical methods illustrate why documented testing matters for fixed-dose formats sold beside gummy supplements.
- By form, capsules - tablets are forecast to represent 46.7% in 2026 attributable to compact storage and clearly stated serving quantities.
- Manufacturers must control raw-material identity and finished-product specifications because fixed unit doses can magnify formulation inconsistency over repeat purchases.
How does online - DTC influence selection within the sales channel category?
Digital channels shorten the route from symptom-led search to purchase and give brands more space to explain ingredients than a shelf label. FDA reviewed an online supplement seller in December 2025 and issued an April 2026 warning after website claims made the products unapproved drugs. Online - DTC therefore offers reach for functional beverages and supplements only with compliant product pages.
- Online - DTC is projected to hold 43.1% of sales channel in 2026 driven by search-led discovery and direct access to repeat ordering.
- The same channel raises review risk because disease wording on product pages or social posts can change regulatory status.
What are the drivers, restraints and opportunities in the Gout Nutrition Products Market?
Recurrent gout flares sustain self-management interest, disease-claim limits restrain promotion, and clearer functional-food documentation can widen compliant routes to consumers.
- Driver: Recurrent flare burden keeps nutrition adjuncts visible between clinician encounters.
- Restraint: Disease-treatment claims can trigger drug or medicine controls and force costly label or web changes.
- Opportunity: Better ingredient documentation and practical formats can convert broader nutraceutical products into repeat adjunct routines.
Consumer Interest Sustains Trial
Demand for gout nutrition products continues to benefit from ongoing self-management interest between clinical visits. A 2025 clinical review described gout as the most common inflammatory arthritis and placed USA prevalence at 5.1%, or 12.1 million adults. The large patient population does not validate individual nutrition claims. It does keep ingredient, diet, and lifestyle questions active outside the clinical setting. Products that fit familiar supplement routines can therefore gain trial through consumer retail channels.
Claim Compliance Limits Commercialization
Regulatory claim boundaries remain an important commercial restraint. Brands cannot market a dietary supplement as an unapproved gout treatment. FDA warned 123Herbals in November 2025 after its website promoted natural herbal products for gout and other diseases. FDA classified the products as unapproved drugs because of the treatment claims. Gout nutrition companies therefore need claim review and compliance controls before expanding advertising activity through digital channels.
Documentation Supports Market Entry
Structured documentation can simplify functional-food commercialization across multiple markets. Japan’s Consumer Affairs Agency moved its Foods with Function Claims notification database to new operating forms from April 2025. The forms separate safety and quality information from function evidence and labeling. That structure gives companies a clearer documentation route for functional foods without converting notification into government approval. Brands with organized evidence files can adapt formulas and claims more efficiently between jurisdictions.
Which country CAGRs are profiled in the Gout Nutrition Products Market?
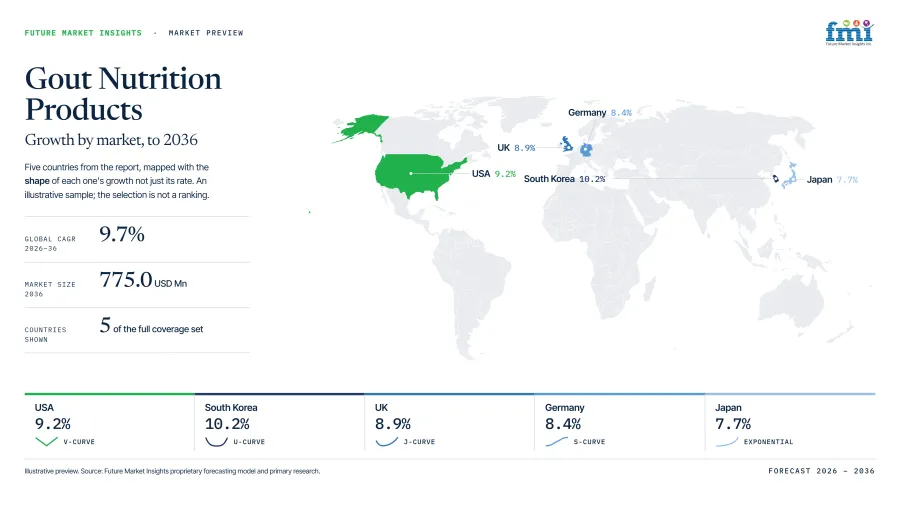
| Country | CAGR |
|---|---|
| South Korea | 10.2% |
| USA | 9.2% |
| UK | 8.9% |
| Germany | 8.4% |
| Japan | 7.7% |
How do country-level CAGRs compare in the Gout Nutrition Products Market?
The 2.5 percentage-point range separates South Korea from Japan and places the USA and UK in a narrow upper-middle band. Faster CAGRs do not imply larger current revenue. The spread instead tracks how channel access and compliance burdens convert self-management interest into commercial purchases under different national conditions and care settings.
- South Korea's upper rate aligns with dense digital health-product discovery.
- The USA offers mass-retail reach but strict controls over disease-related claims.
- UK consumer-funded supplement buying makes channel economics especially important for brands.
- Germany's pharmacy channel places added weight on credible product positioning and evidence.
- Japan's supplement-like forms face additional GMP obligations before wider commercial scale.
Similar rates therefore translate into different launch costs and evidence burdens. The full report provides country-level CAGR analysis across North America, Latin America, Western Europe, Eastern Europe, East Asia, South Asia and Pacific and the Middle East and Africa.
Country-wise Analysis
- in South Korea's formal health-functional-food system recognized ingredients have a clearer route to functional claims. The gout nutrition products sector is projected to record 10.2% CAGR during the assessment period because digital retail works alongside structured ingredient review. MFDS published Notice No. 2026-33 on April 13 2026 and set the current rules for recognizing functional ingredients. Companies using nonstandard botanicals face extra evidence work before local claims can be used. Nutrition claims must also remain clearly separate from any claims of gout treatment. The strongest entry route is a formula with specifications and records built for Korean review instead of an overseas label translated after launch.
- USA consumers already buy supplements through pharmacies and digital channels while urate-lowering therapy stays central to medical gout care. Gout nutrition product demand in the USA is forecast to rise at 9.2% CAGR over the forecast period driven by self-directed use. An October 2025 NHANES analysis found overall supplement use reached 61.4% in 2021-2023. This purchasing habit gives personalized nutrition a familiar route through retail and direct channels. Large supplement assortments make price and serving comparisons relatively easy for shoppers. FDA disease-claim rules still make label and web wording a material barrier because access does not permit a promise to treat gout.
- Under an active MHRA borderline-medicines test UK supplement purchases move through pharmacies and online stores. By 2036 the UK is projected to grow at 8.9% CAGR because mature retail access keeps consumer-funded products easy to find. MHRA data for November 2025 through April 2026 recorded 96 borderline cases and 250 online marketplace takedowns. That enforcement record makes web copy a classification control for herbal supplements sold with condition-adjacent language. Brands can keep the retail channel open by using carefully food-compliant claims. A classification challenge can still force label or page changes after launch. The local risk is the medicine-borderline test rather than retail access itself.
- Pharmacies and health retailers give German consumers broad supplement access. Germany is anticipated to record 8.4% CAGR through 2036 as familiar vitamin supplements and botanical products support routine use. BfR reported in July 2025 that more than two thirds of respondents had used a food supplement in the prior year. Almost half used supplements to treat illness or other health conditions. That consumer intent conflicts with food-law limits on treatment claims. Companies need plain claim boundaries and strong ingredient records for pharmacy education. Conservative wording is especially important for gout-adjacent products sold through trusted health channels during routine purchase.
- In Japan, defined Foods with Function Claims route requires safety and manufacturing records before Japanese companies can use a stated function. MHLW amended health-damage reporting guidance on January 5 2026 and set revised procedures for functional foods and other health-food products. In Japan gout nutrition product demand is predicted to advance at 7.7% CAGR through 2036 supported by formal notification. The change raises post-market responsibility for formulas used every day. Herbal supplements can enter only with records supporting the claim and a process for responding to safety signals. The reporting burden helps explain why Japan trails faster Asian forecasts despite a clear regulatory channel.
Who are the notable companies in the Gout Nutrition Products Market?
NOW Health Group, Nature's Way, Swanson Health, Thorne, Pharmavite (Nature Made), Cheribundi, Ajinomoto, GNC are notable companies serving this market.
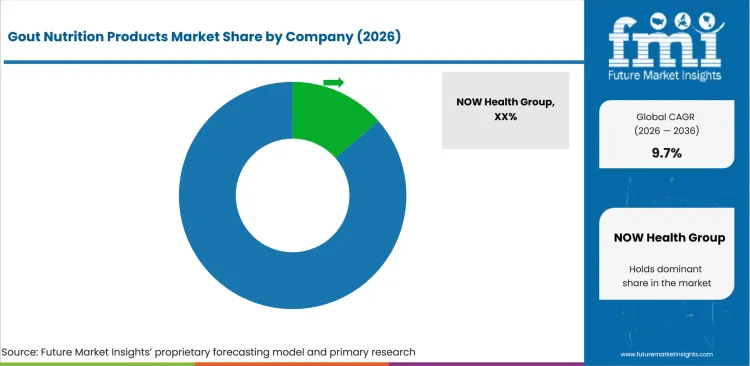
Competition spans broadline supplement platforms and tart-cherry specialists. Entry depends on ingredient records and compliant claims more than corporate scale. Broad distribution still requires consistent documentation for products positioned beside medical gout care.
- NOW Health Group and Nature's Way join Swanson Health and Thorne in broad supplement portfolios with botanical or antioxidant relevance.
- Pharmavite (Nature Made) and GNC bring large consumer access and multiple fixed-dose or gummy formats.
- Cheribundi specializes in tart cherry. Ajinomoto participates at the edge of scope through broader functional nutrition expertise.
Competitive Benchmarking: Gout Nutrition Products Market
| Company | Ingredient and Form Breadth | Quality and Evidence Control | Consumer Access | Geographic Reach |
|---|---|---|---|---|
| NOW Health Group | High | High | High | North America and international distribution |
| Nature's Way | High | High | High | North America and selected international markets |
| Swanson Health | High | Medium | High | North America with online reach |
| Thorne | Medium | High | High | North America and international direct channels |
| Pharmavite (Nature Made) | High | High | High | United States with broad retail reach |
| Cheribundi | Medium | Medium | Medium | United States with selected retail and direct channels |
| Ajinomoto | Low | Low | Medium | Japan and global functional-nutrition operations |
| GNC | High | Medium | High | United States and international retail markets |
Scoring basis: High breadth requires several documented forms or ingredient families. Medium requires two relevant routes and Low one. High quality assurance requires accredited or clearly documented testing systems. Medium requires documented research or quality procedures. Low identifies one narrower documented control. High access requires broad retail plus digital reach. Medium uses a narrower mix and Low one restricted route.
Key Developments in the Gout Nutrition Products Market
- In June 2026, NOW Health Group partnered with LeafWorks to introduce DNA-based identity analysis for botanical ingredients within its testing workflow.
- In March 2026, GNC brought Goli Zero Sugar gummies to stores nationwide and GNC.com with three plant-based formulas and no added sugar.
- In May 2025, Pharmavite opened its New Albany facility and expanded Nature Made gummy production plus dedicated gummy research capacity.
Key Players in the Gout Nutrition Products Market
Broadline Supplement and Botanical Platforms
- NOW Health Group
- Nature's Way
- Swanson Health
- Thorne
Large Consumer Nutrition and Retail Platforms
- Pharmavite (Nature Made)
- GNC
- Ajinomoto
Tart-Cherry Specialist
- Cheribundi
Gout Nutrition Products Market - Report Scope
| Coverage field | Report scope |
|---|---|
| Market breakdown | By key ingredient, product type, use context, form, sales channel and region. |
| Quantitative Units | USD million. |
| Market Definition | Commercial food and supplement products positioned for nutrition support around gout self-management without replacing prescribed treatment. |
| Regions Covered | North America, Latin America, Western Europe, Eastern Europe, East Asia, South Asia and Pacific, and Middle East and Africa. |
| Countries Covered | South Korea, USA, UK, Germany, Japan, and 20+ countries included in the full report. |
| Key Companies Profiled | NOW Health Group, Nature's Way, Swanson Health, Thorne, Pharmavite (Nature Made), Cheribundi, Ajinomoto, GNC. |
| Forecast Period | 2026 to 2036. |
| Approach | Primary and secondary research with market triangulation. |
Gout Nutrition Products Market - Research Methodology
| Method | Approach |
|---|---|
| Primary Research | FMI analysts gathered input from manufacturers, service providers, technology developers, distributors, end users, procurement teams, and subject-matter experts. Interviews examined purchasing decisions, product or service evaluation, adoption barriers, approval requirements, pricing considerations, and expectations for technical or commercial support. Respondents were also asked what evidence is required before a trial, pilot, or initial order develops into regular purchasing. |
| Desk Research | Desk research covered government statistics, regulatory publications, trade data, industry associations, technical literature, standards, company filings, product information, and official corporate announcements. Sources were reviewed for relevance, publication date, geographic coverage, and consistency with the defined market scope. Claims relating to performance, applications, approvals, capacity, investment, and commercial activity were retained only when supported by credible public evidence. |
| Market Sizing and Forecasting | The market model combined the baseline value with historical performance, segment structure, pricing and volume indicators, adoption levels, company participation, and country-level demand conditions. Forecast assumptions considered economic activity, investment trends, regulatory developments, technology adoption, purchasing cycles, supply availability, and barriers to wider market use. Segment and regional estimates were reconciled before the final market total was calculated. |
| Data Validation | Estimates were checked against multiple independent indicators, including public data, company activity, trade patterns, industry developments, and findings from primary interviews. Validation also tested whether products, services, applications, and company revenues fell within the defined market boundaries. Adjacent categories, unsupported claims, overlapping revenues, and activities without direct market relevance were excluded to reduce double counting and maintain consistency across segments and countries. |
Gout Nutrition Products Market by Segments
Gout Nutrition Products Market segmented by Key Ingredient:
- Tart Cherry Extracts & Juices
- Vitamin C Products
- Quercetin & Botanical Blends
- Uric Acid Support Complexes
- Others
Gout Nutrition Products Market segmented by Product Type:
- Supplements
- Functional Beverages
- Low-Purine Snacks
- Others
Gout Nutrition Products Market segmented by Use Context:
- Flare-Adjunct Support
- Daily Maintenance
- Others
Gout Nutrition Products Market segmented by Form:
- Capsules - Tablets
- Liquids & Juices
- Powders & Gummies
- Others
Gout Nutrition Products Market segmented by Sales Channel:
- Online - DTC
- Retail Pharmacy
- Supermarkets & Hypermarkets
- Specialty & Health Stores
- Others
Gout Nutrition Products Market by Region:
- North America
- United States
- Canada
- Latin America
- Brazil
- Mexico
- Argentina
- Chile
- Western Europe
- Germany
- France
- United Kingdom
- Italy
- Spain
- Benelux
- Nordics
- Eastern Europe
- Poland
- Czech Republic
- Romania
- Hungary
- East Asia
- China
- Japan
- South Korea
- South Asia and Pacific
- India
- ASEAN
- Australia and New Zealand
- Middle East and Africa
- GCC Countries
- South Africa
- Türkiye
- Israel
Research Sources and Bibliography
- National Institutes of Health, Office of Dietary Supplements. (2025). Strategic Plan 2025-2029 - Introduction.
- USA Department of Agriculture, National Agricultural Statistics Service. (2026, June 11). Crop Production.
- USA Department of Agriculture, Agricultural Marketing Service. (2025, November 18). USDA Proposes Rule to Establish Free and Restricted Percentages of Tart Cherries for the 2024-25 Crop Year.
- National Center for Health Statistics. (2026, May 21). Dietary Supplement Use: United States, August 2021-August 2023.
- Singh, J. A., Morlock, A., & Morlock, R. (2025, January). Gout Flare Burden in the United States: A Multiyear Cross-Sectional Survey Study.
- NOW Health Group. (2025, June 23). NOW ISO 17025 Accreditation Expanded in Both Chemical and Biological Scopes.
- USA Food and Drug Administration. (2026, April 29). OptiHealth Products, Inc. - 704899 - 04/29/2026.
- FitzGerald, J. D. (2025, March 11). Gout.
- USA Food and Drug Administration. (2025, November 13). 123Herbals - 719198 - 11/13/2025.
- Consumer Affairs Agency, Japan. (2025, April 1). 【食品関連事業者向け】機能性表示食品の届出について.
- Ministry of Food and Drug Safety, South Korea. (2026, April 13). 「건강기능식품 기능성 원료 및 기준·규격 인정에 관한 규정」고시전문(제2026-33호, 2026.4.13.).
- Medicines and Healthcare products Regulatory Agency. (2026, July 2). Borderline products: how to tell if your product is a medicine.
- German Federal Institute for Risk Assessment. (2025, July 18). Between hype and misconception: common misunderstandings about food supplements.
- Ministry of Health, Labour and Welfare, Japan. (2026, January 5). 機能性表示食品等に係る健康被害の情報提供について.
- Zhao, L., Zhang, Y., Liu, J., Hébert, J. R., Giovannucci, E., Zhang, X., & Steck, S. E. (2025, October 23). Trends in dietary supplement use among USA adults between 2011 and 2023.
- Nature's Way. (2025, October 16). Know What's In Your Bottle Spotlight.
- NSF International. (2026, September 7). Listing Category Search Page.
- Ajinomoto Group. (2025). ASV Report 2025: Customer assets.
- NSF International. (2026, September 6). Listing Category Search Page: Certified for Sport - NextFoods, Inc. (Cheribundi).
- NOW Health Group. (2026, June 23). NOW & Leafworks Advance Botanical Identity Testing.
- GNC. (2026, March 31). GNC Brings Goli Nutrition Zero Sugar Gummies to Stores Nationwide and GNC.com.
- Pharmavite. (2025, May 8). Pharmavite, Maker of Nature Made® Vitamins, Opens $250 Million Production Facility in New Albany, Ohio.
- Procter & Gamble. (2026, August 4). Thorne to Join P&G Health Care Portfolio.
- Nature's Way. (2025, November 19). Just Launched: New Weight Manager Gummy.
- GNC. (2025, November 10). GNC Launches Landmark Human Performance Study with PLNU to Redefine Supplement Innovation.
- Pharmavite. (2025, March 21). Nature Made® Prioritizes Gut Health Support with Clinically Studied Probiotic Innovations to Help Even More Consumers Prioritize Digestive Health & Overall Wellness.
- Thorne. (2026, July 29). Thorne's Basic Prenatal Becomes the First Prenatal with a Bioactive Form of Folate to Earn NSF Certified for Sport® Certification.
- Pharmavite. (2026, March 3). Nature Made® Continues Expansion of its Gut Health Offerings with the Launch of SuperGreens and Digestive Enzymes.
- GNC. (2026, April 16). GNC Launches MitoQ Pure and MitoQ NAD+ Dual Action in The Drop, by GNC, Expanding Access to Cellular Health Innovation.
This bibliography is provided for reader reference and is not exhaustive. The full report contains the complete reference list and detailed citations.
This Report Answers
- How large is the gout nutrition products market in 2026 and what value is forecast for 2036?
- Which operating conditions convert gout self-management interest into repeat nutrition purchases?
- Why do tart cherry extracts & juices hold the leading share within key ingredient?
- Why do supplements lead product type and capsules - tablets lead form?
- How do disease-claim restrictions change product and digital-channel strategy?
- How do the five profiled country growth rates compare?
- Which companies compete through botanical ingredients, consumer supplement platforms and tart-cherry specialization?
- What evidence and testing controls matter before gout-related nutrition claims enter the market?
Frequently Asked Questions
How big is the gout nutrition products market in 2026?
The gout nutrition products market is valued at USD 307.1 million in 2026 and is projected to reach USD 775.0 million by 2036. Growth comes from adjunct self-management interest and familiar supplement purchasing habits.
What is the CAGR of the gout nutrition products market from 2026 to 2036?
The gout nutrition products market is projected to grow at a CAGR of 9.7% between 2026 and 2036. Expansion depends on repeat-use formats that retain clear boundaries between nutrition support and disease treatment.
Which key ingredient leads the gout nutrition products market?
The tart cherry extracts & juices segment is expected to hold 40.0% of the gout nutrition products market in 2026 driven by familiarity with juice and concentrate formats. Ingredient variability keeps sourcing and specification control important.
Which product type leads the gout nutrition products market?
The supplements segment is estimated to hold 45.9% of the gout nutrition products market in 2026 attributable to measured servings and broad retail access. Repeat use still depends on tolerability and claim discipline.
How much value will the gout nutrition products market add between 2026 and 2036?
The gout nutrition products market is expected to add USD 467.9 million in value between 2026 and 2036. The increase assumes adjunct nutrition keeps gaining use without replacing the medical treatment pathway.
Which countries are projected to record the highest growth in the gout nutrition products market?
South Korea is projected to grow at 10.2% CAGR followed by the USA at 9.2% and the UK at 8.9% through 2036. Their growth routes differ in functional-food rules and consumer supplement access.
Which companies are active in the gout nutrition products market?
Key companies operating in the market include NOW Health Group, Nature's Way, Swanson Health, Thorne, Pharmavite (Nature Made), Cheribundi, Ajinomoto, and GNC. They compete through ingredient breadth and documented quality systems as well as retail or digital access.
Preview the report firsthand - request a free sample
Get SampleGet the brochure for pricing and purchase details.
Get PDFTable of Content
- Key Takeaways
- Market Size and CAGR
- Top Growth Driver
- Fastest Growing Segment
- Leading Region
- Key Companies
- Emerging Opportunities
- Executive Summary
- Global Market Outlook
- Demand-side Trends
- Supply-side Trends
- Technology Roadmap Analysis
- Analysis and Recommendations
- Analyst Perspective (What is happening? Why now? What should investors know?)
- Key Questions Answered
- How large is the market?
- What is the CAGR?
- What are key trends?
- Which region dominates?
- Who are the leaders?
- Market Overview
- Market Coverage / Taxonomy
- Market Definition / Scope / Limitations
- Research Methodology
- Chapter Orientation
- Analytical Lens and Working Hypotheses
- Market Structure, Signals, and Trend Drivers
- Benchmarking and Cross-market Comparability
- Market Sizing, Forecasting, and Opportunity Mapping
- Research Design and Evidence Framework
- Desk Research Programme (Secondary Evidence)
- Expert Input and Fieldwork (Primary Evidence)
- Tooling, Models, and Reference Databases
- Data Engineering and Model Build
- Quality Assurance and Audit Trail
- Market Background
- Market Dynamics (Drivers, Restraints, Opportunity, Trends)
- Scenario Forecast (Optimistic, Likely, Conservative)
- Impact Analysis
- AI Impact
- Sustainability Impact
- Regulatory Impact
- Technology Impact
- Consumer / Buyer Analysis
- Purchase Drivers
- Adoption Barriers
- Buyer Journey
- Opportunity Map Analysis
- Product Life Cycle Analysis
- Supply Chain Analysis
- Investment Feasibility Matrix
- Value Chain Analysis
- PESTLE and Porter's Analysis
- Regulatory Landscape
- Regional Parent Market Outlook
- Production and Consumption Statistics
- Import and Export Statistics
- Global Market Analysis and Forecast, 2021 to 2036
- Historical Market Size Value (USD Million) Analysis, 2021 to 2025
- Current and Future Market Size Value (USD Million) Projections, 2026 to 2036
- Y-o-Y Growth Trend Analysis
- Absolute $ Opportunity Analysis
- Global Market Pricing Analysis, 2021 to 2036
- Global Market Analysis and Forecast, By Key Ingredient, 2021 to 2036
- Introduction / Key Findings
- Historical Market Size Value (USD Million) Analysis By Key Ingredient, 2021 to 2025
- Current and Future Market Size Value (USD Million) Analysis and Forecast By Key Ingredient, 2026 to 2036
- Tart Cherry Extracts & Juices
- Vitamin C Products
- Quercetin & Botanical Blends
- Uric Acid Support Complexes
- Others
- Tart Cherry Extracts & Juices
- Y-o-Y Growth Trend Analysis By Key Ingredient, 2021 to 2025
- Absolute $ Opportunity Analysis By Key Ingredient, 2026 to 2036
- Global Market Analysis and Forecast, By Product Type, 2021 to 2036
- Introduction / Key Findings
- Historical Market Size Value (USD Million) Analysis By Product Type, 2021 to 2025
- Current and Future Market Size Value (USD Million) Analysis and Forecast By Product Type, 2026 to 2036
- Supplements
- Functional Beverages
- Low-Purine Snacks
- Others
- Supplements
- Y-o-Y Growth Trend Analysis By Product Type, 2021 to 2025
- Absolute $ Opportunity Analysis By Product Type, 2026 to 2036
- Global Market Analysis and Forecast, By Use Context, 2021 to 2036
- Introduction / Key Findings
- Historical Market Size Value (USD Million) Analysis By Use Context, 2021 to 2025
- Current and Future Market Size Value (USD Million) Analysis and Forecast By Use Context, 2026 to 2036
- Flare-Adjunct Support
- Daily Maintenance
- Others
- Flare-Adjunct Support
- Y-o-Y Growth Trend Analysis By Use Context, 2021 to 2025
- Absolute $ Opportunity Analysis By Use Context, 2026 to 2036
- Global Market Analysis and Forecast, By Form, 2021 to 2036
- Introduction / Key Findings
- Historical Market Size Value (USD Million) Analysis By Form, 2021 to 2025
- Current and Future Market Size Value (USD Million) Analysis and Forecast By Form, 2026 to 2036
- Capsules / Tablets
- Liquids & Juices
- Powders & Gummies
- Others
- Capsules / Tablets
- Y-o-Y Growth Trend Analysis By Form, 2021 to 2025
- Absolute $ Opportunity Analysis By Form, 2026 to 2036
- Global Market Analysis and Forecast, By Sales Channel, 2021 to 2036
- Introduction / Key Findings
- Historical Market Size Value (USD Million) Analysis By Sales Channel, 2021 to 2025
- Current and Future Market Size Value (USD Million) Analysis and Forecast By Sales Channel, 2026 to 2036
- Online / DTC
- Retail Pharmacy
- Supermarkets & Hypermarkets
- Specialty & Health Stores
- Others
- Online / DTC
- Y-o-Y Growth Trend Analysis By Sales Channel, 2021 to 2025
- Absolute $ Opportunity Analysis By Sales Channel, 2026 to 2036
- Global Market Analysis and Forecast, By Region, 2021 to 2036
- Introduction
- Historical Market Size Value (USD Million) Analysis By Region, 2021 to 2025
- Current Market Size Value (USD Million) Analysis and Forecast By Region, 2026 to 2036
- North America
- Latin America
- Western Europe
- Eastern Europe
- East Asia
- South Asia and Pacific
- Middle East & Africa
- Market Attractiveness Analysis By Region
- North America Market Analysis and Forecast, By Country, 2021 to 2036
- Historical Market Size Value (USD Million) Trend Analysis By Market Taxonomy, 2021 to 2025
- Market Size Value (USD Million) Forecast By Market Taxonomy, 2026 to 2036
- By Country
- USA
- Canada
- By Key Ingredient
- By Product Type
- By Use Context
- By Form
- By Sales Channel
- By Country
- Market Attractiveness Analysis
- By Country
- By Key Ingredient
- By Product Type
- By Use Context
- By Form
- By Sales Channel
- Key Takeaways
- Latin America Market Analysis and Forecast, By Country
- Historical Market Size Value (USD Million) Trend Analysis By Market Taxonomy, 2021 to 2025
- Market Size Value (USD Million) Forecast By Market Taxonomy, 2026 to 2036
- By Country
- Brazil
- Mexico
- Chile
- Rest of Latin America
- By Key Ingredient
- By Product Type
- By Use Context
- By Form
- By Sales Channel
- By Country
- Market Attractiveness Analysis
- By Country
- By Key Ingredient
- By Product Type
- By Use Context
- By Form
- By Sales Channel
- Key Takeaways
- Western Europe Market Analysis and Forecast, By Country
- Historical Market Size Value (USD Million) Trend Analysis By Market Taxonomy, 2021 to 2025
- Market Size Value (USD Million) Forecast By Market Taxonomy, 2026 to 2036
- By Country
- Germany
- UK
- Italy
- Spain
- France
- Nordic
- BENELUX
- Rest of Western Europe
- By Key Ingredient
- By Product Type
- By Use Context
- By Form
- By Sales Channel
- By Country
- Market Attractiveness Analysis
- By Country
- By Key Ingredient
- By Product Type
- By Use Context
- By Form
- By Sales Channel
- Key Takeaways
- Eastern Europe Market Analysis and Forecast, By Country
- Historical Market Size Value (USD Million) Trend Analysis By Market Taxonomy, 2021 to 2025
- Market Size Value (USD Million) Forecast By Market Taxonomy, 2026 to 2036
- By Country
- Russia
- Poland
- Hungary
- Balkan & Baltic
- Rest of Eastern Europe
- By Key Ingredient
- By Product Type
- By Use Context
- By Form
- By Sales Channel
- By Country
- Market Attractiveness Analysis
- By Country
- By Key Ingredient
- By Product Type
- By Use Context
- By Form
- By Sales Channel
- Key Takeaways
- East Asia Market Analysis and Forecast, By Country
- Historical Market Size Value (USD Million) Trend Analysis By Market Taxonomy, 2021 to 2025
- Market Size Value (USD Million) Forecast By Market Taxonomy, 2026 to 2036
- By Country
- China
- Japan
- South Korea
- By Key Ingredient
- By Product Type
- By Use Context
- By Form
- By Sales Channel
- By Country
- Market Attractiveness Analysis
- By Country
- By Key Ingredient
- By Product Type
- By Use Context
- By Form
- By Sales Channel
- Key Takeaways
- South Asia and Pacific Market Analysis and Forecast, By Country
- Historical Market Size Value (USD Million) Trend Analysis By Market Taxonomy, 2021 to 2025
- Market Size Value (USD Million) Forecast By Market Taxonomy, 2026 to 2036
- By Country
- India
- ASEAN
- Australia & New Zealand
- Rest of South Asia and Pacific
- By Key Ingredient
- By Product Type
- By Use Context
- By Form
- By Sales Channel
- By Country
- Market Attractiveness Analysis
- By Country
- By Key Ingredient
- By Product Type
- By Use Context
- By Form
- By Sales Channel
- Key Takeaways
- Middle East & Africa Market Analysis and Forecast, By Country
- Historical Market Size Value (USD Million) Trend Analysis By Market Taxonomy, 2021 to 2025
- Market Size Value (USD Million) Forecast By Market Taxonomy, 2026 to 2036
- By Country
- Kingdom of Saudi Arabia
- Other GCC Countries
- Türkiye
- South Africa
- Other African Union
- Rest of Middle East & Africa
- By Key Ingredient
- By Product Type
- By Use Context
- By Form
- By Sales Channel
- By Country
- Market Attractiveness Analysis
- By Country
- By Key Ingredient
- By Product Type
- By Use Context
- By Form
- By Sales Channel
- Key Takeaways
- Key Countries Market Analysis
- USA
- Pricing Analysis
- Market Share Analysis, 2025
- By Key Ingredient
- By Product Type
- By Use Context
- By Form
- By Sales Channel
- Canada
- Pricing Analysis
- Market Share Analysis, 2025
- By Key Ingredient
- By Product Type
- By Use Context
- By Form
- By Sales Channel
- Mexico
- Pricing Analysis
- Market Share Analysis, 2025
- By Key Ingredient
- By Product Type
- By Use Context
- By Form
- By Sales Channel
- Brazil
- Pricing Analysis
- Market Share Analysis, 2025
- By Key Ingredient
- By Product Type
- By Use Context
- By Form
- By Sales Channel
- Chile
- Pricing Analysis
- Market Share Analysis, 2025
- By Key Ingredient
- By Product Type
- By Use Context
- By Form
- By Sales Channel
- Germany
- Pricing Analysis
- Market Share Analysis, 2025
- By Key Ingredient
- By Product Type
- By Use Context
- By Form
- By Sales Channel
- UK
- Pricing Analysis
- Market Share Analysis, 2025
- By Key Ingredient
- By Product Type
- By Use Context
- By Form
- By Sales Channel
- Italy
- Pricing Analysis
- Market Share Analysis, 2025
- By Key Ingredient
- By Product Type
- By Use Context
- By Form
- By Sales Channel
- Spain
- Pricing Analysis
- Market Share Analysis, 2025
- By Key Ingredient
- By Product Type
- By Use Context
- By Form
- By Sales Channel
- France
- Pricing Analysis
- Market Share Analysis, 2025
- By Key Ingredient
- By Product Type
- By Use Context
- By Form
- By Sales Channel
- India
- Pricing Analysis
- Market Share Analysis, 2025
- By Key Ingredient
- By Product Type
- By Use Context
- By Form
- By Sales Channel
- ASEAN
- Pricing Analysis
- Market Share Analysis, 2025
- By Key Ingredient
- By Product Type
- By Use Context
- By Form
- By Sales Channel
- Australia & New Zealand
- Pricing Analysis
- Market Share Analysis, 2025
- By Key Ingredient
- By Product Type
- By Use Context
- By Form
- By Sales Channel
- China
- Pricing Analysis
- Market Share Analysis, 2025
- By Key Ingredient
- By Product Type
- By Use Context
- By Form
- By Sales Channel
- Japan
- Pricing Analysis
- Market Share Analysis, 2025
- By Key Ingredient
- By Product Type
- By Use Context
- By Form
- By Sales Channel
- South Korea
- Pricing Analysis
- Market Share Analysis, 2025
- By Key Ingredient
- By Product Type
- By Use Context
- By Form
- By Sales Channel
- Russia
- Pricing Analysis
- Market Share Analysis, 2025
- By Key Ingredient
- By Product Type
- By Use Context
- By Form
- By Sales Channel
- Poland
- Pricing Analysis
- Market Share Analysis, 2025
- By Key Ingredient
- By Product Type
- By Use Context
- By Form
- By Sales Channel
- Hungary
- Pricing Analysis
- Market Share Analysis, 2025
- By Key Ingredient
- By Product Type
- By Use Context
- By Form
- By Sales Channel
- Kingdom of Saudi Arabia
- Pricing Analysis
- Market Share Analysis, 2025
- By Key Ingredient
- By Product Type
- By Use Context
- By Form
- By Sales Channel
- Türkiye
- Pricing Analysis
- Market Share Analysis, 2025
- By Key Ingredient
- By Product Type
- By Use Context
- By Form
- By Sales Channel
- South Africa
- Pricing Analysis
- Market Share Analysis, 2025
- By Key Ingredient
- By Product Type
- By Use Context
- By Form
- By Sales Channel
- USA
- Market Structure Analysis
- Competition Dashboard
- Competition Benchmarking
- Market Share Analysis of Top Players
- By Regional
- By Key Ingredient
- By Product Type
- By Use Context
- By Form
- By Sales Channel
- Emerging Startups
- Innovation Benchmarking
- Competition Analysis
- Competition Deep Dive
- NOW Health Group
- Overview
- Product Portfolio
- Profitability by Market Segments
- Sales Footprint
- Strategy Overview
- Marketing Strategy
- Product Strategy
- Channel Strategy
- Nature's Way
- Swanson Health
- Thorne
- Pharmavite (Nature Made)
- Cheribundi
- Ajinomoto
- GNC
- NOW Health Group
- Case Studies
- Success Stories
- Recent Developments
- Competition Deep Dive
- Assumptions & Acronyms Used


