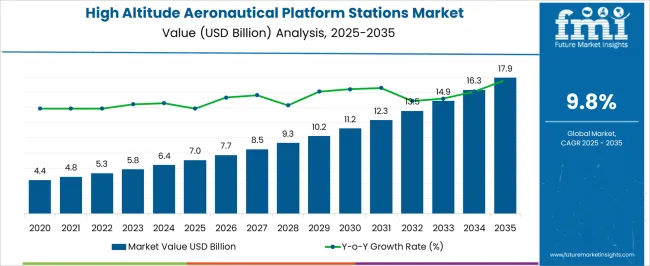
The High Altitude Aeronautical Platform Stations Market is estimated to be valued at USD 7.0 billion in 2025 and is projected to reach USD 17.9 billion by 2035, registering a compound annual growth rate (CAGR) of 9.8% over the forecast period.
| Metric | Value |
|---|---|
| High Altitude Aeronautical Platform Stations Market Estimated Value in (2025 E) | USD 7.0 billion |
| High Altitude Aeronautical Platform Stations Market Forecast Value in (2035 F) | USD 17.9 billion |
| Forecast CAGR (2025 to 2035) | 9.8% |
The high altitude aeronautical platform stations (HAPS) market is expanding as demand grows for persistent aerial connectivity, surveillance, and communication solutions. Industry journals and aerospace company briefings have emphasized that HAPS are increasingly viewed as cost-effective alternatives or complements to satellites for providing broadband internet, disaster response connectivity, and defense surveillance.
The rapid increase in data consumption, particularly in remote and underserved regions, has fueled investments in airborne platforms capable of operating for extended durations at stratospheric altitudes. Press releases from aerospace firms have highlighted progress in solar-powered propulsion and lightweight composite materials, which extend endurance and operational flexibility.
Governments and international organizations are also supporting HAPS initiatives to strengthen communication networks and enhance disaster resilience. Looking forward, continued integration of HAPS into both civilian and defense infrastructures, combined with advances in unmanned platforms and autonomous flight systems, is expected to accelerate adoption. Market growth is anticipated to be led by airplane-based platforms and unmanned systems due to their scalability, operational efficiency, and cost advantages over traditional satellite deployments.
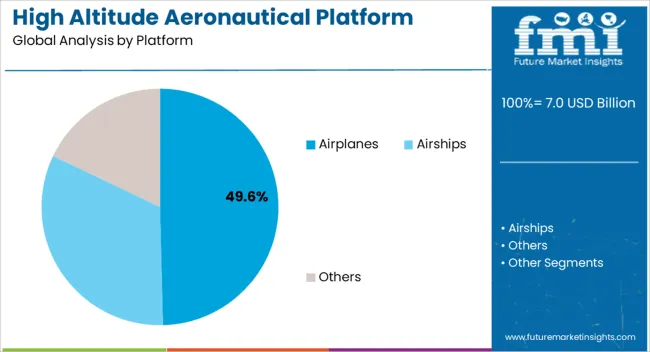
The Airplanes segment is projected to account for 49.60% of the HAPS market revenue in 2025, maintaining its leading position due to its capability for long-endurance missions and high payload capacity. Airplane-based platforms have benefited from advances in aerodynamics, lightweight materials, and solar-powered systems that enable continuous operation at stratospheric levels.
These platforms are capable of carrying advanced payloads for telecommunications, surveillance, and environmental monitoring, offering versatility across civilian and defense applications. Aerospace industry disclosures have emphasized the cost-efficiency of airplane platforms compared to satellite launches, as well as their ability to be redeployed and maintained with relative ease.
Furthermore, the scalability of airplane platforms for both large-scale commercial projects and specialized government missions has ensured strong adoption. With continued investment in renewable energy integration and improvements in autonomous navigation systems, the Airplanes segment is expected to remain the dominant choice for high altitude aeronautical platform stations.
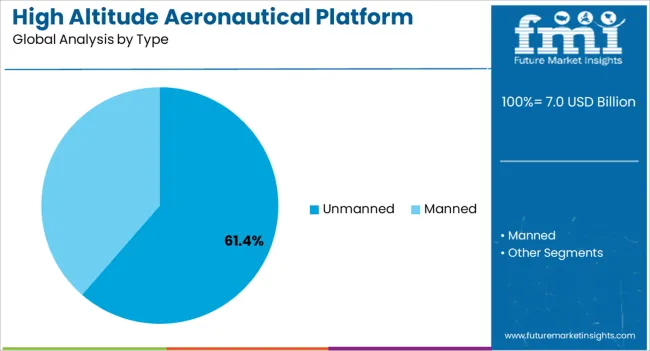
The Unmanned segment is projected to capture 61.40% of the HAPS market revenue in 2025, underscoring its dominance as the preferred operational model. Growth in this segment has been supported by the ability of unmanned platforms to operate at extreme altitudes for prolonged periods without the risks or costs associated with manned missions.
Advances in autonomous control systems, remote monitoring, and energy-efficient propulsion have reinforced the reliability of unmanned HAPS. Defense and security agencies have prioritized unmanned platforms for persistent intelligence, surveillance, and reconnaissance missions, while telecommunications providers have focused on unmanned solutions to deliver internet connectivity in rural and remote regions.
The absence of onboard human requirements has also allowed for lighter designs and increased payload capacity, further enhancing operational efficiency. As regulatory frameworks evolve to accommodate unmanned stratospheric operations and industry innovation continues to improve safety and reliability, the Unmanned segment is expected to consolidate its leadership position in the global HAPS market.
The ability of high altitude aeronautical platform stations to provide several services is one of its most significant characteristics. The connection and switching of traffic between various high altitude platforms, satellite networks, and terrestrial gateways is also made feasible by this technology. On the other hand, during the past ten years, lighter-than-air (LTA) technology has made considerable advancements. For end users, research on high-altitude platforms has started as the usage of LTA technology has grown.
Modern LTA vehicles are technologically advanced and are actively used by both military forces and the commercial sector for a variety of reasons, including intelligence gathering, surveillance, and reconnaissance. The high altitude aeronautical platform station is an autonomous platform that can operate in the stratosphere at altitudes between 17 and 23 km. It has a high degree of endurance and could last for weeks or months.
High altitude aeronautical platform stations provide various benefits over terrestrial radio networks and satellite communications, driving the HAAPS market expansion. Increasing altitude aeronautical platform stations are in high demand due to advantages including low cost, quick deployment, simple relocation, wide coverage, and minimal environmental effect.
However, constructing an aircraft to fly in the stratosphere is a significant technological challenge because of issues with dependability, thermal management, energy generation and storage, lightweight construction, and operating at low altitudes. Furthermore, it is not viable to create a superior high-altitude aviation platform station owing to financial constraints.
Owing to its durability and ability to operate at high altitudes, HAAPS offers the most suited alternative for emergency deployment in the event of a disaster. However, HAAPS may be incorporated with current technologies, not replacing them, for mainstream communication. HAAPS are especially well suited for deployment if temporary capacity expansion is needed.
In addition, there are ongoing initiatives in which businesses are attempting to employ (photovoltaic cells) more frequently as the main energy source of high altitude aeronautical platforms to lengthen flying times. This may also increase the adoption of HAAPS in the defense and military sectors.
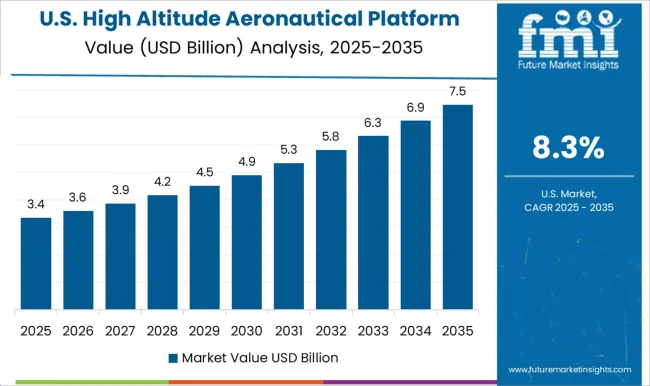
North America holds a leading market share, and it accounted for nearly 24.3% of its market share in 2025. The creation of manned and unmanned high-altitude aircraft, including the U-2 plane, in the United States marked the beginning of HAAPS, making North America its progenitor.
This region is also estimated to grow at a higher pace during the forecast period due to certain growth factors like more-intense competition, new product launches, retrofitting, and renovating old technology.
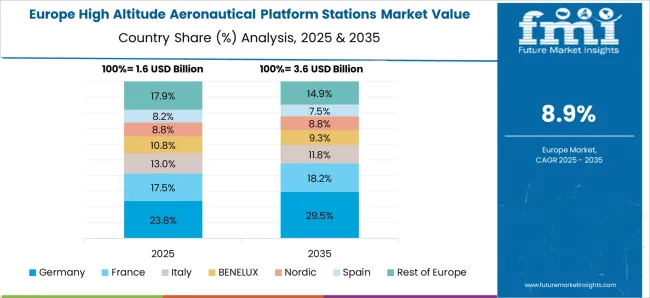
In Europe, the defense industry has a significant impact, making it a second-leading market share for HAAPS. The market in Europe held about 21.2% in 2025. For the United Kingdom military ministries, the QinetiQ business in the United Kingdom constructed the Zephyr, an ultra-light high-altitude long-endurance UAV, in 2006.
A hand-launched UAV made of carbon fiber is called the Zephyr. This lightweight, low-cost UAV has recently completed an 82-hour flight at a 20-kilometer altitude. It is helpful in the global battle against terrorism as well as for radio communications relay and surveillance.
While outsourcing the satellite bus, launch, and ground communications to the prototype suppliers, the entrepreneurs are developing their payloads.
For instance, Lacuna Space tests services using its prototype satellites before choosing a manufacturer for its constellation. The goal is to create an IoT system, a tracking and sensor detection service with extremely cheap costs for modest volumes of data.
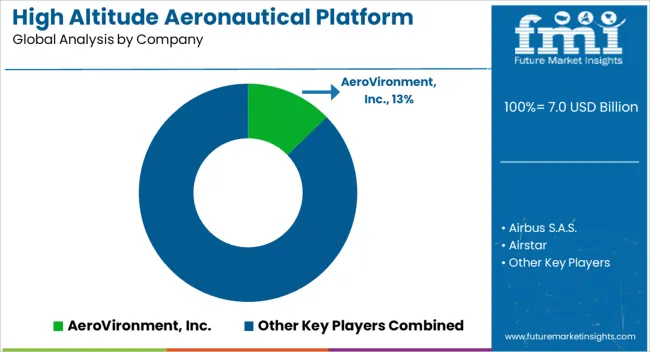
Sky Station, an airship system developed by Sky Station International, StartSat, an airship system developed by United Kingdom company Advanced Technology Group., moreover, Stratospheric Platform System, a project of the Wireless Innovation Systems Group of the Yokosuka Radio Communications Research Centre in Japan, are a few examples of high altitude aeronautical platform station projects. These big corporations are adopting several strategies, both together and individually, to lead the HAAPS market.
Example
| Report Attribute | Details |
|---|---|
| Growth Rate | CAGR of 9.8% from 2025 to 2035 |
| Base Year for Estimation | 2025 |
| Historical Data | 2020 to 2025 |
| Forecast Period | 2025 to 2035 |
| Quantitative Units | Revenue in USD million, Volume in Kilotons, and CAGR from 2025 to 2035 |
| Report Coverage | Revenue Forecast, Volume Forecast, Company Ranking, Competitive Landscape, Growth Factors, Trends, and Pricing Analysis |
| Segments Covered | Platform, Type, Region |
| Regions Covered | North America; Latin America; The Asia Pacific; The Middle East and Africa; Europe |
| Key Countries Profiled | United States, Canada, Brazil, Argentina, Germany, United Kingdom, France, Spain, Italy, Nordics, BENELUX, Australia & New Zealand, China, India, ASEAN, GCC, South Africa |
| Key Companies Profiled | AeroVironment, Inc.; Airbus S.A.S.; Airstar; AlphaLink; Augur RosAeroSystems; Avealto Ltd.; Bye Aerospace; Elektra Solar GmbH; ILC Dover L.P.; Lockheed Martin Corporation; Loon LLC; Raven Industries; Thales Group; World View Enterprises, Inc.; Zero 2 Infinity, S.L. |
| Customization | Available Upon Request |
The global high altitude aeronautical platform stations market is estimated to be valued at USD 7.0 billion in 2025.
The market size for the high altitude aeronautical platform stations market is projected to reach USD 17.9 billion by 2035.
The high altitude aeronautical platform stations market is expected to grow at a 9.8% CAGR between 2025 and 2035.
The key product types in high altitude aeronautical platform stations market are airplanes, airships and others.
In terms of type, unmanned segment to command 61.4% share in the high altitude aeronautical platform stations market in 2025.


Full Research Suite comprises of:
Market outlook & trends analysis
Interviews & case studies
Strategic recommendations
Vendor profiles & capabilities analysis
5-year forecasts
8 regions and 60+ country-level data splits
Market segment data splits
12 months of continuous data updates
DELIVERED AS:
PDF EXCEL ONLINE
High Performance Composites Market Forecast Outlook 2025 to 2035
High Performance Medical Plastic Market Forecast Outlook 2025 to 2035
High Temperature Heat Pump Dryers Market Size and Share Forecast Outlook 2025 to 2035
High Temperature Fiberglass Filter Media Market Size and Share Forecast Outlook 2025 to 2035
High Purity Tungsten Hexachloride Market Size and Share Forecast Outlook 2025 to 2035
High Purity Nano Aluminum Oxide Powder Market Size and Share Forecast Outlook 2025 to 2035
High Mast Lighting Market Forecast and Outlook 2025 to 2035
High-Protein Pudding Market Forecast and Outlook 2025 to 2035
High Voltage Ceramic Zinc Oxide Surge Arrester Market Size and Share Forecast Outlook 2025 to 2035
High-Power Microwave Source Market Size and Share Forecast Outlook 2025 to 2035
High Performance Epoxy Coating Market Size and Share Forecast Outlook 2025 to 2035
High Molecular Ammonium Polyphosphate Market Size and Share Forecast Outlook 2025 to 2035
High Performance Fluoropolymer Market Size and Share Forecast Outlook 2025 to 2035
High Throughput Screening Market Size and Share Forecast Outlook 2025 to 2035
High Barrier Packaging Films for Pharmaceuticals Market Size and Share Forecast Outlook 2025 to 2035
High Barrier Packaging Films Market Size and Share Forecast Outlook 2025 to 2035
High Purity Carbonyl Iron Powder (CIP) Market Size and Share Forecast Outlook 2025 to 2035
High Voltage PTC Heater Market Size and Share Forecast Outlook 2025 to 2035
High-Performance Fiber Market Size and Share Forecast Outlook 2025 to 2035
High Temperature Grease Market Size and Share Forecast Outlook 2025 to 2035

Thank you!
You will receive an email from our Business Development Manager. Please be sure to check your SPAM/JUNK folder too.
Chat With
MaRIA