

- Market Size (2026)
- USD 1.0 Bn
- Forecast (2036)
- USD 2.2 Bn
- CAGR (2026 to 2036)
- 8.1%
How big is the industrial carts market in 2026?
USD 1.0 billion in 2026, reaching USD 2.2 billion by 2036 at a 8.1% CAGR
The industrial carts market was valued at USD 0.9 billion in 2025. The market is set to reach USD 1.0 billion by 2026-end and grow at a CAGR of 8.1% between 2026-2036 to reach USD 2.2 billion by 2036. Platform Carts will dominate with a 30.0% share, while Manufacturing will lead with a 35.0% share.
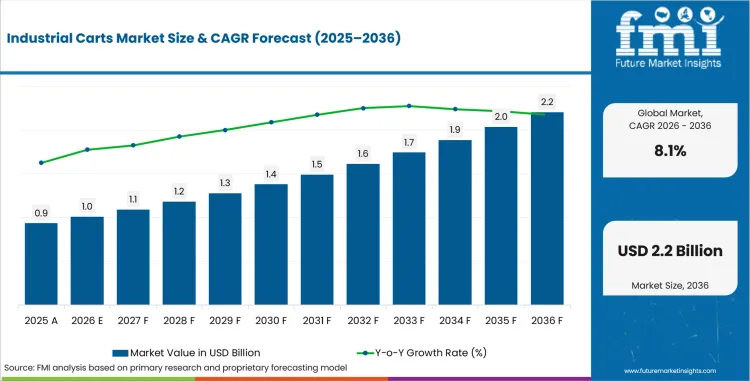
Key Takeaways, Market Size, and Forecast
- Industrial Carts Market Value (2026): USD 1.0 Bn
- Industrial Carts Market Forecast Value (2036): USD 2.2 Bn
- Industrial Carts Market CAGR (2026 TO 2036): 8.1%
- Industrial Carts Market Leading Product Segment: Platform Carts (30.0%)
- Industrial Carts Market Key Growth Regions: USA, South Korea, EU, UK, Japan
- Industrial Carts Market Key Players: FlexQube AB, Toyota Material Handling, Kinetic Technologies, Magline, Inc., Hamilton Caster & Mfg. Co., Other Companies (combined)
| Parameter | Details |
|---|---|
| Market Size in 2026 (Value) | USD 1.0 Bn |
| Market Forecast in 2036 (Value) | USD 2.2 Bn |
| CAGR (2026 to 2036) | 8.1% |
| Years Considered | 2021 to 2036 |
| Base Year | 2025 |
| Forecast Period | 2026 to 2036 |
| Units Considered | Value (USD Bn) |
| Leading Sub-Region | USA |
Summary of the Industrial Carts Market
- Demand and Growth Drivers
- Growth in warehouse operations, manufacturing throughput, and logistics facility expansion is driving demand for industrial carts that improve material handling efficiency and worker productivity.
- E-commerce fulfillment center buildout is creating concentrated demand for utility and platform carts used in order picking, packing, and internal material transport workflows.
- Ergonomic and safety regulations are encouraging adoption of engineered cart solutions that reduce manual lifting, improve load visibility, and minimize workplace injury risk.
- Product and Segment View
- Platform carts, versatile material transport equipment used in manufacturing, warehousing, and commercial facilities, constitute 30.0% of product share.
- Manufacturing applications are projected to account for 35.0% share as production facilities need carts for work-in-process transport, staging for tools and materials, and support for assembly lines.
- Industrial sector is the largest procurement segment for industrial grade cart equipment with 50.0% share in 2023.
- Geography and Competitive Outlook
- The USA leads with 8.4% CAGR, driven by warehouse growth, e-commerce fulfillment expansion, and manufacturing facility investment in material handling equipment.
- South Korea is not far behind with an 8.3% CAGR, supported by investments in manufacturing automation and logistics infrastructure development.
- Companies with modular cart designs and industrial distribution networks in place are well positioned to serve the growing demand for warehouse and manufacturing material handling.
- Analyst Opinion
- Nikhil Kaitwade, Principal Consultant at FMI says, 'Cart manufacturers that can deliver modular, configurable solutions adaptable to diverse warehouse and manufacturing workflows are likely to capture growing procurement demand from facility operators optimizing material handling efficiency over the forecast period.'
- The industrial carts market is expanding as warehouse and logistics facility buildout creates scaled procurement demand for material handling equipment.
- Adoption is increasing due to e-commerce fulfillment center requirements for efficient order picking and internal transport equipment.
- Demand is supported by manufacturing lean production initiatives that use cart-based material delivery systems to improve production line efficiency.
- Growth is attributable to ergonomic workplace standards that encourage investment in engineered material handling solutions.
What are industrial carts and what does the market cover?
Wheeled material-handling equipment for internal transport of goods, materials and tools across facilities
The industrial carts market encompasses wheeled material handling equipment used for internal transport of goods, materials, and tools within manufacturing, warehouse, and commercial facilities. Products include platform carts, utility carts, shelf and rack carts in steel, aluminum, and plastic construction with rubber, caster, and metal wheel configurations in manual and motorized mobility options.
What is included in the industrial carts market scope?
Platform carts, utility carts and shelf and rack carts in steel, aluminum and plastic, 2026 to 2036.
Market scope covers all commercially traded industrial carts categorized by product (platform carts, utility carts, shelf and rack carts), application (manufacturing, warehousing and logistics, healthcare), end use (industrial sector, commercial sector, healthcare sector), material (steel carts, aluminum carts, plastic carts), wheel type (rubber wheels, caster wheels, metal wheels), and mobility (manual carts, motorized carts). Revenue is tracked from 2026 to 2036.
What is excluded from the industrial carts market scope?
Forklift trucks, pallet jacks, and automated guided vehicles (AGVs)
The scope does not include forklift trucks, pallet jacks, or automated guided vehicles (AGVs) classified separately from manual and basic motorized cart equipment.
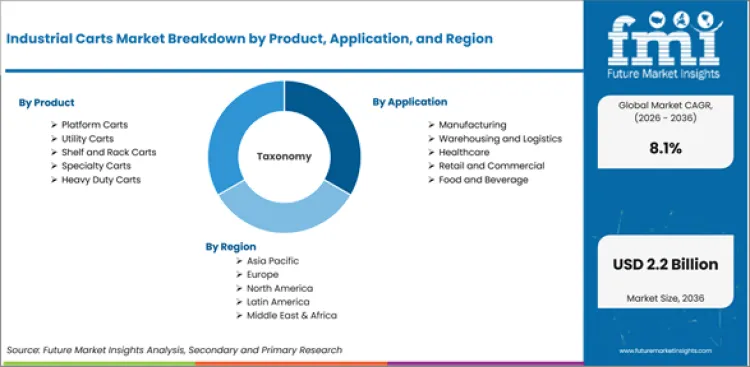
How was the industrial carts market research conducted?
Primary interviews, desk research, bottom-up sizing, and quarterly validation
- Primary Research: FMI analysts conducted interviews with material handling equipment manufacturers, warehouse operations managers, industrial distributors and facility design engineers in key markets.
- Desk Research: Consolidated data from material handling industry databases, warehouse construction statistics, and manufacturer revenue disclosures.
- Market Sizing and Forecasting Bottom up aggregation of cart sales by product type, application and geographic market with warehouse and manufacturing activity projections.
- Cross-validated quarterly with industrial distributor sales data, e-commerce facility construction tracking, and manufacturer shipment records.
Why is the industrial carts market growing?
Rising warehouse expansion and e-commerce fulfillment and lean-manufacturing adoption
- Demand for industrial carts used in order processing and internal material transport operations is concentrated due to warehouse expansion and growth in e-commerce fulfillment.
- The use of cart-based material delivery is gaining momentum in lean manufacturing systems to reduce forklift traffic and increase material availability at the production line.
- The USA leads with an 8.4% CAGR, the largest warehouse construction pipeline and e-commerce fulfillment center buildout in the world.
The need for efficient transportation of materials within warehouse and manufacturing operations drives demand for industrial carts. Platform carts hold 30.0% of product share and feature flat, open deck surfaces used to move boxes, totes and irregular-shaped items across facility floors. Enclosed shelving utility carts are used for tool distribution, maintenance operations and the transportation of healthcare materials. Shelf and rack carts offer organized, multi-level storage for order picking and assembly line material staging.
Carts transport work-in-process between workstations, deliver tools and components to assembly lines, and transport finished goods to shipping areas in production facilities, accounting for 35.0% of manufacturing applications. Warehousing and logistics applications are the fastest growing segment, driven by the expansion of e-commerce fulfillment centers that require high cart density for order picking workflows. In healthcare, applications include equipment mobility, medication delivery, and linen transport.
The industrial sector holds 50.0% of the end use share, while the commercial and healthcare sectors hold the rest of the demand. Steel construction is the most popular choice for heavy-duty industrial use. Aluminum and plastic carts are also available for lighter-duty commercial and healthcare use. For most applications, manual push carts still rule, but motorized versions are taking over for longer hauls and heavier loads.
How is the industrial carts market segmented?
By product, application, end use, material, wheel type and mobility
- Platform Carts 30.0% - Product share provides versatile flat-deck material transport for boxes, totes and equipment in facility environments.
- Application Share Manufacturing 35.0% Material supply for production lines and work in process movement are the key factors driving the industrial cart purchasing.
- Durable cart equipment for day-to-day material handling is critical to manufacturing and logistics operations in the industrial sector, accounting for 50.0% of end use share.
Why do platform carts lead the industrial carts market?
They hold 30.0% share, led by flat-deck designs for flexible load handling
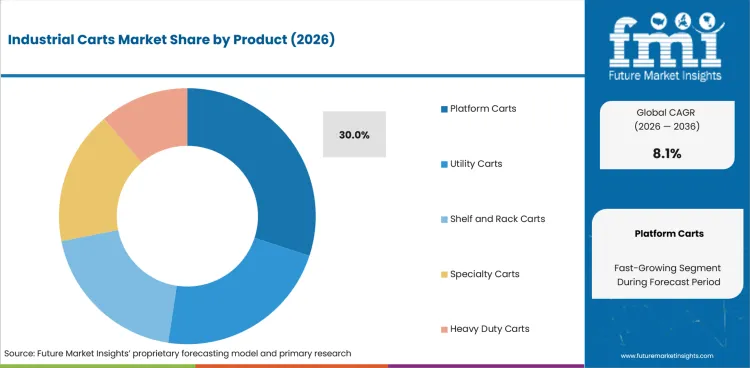
Product share of platform carts. 30.0% in 2026. They have flat deck surfaces with no sides or shelving, allowing for maximum flexibility in handling different types of loads. The deck size usually varies from 450 x 700 mm for small models to 1200 x 2400 mm for large platform trucks that can carry loads over 500 kg.
Steel platform carts are designed for the toughest industrial environments, where load capacity and durability are key. Ergonomic handle designs, swivel caster configurations and deck surface treatments (non-slip, anti-static) create product differentiation. Foldable platform carts are used in applications where storage space between uses is limited.
How big is the manufacturing segment in the industrial carts market?
About 35.0% share, led by lean material delivery replacing forklift transport
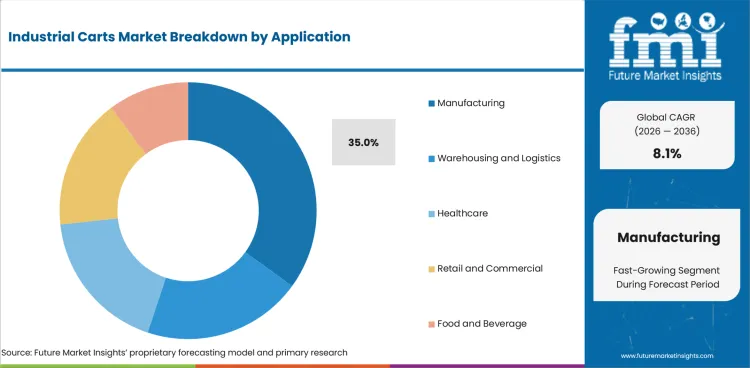
Applications in manufacturing will account for 35.0% of the applications in 2026. In lean manufacturing material delivery systems, industrial carts are utilized to replace forklift-dependent material transport for smaller loads. Kit carts bring pre-assembled sets of components to assembly stations, cutting down on line-side inventory and increasing flow efficiency in production.
Tool and maintenance carts are mobile work stations that enable technicians to service equipment anywhere in a facility. Partially assembled products are transported between production stages by work-in-process transport carts. In emerging markets, the expansion of manufacturing is leading to incremental demand for carts, as new facilities establish the material handling infrastructure for operations.
What drives and restrains the industrial carts market?
Driven by warehouse expansion and e-commerce fulfillment; restrained by low-cost imports squeezing margins
- Expanding demand for industrial carts across material handling applications is driven by warehouse expansion, e-commerce fulfillment growth and manufacturing investment.
- Margins for domestic manufacturers and premium industrial equipment brands are being squeezed by low-cost imported carts.
- For manufacturers serving custom warehouse and manufacturing workflows, growth opportunities involve developing modular and configurable cart systems.
Industrial Carts Market Grows With Warehouse Buildout, Manufacturing Expansion and Ergonomic Workplace Investment Pricing pressure from import competition is offset by growth opportunities from modular cart systems and new market facility expansion.
What drives demand?
Construction of e-commerce fulfillment centers needing high-density handling
Demand is driven by the construction of e-commerce fulfillment centers which enables high-density cart acquisition for order picking, packing and shipping operations. Hundreds of carts are required in each new fulfillment facility in picking zones, packing stations and shipping areas.
What opportunity does lean manufacturing create?
Cart-based lean material-delivery systems replacing forklift transport
Growth is driven by the implementation of cart-based lean manufacturing material delivery systems that improve production efficiency by reducing forklift traffic and ensuring line-side material availability through scheduled cart delivery routes.
How do safety standards shape demand?
Workplace safety and ergonomic rules favoring engineered handling equipment
Workplace safety rules and ergonomic standards promote investment in engineered material handling equipment, including properly designed carts that reduce manual lifting and improve the safety of load transport, and thus support demand.
Where is demand expanding?
New manufacturing and warehouse construction in emerging markets
The construction of manufacturing and warehouse facilities in emerging markets is spurring incremental demand for carts, as new operations equip material handling infrastructure with industrial-grade cart equipment.
Analysis of Industrial Carts Market By Key Countries
Which countries are growing fastest in the industrial carts market?
USA 8.4%, South Korea 8.3%, EU 8.0%, UK 7.9%, Japan 7.8% through 2036
.webp "Top Country Growth Comparison Industrial Carts Market Cagr (2026 2036)")
| Country | CAGR |
|---|---|
| USA | 8.4% |
| UK | 7.9% |
| EU | 8.0% |
| Japan | 7.8% |
| South Korea | 8.3% |
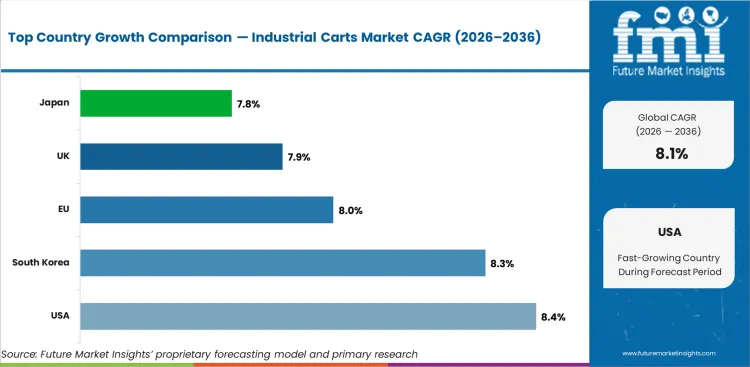
- Industrial Carts Market Analysis by Key Countries
- USA leads at 8.4% CAGR showing strong demand drivers.
- South Korea, at 8.3%, follows, aided by growing market activity.
- EU (8.0%) and UK (7.9%) still growing.
The global industrial carts market is estimated to grow at 8.1% CAGR from 2026 to 2036. The study covers more than 30 countries, and the key markets are listed below.
How fast is the industrial carts market growing in the United States?
8.4% CAGR through 2036, the fastest country-level market in the study
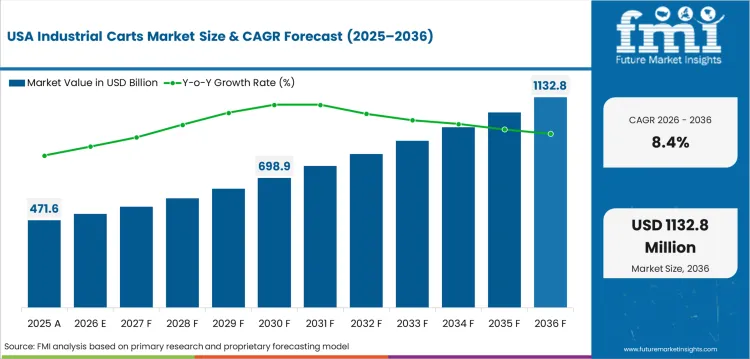
The United States leads at 8.4% CAGR through 2036. E-commerce fulfillment center expansion, manufacturing investment, and established industrial distribution sustain the largest national market.
- E-commerce warehouse construction by Amazon, Walmart, and other operators creates concentrated industrial cart procurement demand.
- Manufacturing facility investment including reshoring programs drives demand for production line material handling equipment.
- Industrial distribution networks including Grainger, MSC Industrial, and Uline provide extensive cart product availability and delivery capability.
What is the industrial carts market outlook in South Korea?
8.3% CAGR, driven by Manufacturing automation investment and logistics infrastructure development
South Korea is projected to register 8.3% CAGR through 2036. Manufacturing automation investment and logistics infrastructure development drive cart demand.
- Automotive and electronics manufacturing facilities invest in material handling cart systems as part of lean production optimization.
- Logistics infrastructure expansion including e-commerce fulfillment and distribution center construction creates cart procurement demand.
- Domestic industrial equipment distribution provides efficient procurement channels for manufacturing facility cart requirements.
What is driving industrial carts growth in the European Union?
8.0% CAGR, driven by Manufacturing activity, logistics expansion, and workplace safety standards
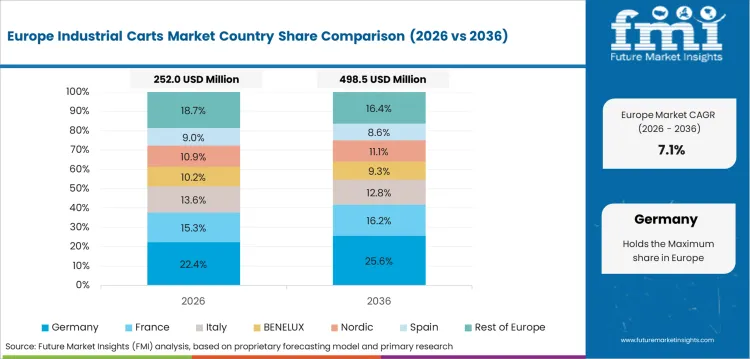
The European Union is projected to register 8.0% CAGR through 2036. Manufacturing activity, logistics expansion, and workplace safety standards sustain market growth.
- European manufacturing operations use engineered cart systems for lean production material delivery across automotive, aerospace, and general manufacturing.
- EU workplace health and safety directives encourage investment in ergonomic material handling equipment including properly designed industrial carts.
- Logistics center expansion across Germany, Netherlands, and Poland creates concentrated cart procurement demand.
How is the industrial carts market performing in the United Kingdom?
7.9% CAGR, driven by Warehouse expansion and manufacturing material handling investment
The United Kingdom is projected to register 7.9% CAGR through 2036. Warehouse expansion and manufacturing material handling investment sustain demand.
- UK warehouse and distribution center expansion, particularly around major logistics corridors, creates industrial cart procurement demand.
- Manufacturing operations invest in material handling equipment improvements as part of productivity and safety enhancement programs.
- HSE workplace safety requirements support adoption of engineered cart solutions that reduce manual handling injury risk.
What is the industrial carts market forecast for Japan?
7.8% CAGR, driven by Manufacturing precision material handling and quality-focused equipment selection
Japan is projected to register 7.8% CAGR through 2036. Manufacturing precision material handling and quality-focused equipment selection sustain demand.
- Japanese manufacturing operations require precision material handling equipment that meets facility cleanliness and organization standards.
- Kaizen-driven continuous improvement programs create ongoing demand for optimized cart designs that improve material flow efficiency.
- Domestic cart manufacturers provide quality-controlled products meeting Japanese manufacturing facility requirements.
Who are the leading companies in the industrial carts market?
FlexQube AB, Toyota Material Handling, Magline, Inc., and Hamilton Caster & Mfg. Co.
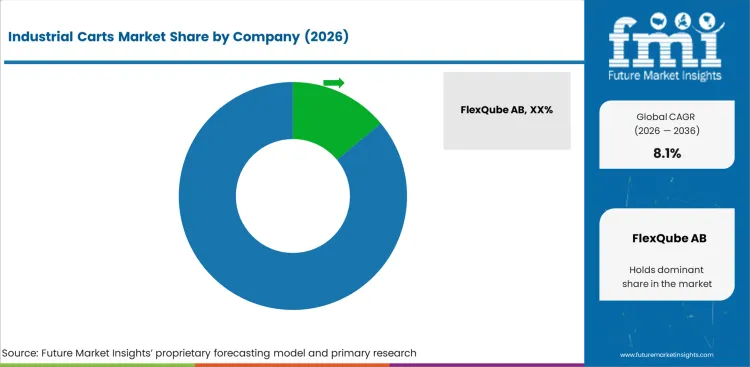
- FlexQube is a leader in modular industrial cart design, allowing the customer to customize carts to the specific needs of their warehouse and manufacturing workflows.
- Toyota Material Handling has solutions for industrial carts and material handling in its broad logistics equipment offering.
- Magline and Hamilton Caster are serving the North American industrial cart market through established manufacturing and industrial distribution channel presence.
- Kinetic Technologies and other manufacturers provide cart solutions that are used in specific application segments such as healthcare, hospitality and retail.
Who are the key players in the industrial carts market?
FlexQube AB, Toyota Material Handling, Magline, Inc. and Hamilton Caster & Mfg. Co., plus regional players
Key global companies leading the industrial carts market include:
- FlexQube AB (Sweden), Toyota Material Handling (Japan) and Magline, Inc. (USA) lead global industrial carts markets through modular product designs, established manufacturing infrastructure, and industrial distribution networks serving warehouse and manufacturing customers.
- Handle-iT Ltd. (USA) holds a strong position through custom industrial cart engineering and domestic manufacturing serving heavy-duty manufacturing and logistics applications.
- Additional cart manufacturers in China, India, and Eastern Europe are expanding product offerings targeting cost-sensitive warehouse and manufacturing material handling applications.
How do top industrial carts companies compare?
FlexQube AB and Toyota Material Handling lead globally; Magline, Inc. and Hamilton Caster & Mfg. Co. are regional specialists
| Company | Product Modularity | Manufacturing Scale | Industrial Distribution | Geographic Footprint |
|---|---|---|---|---|
| FlexQube | High | High | Strong | Global |
| Toyota Material Handling | High | High | Strong | Global |
| Magline, Inc. | Medium | Medium | Moderate | N. America |
| Handle-iT Ltd.. | Medium | Medium | Moderate | N. America |
Source: Future Market Insights competitive analysis, 2026.
Key Developments in Industrial Carts Market
- In 2025, FlexQube continued expanding its modular cart solutions portfolio, supporting manufacturers, warehouses, and distribution centers with configurable material handling systems designed to improve operational efficiency and workflow flexibility.
- In 2025, Toyota Material Handling continued strengthening its warehouse material handling portfolio through solutions focused on workplace safety, ergonomics, and productivity, supporting evolving logistics and distribution requirements.
Key Players in the Industrial Carts Market
Major Global Players
- FlexQube AB
- Toyota Material Handling
- Magline, Inc.
- Hamilton Caster & Mfg. Co.
Emerging Players/Startups
- Handle-iT Ltd.
- Caster Concepts Inc.
- Ergonomic Partners
- FlexCraft Company
- Nutting Carts & Trailers
What does the industrial carts market report cover?
Industrial Carts Market - Research Methodology
| Method | Description |
|---|---|
| Primary Research | FMI analysts conducted interviews with manufacturers, distributors, procurement specialists, and end-use operators across USA, UK, and EU to validate demand patterns and pricing structures for Platform Carts, and Utility Carts and related product categories. |
| Desk Research | Combined trade statistics, regulatory filings, industry association data, and manufacturer disclosures to establish baseline parameters for Industrial Carts across product, application, end use, material, wheel, and mobility segments. |
| Market Sizing & Forecasting | Bottom-up aggregation across Platform Carts, Utility Carts, and Shelf and Rack Carts product categories and Manufacturing, Warehousing and Logistics, and Healthcare application segments, triangulated with top-down macro indicators and regional adoption curves. |
| Data Validation | Cross-checked quarterly against production statistics, trade flow data, and manufacturer revenue disclosures for Industrial Carts products. |
2016 to 2025 history and 2026 to 2036 forecasts across all segments and 30+ countries
| Parameter | Details |
|---|---|
| Market size by 2036 | USD 2.2 Billion |
| Growth rate | 8.1% CAGR (2026 to 2036) |
| Forecast period | 2026 to 2036 |
| Base year value (2025) | USD 0.9 Billion |
| Key Segment Covered | Product, Application, End Use, Material, Wheel Type, Mobility |
| Regions covered | North America, Latin America, Eastern Europe, Western Europe, East Asia, South Asia and Pacific, Middle East and Africa |
| Countries covered | USA, UK, EU, Japan, South Korea, 30 plus countries |
| Key companies profiled | FlexQube AB, Toyota Material Handling, Magline, Inc., Handle-iT Ltd., Other Companies (combined) |
| Approach | Hybrid bottom-up and top-down methodology starting with verified transaction data, projecting adoption velocity across segments and regions. |
Market Segmentation Analysis
Industrial Carts Market Segmented by Product:
- Platform Carts
- Flat Platform Carts
- Heavy Duty Platform
- Low Profile Platform
- Folding Platform Carts
- Collapsible Design
- Compact Storage
- Flat Platform Carts
- Utility Carts
- Open Shelf Carts
- Two Shelf Carts
- Three Shelf Carts
- Enclosed Utility Carts
- Cabinet Carts
- Lockable Storage
- Open Shelf Carts
- Shelf and Rack Carts
- Multi Tier Shelf Carts
- Adjustable Shelves
- Fixed Shelves
- Rack Carts
- Vertical Rack Carts
- Horizontal Rack Carts
- Multi Tier Shelf Carts
- Specialty Carts
- Drum and Barrel Carts
- Single Drum Carriers
- Multi Drum Carriers
- Tool and Instrument Carts
- Workshop Tool Carts
- Precision Equipment Carts
- Drum and Barrel Carts
- Heavy Duty Carts
- High Load Capacity Carts
- Industrial Grade Carts
- Reinforced Frame Carts
- Motorized Carts
- Electric Powered Carts
- Battery Operated Carts
- High Load Capacity Carts
Industrial Carts Market Segmented by Application:
- Manufacturing
- Assembly Line Transport
- Component Handling
- Work In Progress Movement
- Material Handling
- Raw Material Transport
- Finished Goods Movement
- Assembly Line Transport
- Warehousing and Logistics
- Order Picking
- E Commerce Fulfillment
- Inventory Handling
- Internal Transport
- Warehouse Movement
- Dock Operations
- Order Picking
- Healthcare
- Medical Equipment Transport
- Surgical Equipment
- Diagnostic Devices
- Patient Care Support
- Medication Delivery
- Hospital Supplies
- Medical Equipment Transport
- Retail and Commercial
- Store Operations
- Stock Replenishment
- Merchandising
- Back End Logistics
- Storage Movement
- Inventory Transfer
- Store Operations
- Food and Beverage
- Processing Plants
- Raw Material Handling
- Packaging Transport
- Catering and Hospitality
- Food Service Carts
- Kitchen Transport
- Processing Plants
Industrial Carts Market Segmented by End Use:
- Industrial Sector
- Manufacturing Facilities
- Automotive Plants
- Machinery Plants
- Logistics Centers
- Warehouses
- Distribution Centers
- Manufacturing Facilities
- Commercial Sector
- Retail Chains
- Supermarkets
- Shopping Centers
- Hospitality
- Hotels
- Restaurants
- Retail Chains
- Healthcare Sector
- Hospitals
- Public Hospitals
- Private Hospitals
- Clinics and Labs
- Diagnostic Centers
- Research Labs
- Hospitals
Industrial Carts Market Segmented by Material:
- Steel Carts
- Carbon Steel
- High Strength
- Industrial Applications
- Stainless Steel
- Corrosion Resistant
- Food and Medical Use
- Carbon Steel
- Aluminum Carts
- Lightweight Aluminum
- Easy Handling
- Portable Use
- Reinforced Aluminum
- High Strength Lightweight
- Durable Frames
- Lightweight Aluminum
- Plastic Carts
- HDPE Carts
- Chemical Resistant
- Healthcare Use
- Polypropylene Carts
- Lightweight
- Low Maintenance
- HDPE Carts
- Composite Material Carts
- Fiber Reinforced
- High Durability
- Lightweight Design
- Hybrid Materials
- Metal Polymer Mix
- Advanced Structures
- Fiber Reinforced
Industrial Carts Market Segmented by Wheel Type:
- Rubber Wheels
- Solid Rubber
- Shock Absorption
- Noise Reduction
- Pneumatic Rubber
- Outdoor Use
- Rough Terrain
- Solid Rubber
- Caster Wheels
- Swivel Casters
- High Maneuverability
- 360 Degree Rotation
- Fixed Casters
- Straight Movement
- Load Stability
- Swivel Casters
- Metal Wheels
- Steel Wheels
- Heavy Load Handling
- Industrial Use
- Polyurethane Coated
- Wear Resistance
- Floor Protection
- Steel Wheels
Industrial Carts Market Segmented by Mobility:
- Manual Carts
- Push Carts
- Ergonomic Handles
- Standard Movement
- Pull Carts
- Towable Design
- Multi Cart Linking
- Push Carts
- Motorized Carts
- Electric Powered
- Battery Operated
- Heavy Load Transport
- Autonomous Carts
- Automated Guided Vehicles
- Smart Navigation
- Electric Powered
Industrial Carts Market by Region:
- North America
- USA
- Canada
- Mexico
- Latin America
- Brazil
- Chile
- Rest of Latin America
- Western Europe
- Germany
- UK
- Italy
- Spain
- France
- Nordic
- BENELUX
- Rest of Western Europe
- Eastern Europe
- Russia
- Poland
- Hungary
- Balkan & Baltic
- Rest of Eastern Europe
- East Asia
- China
- Japan
- South Korea
- South Asia and Pacific
- India
- ASEAN
- Australia & New Zealand
- Rest of South Asia and Pacific
- Middle East & Africa
- Kingdom of Saudi Arabia
- Other GCC Countries
- Türkiye
- South Africa
- Other African Union
- Rest of Middle East & Africa
Research Sources and Bibliography
- Material Handling Industry. (2025). MHI Annual Industry Report. MHI.
- Occupational Safety and Health Administration. (2025). OSHA Guidelines for Manual Material Handling. OSHA.
- International Organization for Standardization. (2025). ISO Standards for Industrial Trucks and Material Handling Equipment. ISO.
- European Committee for Standardization. (2025). CEN Standards for Material Handling Equipment Safety. CEN.
- Warehousing Education and Research Council. (2025). WERC Warehousing Operations Best Practices. WERC.
This bibliography is provided for reader reference.
This Report Answers
- Estimating the size of the industrial carts market and projected revenue from 2026 to 2036.
- Segmentation by product, application, end use, material, wheel type, mobility.
- Insights about more than 30 regional markets.
- Analysis of key market dynamics including demand drivers, restraints, and emerging opportunities.
- Assessment of the competitive landscape and strategic positioning of leading companies.
- Identifying investment opportunities across key product segments and geographic markets.
- Supply chain and distribution channel analysis.
- Delivery of data in PDF and Excel formats.
Frequently Asked Questions
How big is the industrial carts market in 2026?
The global industrial carts market is estimated to be valued at USD 1.0 billion in 2026.
What will be the size of the industrial carts market in 2036?
The market size for the industrial carts market is projected to reach USD 2.2 billion by 2036.
How much will the industrial carts market growth be between 2026 and 2036?
The industrial carts market is expected to grow at a 8.1% CAGR between 2026 and 2036.
What are the key products in the industrial carts market?
The key products in the industrial carts market are Platform Carts, Utility Carts, Shelf and Rack Carts, Specialty Carts and Heavy Duty Carts.
Which application segment is expected to contribute a significant share in the industrial carts market in 2026?
In terms of application, the manufacturing segment is expected to command 35.0% share in the industrial carts market in 2026.
Preview the report firsthand - request a free sample
Get SampleGet the brochure for pricing and purchase details.
Get PDFTable of Content
- Key Takeaways
- Market Size and CAGR
- Top Growth Driver
- Fastest Growing Segment
- Leading Region
- Key Companies
- Emerging Opportunities
- Executive Summary
- Global Market Outlook
- Demand-side Trends
- Supply-side Trends
- Technology Roadmap Analysis
- Analysis and Recommendations
- Analyst Perspective (What is happening? Why now? What should investors know?)
- Key Questions Answered
- How large is the market?
- What is the CAGR?
- What are key trends?
- Which region dominates?
- Who are the leaders?
- Market Overview
- Market Coverage / Taxonomy
- Market Definition / Scope / Limitations
- Research Methodology
- Chapter Orientation
- Analytical Lens and Working Hypotheses
- Market Structure, Signals, and Trend Drivers
- Benchmarking and Cross-market Comparability
- Market Sizing, Forecasting, and Opportunity Mapping
- Research Design and Evidence Framework
- Desk Research Programme (Secondary Evidence)
- Expert Input and Fieldwork (Primary Evidence)
- Tooling, Models, and Reference Databases
- Data Engineering and Model Build
- Quality Assurance and Audit Trail
- Market Background
- Market Dynamics (Drivers, Restraints, Opportunity, Trends)
- Scenario Forecast (Optimistic, Likely, Conservative)
- Impact Analysis
- AI Impact
- Sustainability Impact
- Regulatory Impact
- Technology Impact
- Consumer / Buyer Analysis
- Purchase Drivers
- Adoption Barriers
- Buyer Journey
- Opportunity Map Analysis
- Product Life Cycle Analysis
- Supply Chain Analysis
- Investment Feasibility Matrix
- Value Chain Analysis
- PESTLE and Porter's Analysis
- Regulatory Landscape
- Regional Parent Market Outlook
- Production and Consumption Statistics
- Import and Export Statistics
- Global Market Analysis and Forecast, 2021 to 2036
- Historical Market Size Value (USD Million) Analysis, 2021 to 2025
- Current and Future Market Size Value (USD Million) Projections, 2026 to 2036
- Y-o-Y Growth Trend Analysis
- Absolute $ Opportunity Analysis
- Global Market Pricing Analysis, 2021 to 2036
- Global Market Analysis and Forecast, By Product, 2021 to 2036
- Introduction / Key Findings
- Historical Market Size Value (USD Million) Analysis By Product, 2021 to 2025
- Current and Future Market Size Value (USD Million) Analysis and Forecast By Product, 2026 to 2036
- Platform Carts
- Flat Platform Carts
- Folding Platform Carts
- Utility Carts
- Open Shelf Carts
- Enclosed Utility Carts
- Shelf and Rack Carts
- Multi Tier Shelf Carts
- Rack Carts
- Specialty Carts
- Drum and Barrel Carts
- Tool and Instrument Carts
- Heavy Duty Carts
- High Load Capacity Carts
- Motorized Carts
- Platform Carts
- Y-o-Y Growth Trend Analysis By Product, 2021 to 2025
- Absolute $ Opportunity Analysis By Product, 2026 to 2036
- Global Market Analysis and Forecast, By Application, 2021 to 2036
- Introduction / Key Findings
- Historical Market Size Value (USD Million) Analysis By Application, 2021 to 2025
- Current and Future Market Size Value (USD Million) Analysis and Forecast By Application, 2026 to 2036
- Manufacturing
- Assembly Line Transport
- Material Handling
- Warehousing and Logistics
- Order Picking
- Internal Transport
- Healthcare
- Medical Equipment Transport
- Patient Care Support
- Retail and Commercial
- Store Operations
- Back End Logistics
- Food and Beverage
- Processing Plants
- Catering and Hospitality
- Manufacturing
- Y-o-Y Growth Trend Analysis By Application, 2021 to 2025
- Absolute $ Opportunity Analysis By Application, 2026 to 2036
- Global Market Analysis and Forecast, By End Use, 2021 to 2036
- Introduction / Key Findings
- Historical Market Size Value (USD Million) Analysis By End Use, 2021 to 2025
- Current and Future Market Size Value (USD Million) Analysis and Forecast By End Use, 2026 to 2036
- Industrial Sector
- Manufacturing Facilities
- Logistics Centers
- Commercial Sector
- Retail Chains
- Hospitality
- Healthcare Sector
- Hospitals
- Clinics and Labs
- Industrial Sector
- Y-o-Y Growth Trend Analysis By End Use, 2021 to 2025
- Absolute $ Opportunity Analysis By End Use, 2026 to 2036
- Global Market Analysis and Forecast, By Material, 2021 to 2036
- Introduction / Key Findings
- Historical Market Size Value (USD Million) Analysis By Material, 2021 to 2025
- Current and Future Market Size Value (USD Million) Analysis and Forecast By Material, 2026 to 2036
- Steel Carts
- Carbon Steel
- Stainless Steel
- Aluminum Carts
- Lightweight Aluminum
- Reinforced Aluminum
- Plastic Carts
- HDPE Carts
- Polypropylene Carts
- Composite Material Carts
- Fiber Reinforced
- Hybrid Materials
- Y-o-Y Growth Trend Analysis By Material, 2021 to 2025
- Absolute $ Opportunity Analysis By Material, 2026 to 2036
- Steel Carts
- Global Market Analysis and Forecast, By Wheel Type
- Introduction / Key Findings
- Historical Market Size Value (USD Million) Analysis By Wheel Type, 2021 to 2025
- Current and Future Market Size Value (USD Million) Analysis and Forecast By Wheel Type, 2026 to 2036
- Rubber Wheels
- Solid Rubber
- Pneumatic Rubber
- Caster Wheels
- Swivel Casters
- Fixed Casters
- Metal Wheels
- Steel Wheels
- Polyurethane Coated
- Y-o-Y Growth Trend Analysis By Wheel Type, 2021 to 2025
- Absolute $ Opportunity Analysis By Wheel Type, 2026 to 2036
- Rubber Wheels
- Global Market Analysis and Forecast, By Mobility
- Introduction / Key Findings
- Historical Market Size Value (USD Million) Analysis By Mobility, 2021 to 2025
- Current and Future Market Size Value (USD Million) Analysis and Forecast By Mobility, 2026 to 2036
- Manual Carts
- Push Carts
- Pull Carts
- Motorized Carts
- Electric Powered
- Autonomous Carts
- Y-o-Y Growth Trend Analysis By Mobility, 2021 to 2025
- Absolute $ Opportunity Analysis By Mobility, 2026 to 2036
- Manual Carts
- Global Market Analysis and Forecast, By Region, 2021 to 2036
- Introduction
- Historical Market Size Value (USD Million) Analysis By Region, 2021 to 2025
- Current Market Size Value (USD Million) Analysis and Forecast By Region, 2026 to 2036
- North America
- Latin America
- Western Europe
- Eastern Europe
- East Asia
- South Asia and Pacific
- Middle East & Africa
- Market Attractiveness Analysis By Region
- North America Market Analysis and Forecast, By Country, 2021 to 2036
- Historical Market Size Value (USD Million) Trend Analysis By Market Taxonomy, 2021 to 2025
- Market Size Value (USD Million) Forecast By Market Taxonomy, 2026 to 2036
- By Country
- USA
- Canada
- Mexico
- By Product
- By Application
- By End Use
- By Material
- By Wheel Type
- By Mobility
- By Country
- Market Attractiveness Analysis
- By Country
- By Product
- By Application
- By End Use
- By Material
- By Wheel Type
- By Mobility
- Key Takeaways
- Latin America Market Analysis and Forecast, By Country
- Historical Market Size Value (USD Million) Trend Analysis By Market Taxonomy, 2021 to 2025
- Market Size Value (USD Million) Forecast By Market Taxonomy, 2026 to 2036
- By Country
- Brazil
- Chile
- Rest of Latin America
- By Product
- By Application
- By End Use
- By Material
- By Wheel Type
- By Mobility
- By Country
- Market Attractiveness Analysis
- By Country
- By Product
- By Application
- By End Use
- By Material
- By Wheel Type
- By Mobility
- Key Takeaways
- Western Europe Market Analysis and Forecast, By Country
- Historical Market Size Value (USD Million) Trend Analysis By Market Taxonomy, 2021 to 2025
- Market Size Value (USD Million) Forecast By Market Taxonomy, 2026 to 2036
- By Country
- Germany
- UK
- Italy
- Spain
- France
- Nordic
- BENELUX
- Rest of Western Europe
- By Product
- By Application
- By End Use
- By Material
- By Wheel Type
- By Mobility
- By Country
- Market Attractiveness Analysis
- By Country
- By Product
- By Application
- By End Use
- By Material
- By Wheel Type
- By Mobility
- Key Takeaways
- Eastern Europe Market Analysis and Forecast, By Country
- Historical Market Size Value (USD Million) Trend Analysis By Market Taxonomy, 2021 to 2025
- Market Size Value (USD Million) Forecast By Market Taxonomy, 2026 to 2036
- By Country
- Russia
- Poland
- Hungary
- Balkan & Baltic
- Rest of Eastern Europe
- By Product
- By Application
- By End Use
- By Material
- By Wheel Type
- By Mobility
- By Country
- Market Attractiveness Analysis
- By Country
- By Product
- By Application
- By End Use
- By Material
- By Wheel Type
- By Mobility
- Key Takeaways
- East Asia Market Analysis and Forecast, By Country
- Historical Market Size Value (USD Million) Trend Analysis By Market Taxonomy, 2021 to 2025
- Market Size Value (USD Million) Forecast By Market Taxonomy, 2026 to 2036
- By Country
- China
- Japan
- South Korea
- By Product
- By Application
- By End Use
- By Material
- By Wheel Type
- By Mobility
- By Country
- Market Attractiveness Analysis
- By Country
- By Product
- By Application
- By End Use
- By Material
- By Wheel Type
- By Mobility
- Key Takeaways
- South Asia and Pacific Market Analysis and Forecast, By Country
- Historical Market Size Value (USD Million) Trend Analysis By Market Taxonomy, 2021 to 2025
- Market Size Value (USD Million) Forecast By Market Taxonomy, 2026 to 2036
- By Country
- India
- ASEAN
- Australia & New Zealand
- Rest of South Asia and Pacific
- By Product
- By Application
- By End Use
- By Material
- By Wheel Type
- By Mobility
- By Country
- Market Attractiveness Analysis
- By Country
- By Product
- By Application
- By End Use
- By Material
- By Wheel Type
- By Mobility
- Key Takeaways
- Middle East & Africa Market Analysis and Forecast, By Country
- Historical Market Size Value (USD Million) Trend Analysis By Market Taxonomy, 2021 to 2025
- Market Size Value (USD Million) Forecast By Market Taxonomy, 2026 to 2036
- By Country
- Kingdom of Saudi Arabia
- Other GCC Countries
- Türkiye
- South Africa
- Other African Union
- Rest of Middle East & Africa
- By Product
- By Application
- By End Use
- By Material
- By Wheel Type
- By Mobility
- By Country
- Market Attractiveness Analysis
- By Country
- By Product
- By Application
- By End Use
- By Material
- By Wheel Type
- By Mobility
- Key Takeaways
- Key Countries Market Analysis
- USA
- Pricing Analysis
- Market Share Analysis, 2025
- By Product
- By Application
- By End Use
- By Material
- By Wheel Type
- By Mobility
- Canada
- Pricing Analysis
- Market Share Analysis, 2025
- By Product
- By Application
- By End Use
- By Material
- By Wheel Type
- By Mobility
- Mexico
- Pricing Analysis
- Market Share Analysis, 2025
- By Product
- By Application
- By End Use
- By Material
- By Wheel Type
- By Mobility
- Brazil
- Pricing Analysis
- Market Share Analysis, 2025
- By Product
- By Application
- By End Use
- By Material
- By Wheel Type
- By Mobility
- Chile
- Pricing Analysis
- Market Share Analysis, 2025
- By Product
- By Application
- By End Use
- By Material
- By Wheel Type
- By Mobility
- Germany
- Pricing Analysis
- Market Share Analysis, 2025
- By Product
- By Application
- By End Use
- By Material
- By Wheel Type
- By Mobility
- UK
- Pricing Analysis
- Market Share Analysis, 2025
- By Product
- By Application
- By End Use
- By Material
- By Wheel Type
- By Mobility
- Italy
- Pricing Analysis
- Market Share Analysis, 2025
- By Product
- By Application
- By End Use
- By Material
- By Wheel Type
- By Mobility
- Spain
- Pricing Analysis
- Market Share Analysis, 2025
- By Product
- By Application
- By End Use
- By Material
- By Wheel Type
- By Mobility
- France
- Pricing Analysis
- Market Share Analysis, 2025
- By Product
- By Application
- By End Use
- By Material
- By Wheel Type
- By Mobility
- India
- Pricing Analysis
- Market Share Analysis, 2025
- By Product
- By Application
- By End Use
- By Material
- By Wheel Type
- By Mobility
- ASEAN
- Pricing Analysis
- Market Share Analysis, 2025
- By Product
- By Application
- By End Use
- By Material
- By Wheel Type
- By Mobility
- Australia & New Zealand
- Pricing Analysis
- Market Share Analysis, 2025
- By Product
- By Application
- By End Use
- By Material
- By Wheel Type
- By Mobility
- China
- Pricing Analysis
- Market Share Analysis, 2025
- By Product
- By Application
- By End Use
- By Material
- By Wheel Type
- By Mobility
- Japan
- Pricing Analysis
- Market Share Analysis, 2025
- By Product
- By Application
- By End Use
- By Material
- By Wheel Type
- By Mobility
- South Korea
- Pricing Analysis
- Market Share Analysis, 2025
- By Product
- By Application
- By End Use
- By Material
- By Wheel Type
- By Mobility
- Russia
- Pricing Analysis
- Market Share Analysis, 2025
- By Product
- By Application
- By End Use
- By Material
- By Wheel Type
- By Mobility
- Poland
- Pricing Analysis
- Market Share Analysis, 2025
- By Product
- By Application
- By End Use
- By Material
- By Wheel Type
- By Mobility
- Hungary
- Pricing Analysis
- Market Share Analysis, 2025
- By Product
- By Application
- By End Use
- By Material
- By Wheel Type
- By Mobility
- Kingdom of Saudi Arabia
- Pricing Analysis
- Market Share Analysis, 2025
- By Product
- By Application
- By End Use
- By Material
- By Wheel Type
- By Mobility
- Türkiye
- Pricing Analysis
- Market Share Analysis, 2025
- By Product
- By Application
- By End Use
- By Material
- By Wheel Type
- By Mobility
- South Africa
- Pricing Analysis
- Market Share Analysis, 2025
- By Product
- By Application
- By End Use
- By Material
- By Wheel Type
- By Mobility
- USA
- Market Structure Analysis
- Competition Dashboard
- Competition Benchmarking
- Market Share Analysis of Top Players
- By Regional
- By Product
- By Application
- By End Use
- By Material
- By Wheel Type
- By Mobility
- Emerging Startups
- Innovation Benchmarking
- Competition Analysis
- Competition Deep Dive
- FlexQube AB
- Overview
- Product Portfolio
- Profitability by Market Segments (Product/Region/Sales Channel)
- Sales Footprint
- Strategy Overview
- Marketing Strategy
- Product Strategy
- Channel Strategy
- Toyota Material Handling
- Kinetic Technologies
- Magline, Inc.
- Hamilton Caster & Mfg. Co.
- Other Companies (combined)
- FlexQube AB
- Case Studies
- Success Stories
- Recent Developments
- Competition Deep Dive
- Assumptions & Acronyms Used


