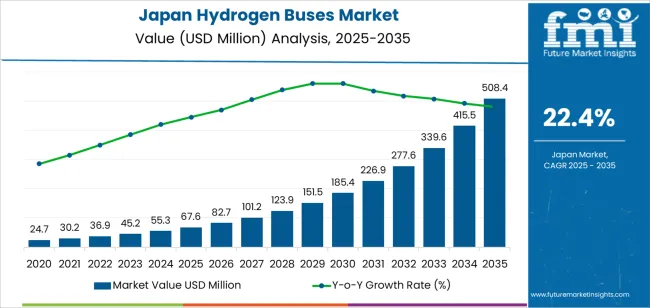
The Japan hydrogen buses demand is valued at USD 67.6 million in 2025 and is expected to reach USD 508.4 million by 2035, corresponding to a CAGR of 22.4%. Demand is driven by the expansion of low-emission public transport fleets and continued investment in hydrogen mobility programs. Hydrogen buses support long operating ranges, rapid refuelling, and stable performance in high-frequency urban routes, which makes them suitable for municipal and intercity transit. Their integration aligns with national objectives to diversify clean transportation technologies and reduce dependence on diesel-powered fleets.
Proton exchange membrane fuel cells represent the leading technology. Their efficiency, compact design, and suitability for variable-load driving cycles support broad adoption in transit buses. Fuel-cell systems also provide consistent output in cold climates and dense traffic conditions, which are common in major Japanese cities. Their compatibility with onboard hydrogen storage systems further supports use in both single-deck and articulated bus configurations.
Kyushu & Okinawa, Kanto, and Kinki show the strongest regional demand. These regions host major metropolitan transit networks, pilot deployment programs, and hydrogen infrastructure projects. Their public transportation operators continue to integrate fuel-cell buses into medium- and high-capacity routes as part of long-term fleet decarbonisation plans. Tata Motors Limited, Thor Industries, Hyundai, Ballard Power Systems, NovaBus Corporation, and New Flyer Industries Ltd are the principal suppliers. Their portfolios include fuel-cell bus platforms, powertrain systems, and hydrogen propulsion modules designed for municipal fleets and structured transit operations.
The early growth curve from 2025 to 2029 shows a pronounced rise as municipalities expand zero-emission public-transport pilots and national programmes support deployment of hydrogen-fuel infrastructure. Early momentum is shaped by city-level fleet trials, replacement of ageing diesel units, and integration of hydrogen buses into airport, regional, and metropolitan routes. Procurement during this phase is driven by policy alignment, fleet-testing requirements, and initial build-out of refuelling corridors.
From 2030 to 2035, the late growth curve accelerates more sharply as early demonstrations convert into larger fleet commitments. By this period, bus manufacturers, energy suppliers, and local authorities operate within clearer cost, maintenance, and refuelling benchmarks, enabling wider procurement. Late-period expansion also reflects improved stack durability, reduced hydrogen-storage weight, and standardised depot-refilling systems. Growth becomes broader and more commercially anchored as hydrogen buses move from trial adoption to regular fleet planning. The comparison shows an early phase defined by policy-driven pilots and a later phase marked by scaled deployments supported by maturing technology, stable operating models, and expanding hydrogen-supply networks across Japan.
| Metric | Value |
|---|---|
| Japan Hydrogen Buses Sales Value (2025) | USD 67.6 million |
| Japan Hydrogen Buses Forecast Value (2035) | USD 508.4 million |
| Japan Hydrogen Buses Forecast CAGR (2025-2035) | 22.4% |
Demand for hydrogen-buses in Japan is growing as cities and transport authorities seek zero-emission public-transit options to meet climate-goals and reduce urban air pollution. Government policy supports fuel-cell vehicle deployment, with subsidies and infrastructure initiatives targeting commercial buses and heavy-duty vehicles. Advances in hydrogen-fuel-cell technology and expanding refuelling-station networks help improve operational reliability and reduce total-cost-of-ownership for bus operators.
Large corporate fleets and municipal transit agencies include hydrogen-bus procurement in broader mobility-decarbonisation plans, which boosts demand for vehicles and related hydrogen infrastructure. Constraints include high upfront cost of hydrogen-buses compared with diesel or battery-electric alternatives, limited hydrogen refuelling infrastructure in some regions and longer deployment lead-times due to vehicle certification, pilot programmes and fleet integration. Some transit operators may delay orders until fuel-supply and maintenance-ecosystem maturity improves.
Demand for hydrogen buses in Japan reflects energy-transition initiatives, fleet-modernisation programs, and the need for zero-emission public-transport solutions across urban and regional networks. Technology choices vary by fuel-cell characteristics, efficiency levels, and operational temperatures suitable for different route profiles. Application patterns reflect municipal and institutional fleet requirements where consistent route structures and predictable refuelling cycles support hydrogen adoption. Power-output distribution shows how operators match propulsion capability with terrain, passenger load, and duty-cycle needs.
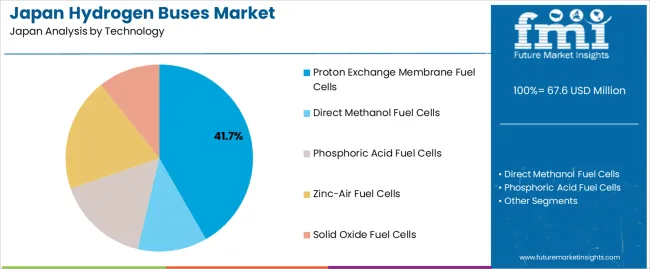
Proton exchange membrane fuel cells hold 41.7% of national demand and represent the leading technology. Their low operating temperature, rapid start-up capability, and strong power-to-weight characteristics support use in urban and regional bus fleets. Zinc-air systems represent 19.6%, offering extended energy density for longer routes but requiring controlled air-management systems. Phosphoric acid fuel cells account for 16.0%, supporting steady-load applications with stable thermal characteristics. Direct methanol fuel cells hold 12.0%, used for limited-range vehicles requiring simplified fuel handling. Solid oxide fuel cells represent 10.7%, supporting high-temperature operations suited to long-distance, constant-load service. Technology distribution reflects efficiency, thermal conditions, and fleet-route compatibility.
Key drivers and attributes:
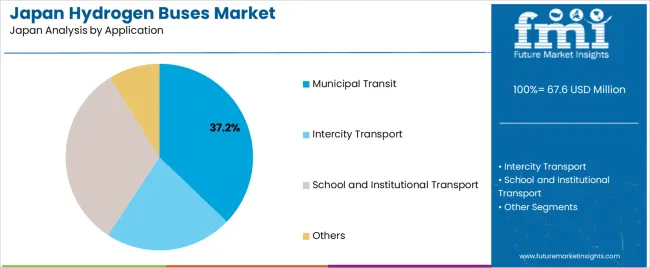
Municipal transit holds 37.2% of national demand and represents the leading application. Urban routes with high stop-and-go frequency and predictable scheduling support hydrogen-bus integration into city-fleet operations. School and institutional transport accounts for 32.0%, where fixed routes and central depots allow controlled refuelling logistics. Intercity transport represents 22.0%, supporting medium- to long-distance services requiring consistent propulsion performance and route stability. Other applications represent 8.8%, including corporate transport and specialised shuttle services. Application distribution reflects route length, depot infrastructure, and operational predictability across Japanese passenger-transport systems.
Key drivers and attributes:
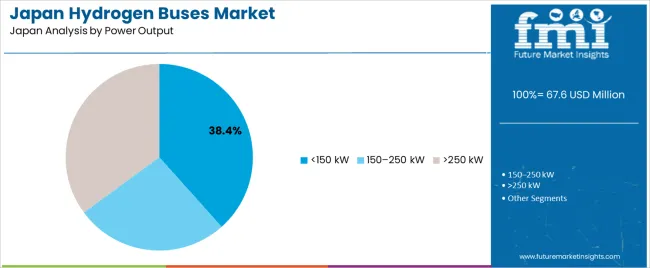
Hydrogen buses rated below 150 kW hold 38.4% of national demand and represent the dominant power-output category. These systems support urban transit routes with moderate terrain, frequent stops, and standard passenger loads. Buses rated above 250 kW account for 35.1%, supporting heavy-duty, long-distance, or high-load operations requiring sustained propulsion. Models rated 150–250 kW represent 26.5%, used in mixed-route networks combining urban and regional service patterns. Power-output distribution reflects duty-cycle characteristics, fleet-performance expectations, and route-specific energy requirements across Japanese hydrogen-bus deployments.
Key drivers and attributes:
Increasing government support for hydrogen mobility, growing use of fuel-cell technology in public transport, and decarbonisation commitments are driving demand.
Japan’s public-transport authorities and local governments are backing deployment of hydrogen fuel-cell buses as part of broader efforts to reduce greenhouse-gas emissions and support next-generation mobility. Commercial vehicle manufacturers in Japan are actively developing fuel-cell buses and the required refuelling infrastructure. Subsidies and policy targets for zero-emission buses motivate municipal fleets to adopt hydrogen buses for routes and services.
High upfront vehicle cost, limited hydrogen-refuelling infrastructure, and competition from battery-electric buses are restraining growth.
Hydrogen buses require significant investment compared with conventional diesel or battery-electric alternatives. Many regions still lack sufficient hydrogen-refuelling stations, which limits operational flexibility and route planning for hydrogen bus fleets. Battery-electric buses are increasingly adopted and present a strong alternative in urban transit settings, which can slow uptake of hydrogen-powered models.
Deployment of large-scale hydrogen bus fleets in priority regions, increasing integration of fuel-cell buses with renewable hydrogen supply and transition from demonstration to commercial operations define industry trends.
Japanese manufacturers and transit agencies are moving from pilot or demonstration hydrogen buses toward full fleet integration in major cities and regional transport networks. Specific prefectures have been designated for priority hydrogen-infrastructure deployment, which supports fleet expansion. Hydrogen supply chains are being linked with renewable-energy generation to ensure cleaner hydrogen for transit use, which strengthens the long-term value proposition for hydrogen buses. The demand outlook for hydrogen buses in Japan remains positive, particularly in public-transport applications aligned with national decarbonisation goals.
Demand for hydrogen buses in Japan is rising through 2035 as national decarbonization goals, clean-transport mandates, and public-sector fleet transitions expand adoption across metropolitan and regional networks. Hydrogen buses support low-emission mobility, long route endurance, and fast refueling compared with battery-electric alternatives. Public transport authorities, airport operators, industrial parks, and municipal agencies are integrating hydrogen mobility into long-distance and high-frequency routes. Growth is reinforced by hydrogen-production investments, refueling-station development, and joint initiatives between vehicle manufacturers and regional governments. Kyushu & Okinawa lead with 27.9%, followed by Kanto (25.7%), Kinki (22.6%), Chubu (19.9%), Tohoku (17.4%), and the Rest of Japan (16.5%).
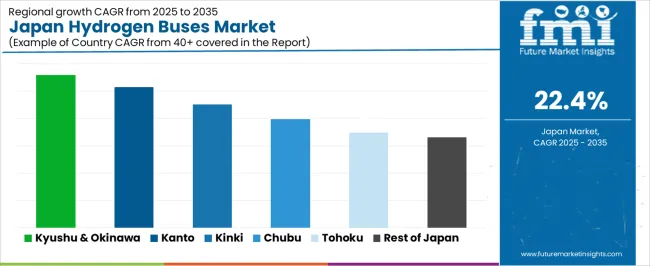
| Region | CAGR (2025-2035) |
|---|---|
| Kyushu & Okinawa | 27.9% |
| Kanto | 25.7% |
| Kinki | 22.6% |
| Chubu | 19.9% |
| Tohoku | 17.4% |
| Rest of Japan | 16.5% |
Kyushu & Okinawa grow at 27.9% CAGR, supported by regional hydrogen-production clusters, renewable-energy integration, and active municipal transit modernization. Cities such as Fukuoka and Kumamoto pilot hydrogen bus routes connected to expanding refueling infrastructure. Industrial zones use hydrogen buses for internal mobility to demonstrate clean-transport adoption. Airport authorities in Kyushu evaluate hydrogen fleets for airside movement under strict emissions guidelines. Tourism-oriented regions adopt hydrogen buses for high-frequency sightseeing routes requiring quiet operation and rapid refueling. Regional governments promote hydrogen-powered fleet transitions through incentives and collaborative demonstrations with manufacturers.
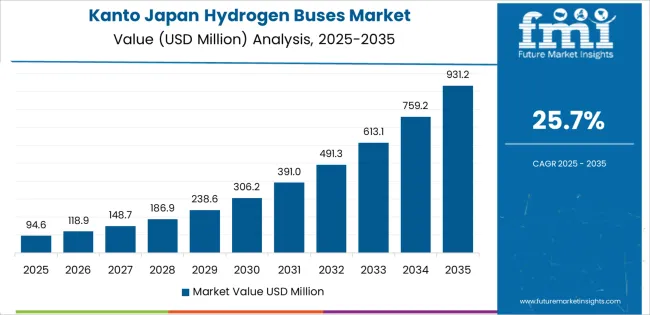
Kanto grows at 25.7% CAGR, driven by dense transit networks, large public-fleet requirements, and ongoing deployment of hydrogen infrastructure across Tokyo, Kanagawa, and Saitama. Metropolitan transit agencies use hydrogen buses for long-distance and high-frequency routes not easily served by battery-electric models. Municipalities incorporate hydrogen fleets into clean-transportation strategies tied to emissions-reduction programs. Airports such as Haneda evaluate hydrogen shuttles for passenger and staff mobility. Corporate campuses and research parks adopt hydrogen bus fleets for internal circulation under low-emission mandates. Manufacturers and technology firms in the region participate in hydrogen fuel-cell testing and operational pilot projects.
Kinki grows at 22.6% CAGR, supported by strong municipal ecofriendly programs, industrial-area mobility needs, and public-transport upgrades across Osaka, Kyoto, and Hyogo. Transit operators introduce hydrogen buses for congested corridors requiring quieter and cleaner vehicle operations. Industrial clusters adopt hydrogen mobility to support regional hydrogen-energy initiatives. Universities and technology institutes in the region conduct hydrogen-bus performance trials to enhance operational modeling. Tourism sectors in Kyoto and Nara evaluate hydrogen buses for low-emission visitor transport routes. Although infrastructure expansion is incremental, strong environmental and operational priorities maintain adoption.
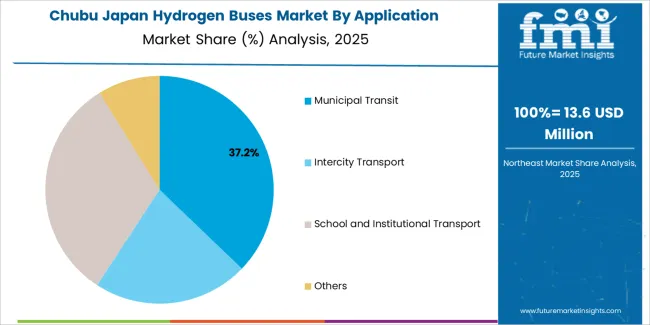
Chubu grows at 19.9% CAGR, shaped by major automotive ecosystems, industrial hydrogen usage, and coordinated mobility programs across Aichi, Shizuoka, and Gifu. Automotive OEMs and suppliers collaborate with local governments to test next-generation hydrogen buses. Manufacturing parks adopt hydrogen fleets for internal transport under clean-energy commitments. Public transport operators evaluate hydrogen buses for intercity and suburban routes. Airport operators in the region test hydrogen shuttles for operational efficiency during peak movement intervals. Strong automotive-industry involvement supports technology validation and drives broader adoption across public fleets.
Tohoku grows at 17.4% CAGR, supported by regional clean-energy programs, municipal fleet upgrades, and increasing integration of hydrogen in reconstruction and development initiatives across Miyagi, Fukushima, and Akita. Public transport agencies deploy hydrogen buses to strengthen low-emission mobility across long rural routes. Prefectures involved in hydrogen-energy demonstration projects adopt fuel-cell buses for municipal services. Industrial facilities and logistics clusters evaluate hydrogen mobility for internal transit. Despite smaller urban centers, stable infrastructure development and local ecofriendly strategies support adoption.
The Rest of Japan grows at 16.5% CAGR, supported by gradual hydrogen-infrastructure expansion, municipal fleet modernization, and regional ecofriendly targets. Smaller cities adopt hydrogen buses for core transit routes where long-distance operation benefits from faster refueling. Public agencies incorporate hydrogen mobility into environmental plans tied to emissions-reduction goals. Local industrial parks and port areas adopt hydrogen shuttles for workforce movement. Although infrastructure scaling is gradual, consistent municipal interest and national hydrogen-policy support maintain long-term adoption.
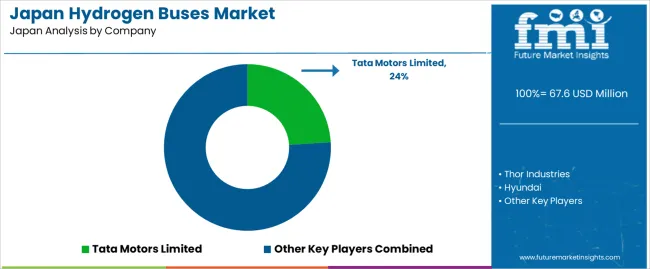
Demand for hydrogen buses in Japan is shaped by a group of international vehicle and fuel-cell system developers supporting municipal fleets, regional transit authorities, and pilot deployments linked to national decarbonisation initiatives. Tata Motors Limited holds the leading position with an estimated 24.0% share, supported by controlled fuel-cell integration, stable drivetrain performance, and reliable supply for early-stage hydrogen-mobility programmes. Its position is reinforced by consistent range capability and predictable operation under urban-transport duty cycles.
Thor Industries and Hyundai follow as notable participants. Thor supports hydrogen-powered platforms adapted from commercial chassis with dependable energy-management systems and steady fuel-cell behaviour in repeated stop–start conditions. Hyundai maintains a strong presence through its fuel-cell electric bus technology, characterised by proven stack durability and stable thermal-management performance under Japan’s mixed-climate conditions.
Ballard Power Systems contributes core fuel-cell modules used across multiple bus platforms, providing consistent stack efficiency, verified durability, and controlled response behaviour suitable for Japanese transit routes. NovaBus Corporation and New Flyer Industries Ltd add capability through heavy-duty bus designs compatible with high-capacity hydrogen storage and established fleet-management frameworks.
Competition across this segment centres on stack durability, fuel-cell efficiency, refuelling reliability, range consistency, thermal stability, and integration with Japanese fleet-operation requirements. Demand continues to grow as national and municipal transport programmes expand deployments of zero-emission hydrogen buses, prioritising dependable fuel-cell performance and consistent operational uptime across urban and intercity routes.
| Items | Values |
|---|---|
| Quantitative Units | USD million |
| Technology | Proton Exchange Membrane Fuel Cells, Direct Methanol Fuel Cells, Phosphoric Acid Fuel Cells, Zinc-Air Fuel Cells, Solid Oxide Fuel Cells |
| Application | Municipal Transit, Intercity Transport, School and Institutional Transport, Others |
| Power Output | <150 kW, 150–250 kW, >250 kW |
| Transit Bus Models | 30-Foot Transit Buses, 40-Foot Transit Buses, 60-Foot Transit Buses |
| Regions Covered | Kyushu & Okinawa, Kanto, Kinki, Chubu, Tohoku, Rest of Japan |
| Key Companies Profiled | Tata Motors Limited, Thor Industries, Hyundai, Ballard Power Systems, NovaBus Corporation, New Flyer Industries Ltd |
| Additional Attributes | Dollar sales by technology type, application, power output, and bus model categories; regional adoption trends across Kyushu & Okinawa, Kanto, Kinki, Chubu, Tohoku, and Rest of Japan; competitive landscape of hydrogen bus manufacturers and fuel cell system providers; developments in PEMFC efficiency, SOFC durability, and lightweight bus platforms; integration with municipal transit decarbonization programs, intercity fleet upgrades, institutional transport, and hydrogen refueling infrastructure expansion in Japan. |
The demand for hydrogen buses in Japan is estimated to be valued at USD 67.6 million in 2025.
The market size for the hydrogen buses in Japan is projected to reach USD 508.4 million by 2035.
The demand for hydrogen buses in Japan is expected to grow at a 22.4% CAGR between 2025 and 2035.
The key product types in hydrogen buses in Japan are proton exchange membrane fuel cells , direct methanol fuel cells, phosphoric acid fuel cells, zinc-air fuel cells and solid oxide fuel cells.
In terms of application, municipal transit segment is expected to command 37.2% share in the hydrogen buses in Japan in 2025.


Our Research Products

The "Full Research Suite" delivers actionable market intel, deep dives on markets or technologies, so clients act faster, cut risk, and unlock growth.

The Leaderboard benchmarks and ranks top vendors, classifying them as Established Leaders, Leading Challengers, or Disruptors & Challengers.

Locates where complements amplify value and substitutes erode it, forecasting net impact by horizon

We deliver granular, decision-grade intel: market sizing, 5-year forecasts, pricing, adoption, usage, revenue, and operational KPIs—plus competitor tracking, regulation, and value chains—across 60 countries broadly.

Spot the shifts before they hit your P&L. We track inflection points, adoption curves, pricing moves, and ecosystem plays to show where demand is heading, why it is changing, and what to do next across high-growth markets and disruptive tech

Real-time reads of user behavior. We track shifting priorities, perceptions of today’s and next-gen services, and provider experience, then pace how fast tech moves from trial to adoption, blending buyer, consumer, and channel inputs with social signals (#WhySwitch, #UX).

Partner with our analyst team to build a custom report designed around your business priorities. From analysing market trends to assessing competitors or crafting bespoke datasets, we tailor insights to your needs.
Supplier Intelligence
Discovery & Profiling
Capacity & Footprint
Performance & Risk
Compliance & Governance
Commercial Readiness
Who Supplies Whom
Scorecards & Shortlists
Playbooks & Docs
Category Intelligence
Definition & Scope
Demand & Use Cases
Cost Drivers
Market Structure
Supply Chain Map
Trade & Policy
Operating Norms
Deliverables
Buyer Intelligence
Account Basics
Spend & Scope
Procurement Model
Vendor Requirements
Terms & Policies
Entry Strategy
Pain Points & Triggers
Outputs
Pricing Analysis
Benchmarks
Trends
Should-Cost
Indexation
Landed Cost
Commercial Terms
Deliverables
Brand Analysis
Positioning & Value Prop
Share & Presence
Customer Evidence
Go-to-Market
Digital & Reputation
Compliance & Trust
KPIs & Gaps
Outputs
Full Research Suite comprises of:
Market outlook & trends analysis
Interviews & case studies
Strategic recommendations
Vendor profiles & capabilities analysis
5-year forecasts
8 regions and 60+ country-level data splits
Market segment data splits
12 months of continuous data updates
DELIVERED AS:
PDF EXCEL ONLINE
Demand Signal Repository Solutions Market Size and Share Forecast Outlook 2025 to 2035
Demand Side Management Market Size and Share Forecast Outlook 2025 to 2035
Demand Response Market Analysis - Size, Share, and Forecast Outlook 2025 to 2035
North America Shipping Supplies Market Trends – Innovations & Growth 2024-2034
Demand of Kozani Saffron in Greece Analysis - Size, Share & Forecast 2025 to 2035
Demand of No-acid Whey Strained Dairy Processing Concepts in European Union Size and Share Forecast Outlook 2025 to 2035
Demand for Bronte Pistachio in Italy Analysis - Size, Share & Forecast 2025 to 2035
Demand and Trend Analysis of Gaming Monitor in Western Europe Size and Share Forecast Outlook 2025 to 2035
Demand and Trend Analysis of Gaming Monitor in Korea Size and Share Forecast Outlook 2025 to 2035
Demand and Trend Analysis of Gaming Monitor in Japan Size and Share Forecast Outlook 2025 to 2035
Glycine Soja (Soybean) Seed Extract Market Size and Share Forecast Outlook 2025 to 2035
Demand and Trend Analysis of Yeast in Japan - Size, Share, and Forecast Outlook 2025 to 2035
Demand of Pistachio-based desserts & ingredients in France Analysis - Size, Share & Forecast 2025 to 2035
Western Europe Men’s Skincare Market Analysis – Forecast 2023-2033
Demand and Trends Analysis of Stevia in Japan Size and Share Forecast Outlook 2025 to 2035
Japan Women’s Intimate Care Market Trends – Growth & Forecast 2024-2034
Demand and Trend Analysis of Fabric Stain Remover in Korea Size and Share Forecast Outlook 2025 to 2035
Demand and Sales Analysis of Paper Cup in Korea Size and Share Forecast Outlook 2025 to 2035
Demand and Sales Analysis of Paper Cup in Western Europe Size and Share Forecast Outlook 2025 to 2035
Demand of MFGM-enriched Powders & RTDs in European Union Size and Share Forecast Outlook 2025 to 2035

Thank you!
You will receive an email from our Business Development Manager. Please be sure to check your SPAM/JUNK folder too.
Chat With
MaRIA