The Japan virtual event platforms demand is valued at USD 0.6 billion in 2025 and is estimated to reach USD 1.9 billion by 2035, recording a CAGR of 12.3%. Demand is influenced by expanded use of online conferencing environments, hybrid corporate events, and remote training formats across education, enterprise operations, and public institutions. Virtual platforms support large-scale interaction, structured session management, exhibitor engagement, and analytics-based attendance tracking. Growth is reinforced by wider adoption of cloud infrastructure and continued interest in formats that reduce travel and venue-related costs.
Virtual event platform software represents the leading solution, supported by its ability to deliver integrated registration tools, streaming functions, breakout sessions, and digital exhibitor spaces. These platforms provide stable performance for high-attendance events, incorporate content-management features, and enable secure participation through authentication controls. Advancements in real-time translation, audience polling, and multi-device access are improving user experience and supporting broader institutional adoption.
Demand is concentrated in Kyushu & Okinawa, Kanto, and Kinki, where corporate headquarters, technology firms, and academic institutions generate consistent usage. Key suppliers include Cisco Systems, Zoom Video Communications Inc., Microsoft Corporation, vFairs, and Cvent Inc., offering software environments designed for structured event hosting and scalable digital participation.
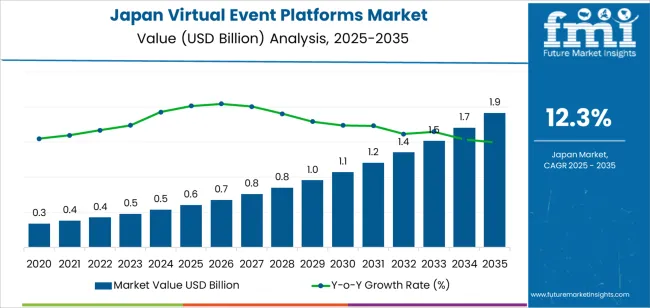
The acceleration and deceleration pattern shows a strong early-period rise driven by digital-engagement needs and hybrid-event adoption. Between 2025 and 2029, the segment will move through a clear acceleration phase as corporations, universities, and trade-event organisers expand virtual formats to manage cost efficiency, geographic reach, and scheduling flexibility. Growth during this period is supported by improvements in streaming stability, multilingual interfaces, and integrated audience-interaction tools.
From 2030 to 2035, the segment will enter a controlled deceleration phase as usage patterns stabilise and virtual platforms become embedded components of long-term communication strategies. Procurement will increasingly align with subscription models, routine platform upgrades, and integration with CRM, learning-management, and collaboration systems. While hybrid formats will continue to evolve, the pace of new-adoption cycles will moderate as organisations focus on optimisation rather than rapid expansion. Overall, the acceleration–deceleration pattern reflects a transition from early demand driven by digital-service scaling to a mature period shaped by platform standardisation, workflow stability, and predictable utilisation across Japan’s corporate, academic, and institutional environments.
| Metric | Value |
|---|---|
| Japan Virtual Event Platforms Sales Value (2025) | USD 0.6 billion |
| Japan Virtual Event Platforms Forecast Value (2035) | USD 1.9 billion |
| Japan Virtual Event Platforms Forecast CAGR (2025-2035) | 12.3% |
Demand for virtual event platforms in Japan is increasing as organisations adopt hybrid and fully digital formats to host conferences, training programmes, trade shows and marketing events. Japanese companies seek platforms that offer multilingual capabilities, reliable streaming, interactive features and strong integration with regional business ecosystems. Advances in cloud computing, virtual collaboration tools and omnichannel engagement support expanded usage across corporate, academic and government sectors.
Rising travel costs and environmental concerns encourage adoption of virtual models that reduce physical venue reliance. Constraints include language and cultural preferences favouring in-person networking, technical limitations in some participant environments and hesitation among traditional event organisers to transition completely to digital formats. Some smaller firms may lack internal expertise to deploy advanced platforms effectively.
Demand for virtual event platforms in Japan reflects continued adoption of remote communication tools across corporate, academic, and professional environments. Distribution across solution type, enterprise-size groups, and end-user categories aligns with Japan’s emphasis on structured digital communication, internal collaboration, and hybrid or fully online event formats.
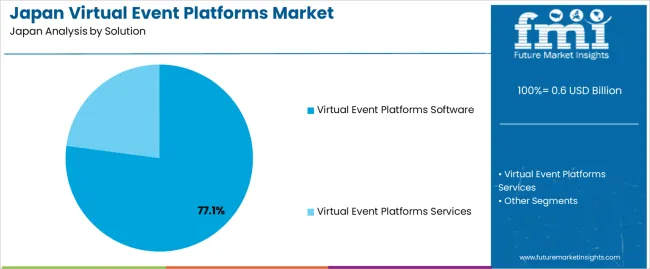
Virtual event platform software holds 77.1% of demand in Japan, making it the leading solution category. Software systems support live streaming, session management, interactive tools, analytics dashboards, and multi-track programme coordination. Organisations prioritise software for its scalability, integration capability, and suitability for hybrid or fully virtual formats. Services account for 22.9%, covering technical support, event coordination, platform configuration, and moderation tasks. Service usage remains relevant for large virtual conferences and customised event workflows requiring specialised execution.
Key drivers and attributes:
Large enterprises (500–999 employees) hold 22.5%, using virtual tools for structured communication and internal training. Medium-sized enterprises represent 19.3%, reflecting adoption for product demonstrations, client communication, and internal collaboration. Small enterprises (10–99 employees) hold 17.8%, while small offices (1–9 employees) account for 12.7%, using cost-efficient tools for meetings and small-format events.
Key drivers and attributes:
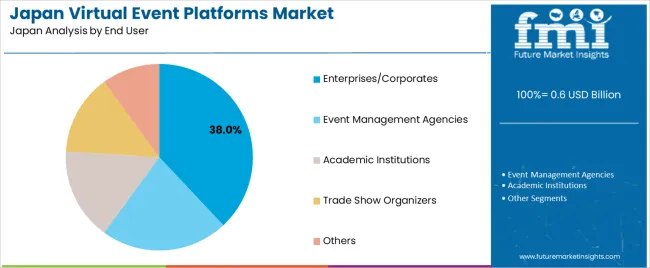
Enterprises and corporates account for 38.0% of demand in Japan, making them the dominant end-user group. They use virtual platforms for internal meetings, client briefings, training programmes, and organisational communication. Event-management agencies hold 22.0%, coordinating virtual conferences, exhibitions, and multi-client events. Academic institutions represent 16.0%, using platforms for lectures, seminars, and academic fairs. Trade-show organisers hold 14.0%, relying on virtual extensions to support exhibitor sessions and remote attendance. The remaining 10.0% includes non-profits, community organisations, and professional groups conducting digital outreach.
Key drivers and attributes:
Growing digital engagement, hybrid event adoption, and the need for remote collaboration are driving demand.
In Japan, demand for virtual event platforms is increasing as companies and organisations seek to extend reach beyond physical venues and engage remote participants efficiently. The growth of high-speed internet, widespread use of mobile devices, and increased comfort with online meeting environments support platform adoption. Hybrid events that combine in-person and digital attendance are becoming more common, particularly for conferences, trade shows, and corporate training. More event planners and marketers are choosing virtual platforms to reduce travel cost, improve accessibility for regional and international participants, and leverage data analytics on attendee behaviour.
Cultural preference for in-person interaction, technical adaptation costs, and competition from traditional event formats restrain growth.
In Japan, many organisations value face-to-face interaction, relationship building and in-person networking, which means some event formats continue favouring physical venues over digital alternatives. Deploying advanced virtual event platforms can involve significant set-up cost, training for staff, and integration with Japanese-language content or localised user interfaces. Some event planners may prefer established conference formats and venues, which slows full transition to virtual-only formats. These factors moderate the pace of adoption despite growing interest.
Shift toward customised virtual-platform features, expanding sector use beyond corporate to education and government, and increasing demand for analytics-rich event insights define key trends.
Platform providers are developing Japanese-language interfaces, enhanced networking modules, virtual exhibition halls, and gamified attendee experiences to meet local preferences and increase engagement. Use of virtual event platforms is expanding in education, government outreach, and professional associations, not just in corporate marketing. Organisers are increasingly leveraging analytics, attendee behaviour tracking, and real-time feedback to optimise sessions, sponsors and content. These trends support continuous growth of virtual event-platform demand in Japan as event models evolve.
Demand for virtual event platforms in Japan is rising through 2035 as corporations, universities, healthcare systems, and public institutions expand digital communication, hybrid events, and remote collaboration programs. Platforms support conferences, training, seminars, product demonstrations, hiring events, and internal communication across distributed teams. Growth across regions aligns with digital-infrastructure maturity, enterprise concentration, and adoption of cloud-hosted meeting and event systems. Organizations rely on virtual platforms for scalable content delivery, attendee management, and integrated interactive tools. Kyushu & Okinawa leads with a 15.4% CAGR, followed by Kanto (14.1%), Kinki (12.4%), Chubu (10.9%), Tohoku (9.6%), and the Rest of Japan (9.1%).
| Region | CAGR (2025-2035) |
|---|---|
| Kyushu & Okinawa | 15.4% |
| Kanto | 14.1% |
| Kinki | 12.4% |
| Chubu | 10.9% |
| Tohoku | 9.6% |
| Rest of Japan | 9.1% |
Kyushu & Okinawa grows at 15.4% CAGR, supported by active enterprise adoption, expanding public-sector communication needs, and strong uptake of remote-participation systems across corporate, educational, and tourism-linked organizations. Companies in Fukuoka and Kumamoto use virtual platforms for internal training, product briefings, and distributed team coordination. Universities deploy systems for academic lectures, multi-campus seminars, and continuing-education programs. Tourism and hospitality operators in Okinawa use virtual platforms for client interaction, travel briefings, and partner communication. Local government offices adopt digital-event systems for public information sessions and community programs. Reliable broadband expansion across regional urban centers reinforces recurring platform utilization.
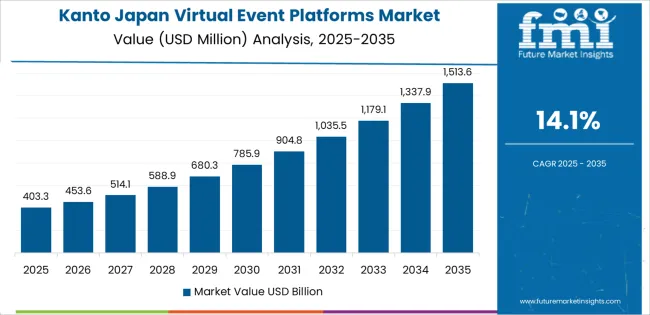
Kanto grows at 14.1% CAGR, supported by Japan’s largest corporate cluster, extensive service industries, and high adoption of digital collaboration tools across Tokyo, Kanagawa, and Chiba. Enterprises use virtual platforms for client meetings, product launches, and internal communication with multi-location teams. Universities host major academic events, symposiums, and hybrid conferences through integrated content-delivery systems. Financial, technology, and consulting firms rely on virtual platforms for briefings, training sessions, and partner coordination. Government agencies use digital-event solutions for policy communication and administrative briefings. Consistent investment in cloud infrastructure and high organizational demand sustain strong platform adoption.
Kinki grows at 12.4% CAGR, supported by diversified corporate activity and broad use of digital-event systems across Osaka, Kyoto, and Hyogo. Manufacturing and service organizations rely on virtual platforms for supplier communication, product-training sessions, and internal coordination. Academic institutions use virtual tools for seminars, extension programs, and collaborative research sessions. Healthcare networks adopt virtual platforms for medical-education programs and administrative coordination. Tourism-related entities in Kyoto maintain steady demand for virtual briefings and partner communication. While adoption is moderate compared with Kanto, recurring enterprise usage supports stable growth.
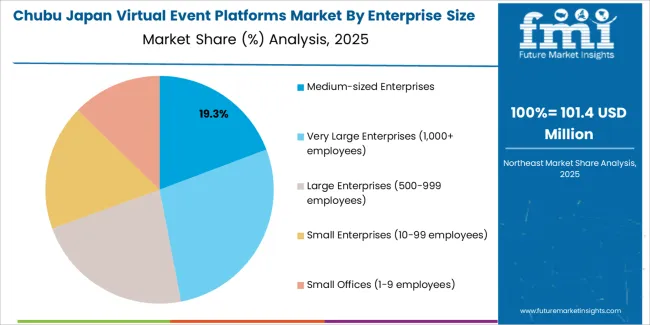
Chubu grows at 10.9% CAGR, supported by industrial, automotive, and technology-oriented companies requiring structured digital communication across supplier and production networks. Firms in Aichi, Shizuoka, and Mie use virtual platforms for training, technical workshops, and coordination across distributed manufacturing sites. Universities deploy hybrid-event systems for academic programs and outreach. Regional government offices rely on virtual tools for public information sessions and administrative communication. While industrial processes remain onsite, supporting teams require reliable digital-event platforms for project alignment, compliance training, and technical instruction.
Tohoku grows at 9.6% CAGR, supported by expanding digital services across universities, public institutions, and regional corporations. Educational institutions use virtual platforms for lectures, distance-learning programs, and collaborative research. Local government offices rely on digital-event systems for community communication, administrative outreach, and disaster-preparedness briefings. Corporations adopt virtual platforms for training, internal coordination, and customer communication. While the region has fewer large enterprises than southern and eastern regions, reliable digital adoption across essential services maintains demand.
The Rest of Japan grows at 9.1% CAGR, supported by decentralized enterprise activity, smaller education institutions, and public-sector communication needs across rural prefectures. Organizations adopt virtual platforms for internal meetings, community outreach, and customer-service events. Schools and training centers use virtual systems for blended learning and remote instruction. Local governments rely on digital-event tools to manage public-information sessions and administrative coordination. Although regional industrial clusters are limited, consistent communication requirements generate stable platform usage.
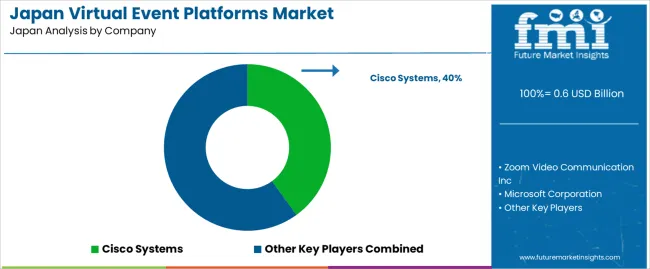
Demand for virtual-event platforms in Japan is shaped by a concentrated group of technology providers supporting conferences, webinars, hybrid corporate events, and academic gatherings. Cisco Systems holds the leading position with an estimated 40.0% share, supported by the long-established Webex platform, strong security controls, and dependable video performance across enterprise and public-sector users. Its position is reinforced by stable integration with corporate collaboration systems and consistent reliability for high-capacity events.
Zoom Video Communications Inc. and Microsoft Corporation follow as major participants, supplying scalable webinar and live-event tools used by commercial organizations, universities, and training institutions. Their strengths include intuitive interfaces, predictable streaming quality, and alignment with broader productivity ecosystems. Microsoft benefits from seamless integration with Teams, while Zoom remains a widely adopted option among SMEs and education providers requiring flexible, multi-session event structures.
Specialist firms such as vFairs and Cvent Inc. maintain notable roles through platforms designed for structured conferences, exhibitions, recruitment events, and multi-track programmes. Their competitiveness rests on attendee-engagement tools, registration management, and analytics that support organizers handling large or complex event formats.
Competition across this segment centers on platform stability, security compliance, attendee-interaction features, scalability, and integration with registration, CRM, and content-delivery systems. Demand remains steady as organizations continue to rely on virtual and hybrid event formats for training, corporate communication, and academic outreach, supported by consistent interest in flexible, analytics-enabled digital event solutions across Japan.
| Items | Values |
|---|---|
| Quantitative Units | USD billion |
| Solution | Virtual Event Platforms Software, Virtual Event Platforms Services |
| Enterprise Size | Medium-sized Enterprises, Very Large Enterprises (1,000+ employees), Large Enterprises (500–999 employees), Small Enterprises (10–99 employees), Small Offices (1–9 employees) |
| End User | Enterprises/Corporates, Event Management Agencies, Academic Institutions, Trade Show Organizers, Others |
| Regions Covered | Kyushu & Okinawa, Kanto, Kinki, Chubu, Tohoku, Rest of Japan |
| Key Companies Profiled | Cisco Systems, Zoom Video Communication Inc., Microsoft Corporation, vFairs, Cvent Inc. |
| Additional Attributes | Dollar sales by solution type, enterprise size, and end-user categories; regional adoption trends across Kyushu & Okinawa, Kanto, Kinki, Chubu, Tohoku, and Rest of Japan; competitive landscape of virtual event software and service providers; advancements in hybrid event integration, AI-driven audience engagement, and virtual conferencing tools; integration with corporate communication strategies, academic institutions, trade exhibitions, and digital event experiences across Japan. |
The global demand for virtual event platforms in japan is estimated to be valued at USD 0.6 billion in 2025.
The market size for the demand for virtual event platforms in japan is projected to reach USD 1.9 billion by 2035.
The demand for virtual event platforms in japan is expected to grow at a 12.3% CAGR between 2025 and 2035.
The key product types in demand for virtual event platforms in japan are virtual event platforms software and virtual event platforms services.
In terms of enterprise size, medium-sized enterprises segment to command 19.3% share in the demand for virtual event platforms in japan in 2025.


Our Research Products

The "Full Research Suite" delivers actionable market intel, deep dives on markets or technologies, so clients act faster, cut risk, and unlock growth.

The Leaderboard benchmarks and ranks top vendors, classifying them as Established Leaders, Leading Challengers, or Disruptors & Challengers.

Locates where complements amplify value and substitutes erode it, forecasting net impact by horizon

We deliver granular, decision-grade intel: market sizing, 5-year forecasts, pricing, adoption, usage, revenue, and operational KPIs—plus competitor tracking, regulation, and value chains—across 60 countries broadly.

Spot the shifts before they hit your P&L. We track inflection points, adoption curves, pricing moves, and ecosystem plays to show where demand is heading, why it is changing, and what to do next across high-growth markets and disruptive tech

Real-time reads of user behavior. We track shifting priorities, perceptions of today’s and next-gen services, and provider experience, then pace how fast tech moves from trial to adoption, blending buyer, consumer, and channel inputs with social signals (#WhySwitch, #UX).

Partner with our analyst team to build a custom report designed around your business priorities. From analysing market trends to assessing competitors or crafting bespoke datasets, we tailor insights to your needs.
Supplier Intelligence
Discovery & Profiling
Capacity & Footprint
Performance & Risk
Compliance & Governance
Commercial Readiness
Who Supplies Whom
Scorecards & Shortlists
Playbooks & Docs
Category Intelligence
Definition & Scope
Demand & Use Cases
Cost Drivers
Market Structure
Supply Chain Map
Trade & Policy
Operating Norms
Deliverables
Buyer Intelligence
Account Basics
Spend & Scope
Procurement Model
Vendor Requirements
Terms & Policies
Entry Strategy
Pain Points & Triggers
Outputs
Pricing Analysis
Benchmarks
Trends
Should-Cost
Indexation
Landed Cost
Commercial Terms
Deliverables
Brand Analysis
Positioning & Value Prop
Share & Presence
Customer Evidence
Go-to-Market
Digital & Reputation
Compliance & Trust
KPIs & Gaps
Outputs
Full Research Suite comprises of:
Market outlook & trends analysis
Interviews & case studies
Strategic recommendations
Vendor profiles & capabilities analysis
5-year forecasts
8 regions and 60+ country-level data splits
Market segment data splits
12 months of continuous data updates
DELIVERED AS:
PDF EXCEL ONLINE
Demand Signal Repository Solutions Market Size and Share Forecast Outlook 2025 to 2035
Demand Side Management Market Size and Share Forecast Outlook 2025 to 2035
Demand Response Market Analysis - Size, Share, and Forecast Outlook 2025 to 2035
North America Shipping Supplies Market Trends – Innovations & Growth 2024-2034
Demand of Kozani Saffron in Greece Analysis - Size, Share & Forecast 2025 to 2035
Demand of No-acid Whey Strained Dairy Processing Concepts in European Union Size and Share Forecast Outlook 2025 to 2035
Demand for Bronte Pistachio in Italy Analysis - Size, Share & Forecast 2025 to 2035
Demand and Trend Analysis of Gaming Monitor in Western Europe Size and Share Forecast Outlook 2025 to 2035
Demand and Trend Analysis of Gaming Monitor in Korea Size and Share Forecast Outlook 2025 to 2035
Demand and Trend Analysis of Gaming Monitor in Japan Size and Share Forecast Outlook 2025 to 2035
Glycine Soja (Soybean) Seed Extract Market Size and Share Forecast Outlook 2025 to 2035
Demand and Trend Analysis of Yeast in Japan - Size, Share, and Forecast Outlook 2025 to 2035
Demand of Pistachio-based desserts & ingredients in France Analysis - Size, Share & Forecast 2025 to 2035
Western Europe Men’s Skincare Market Analysis – Forecast 2023-2033
Demand and Trends Analysis of Stevia in Japan Size and Share Forecast Outlook 2025 to 2035
Japan Women’s Intimate Care Market Trends – Growth & Forecast 2024-2034
Demand and Trend Analysis of Fabric Stain Remover in Korea Size and Share Forecast Outlook 2025 to 2035
Demand and Sales Analysis of Paper Cup in Korea Size and Share Forecast Outlook 2025 to 2035
Demand and Sales Analysis of Paper Cup in Western Europe Size and Share Forecast Outlook 2025 to 2035
Demand of MFGM-enriched Powders & RTDs in European Union Size and Share Forecast Outlook 2025 to 2035

Thank you!
You will receive an email from our Business Development Manager. Please be sure to check your SPAM/JUNK folder too.
Chat With
MaRIA