Magnesium Threonate Supplement Market Size and Share Forecast Outlook 2025 to 2035

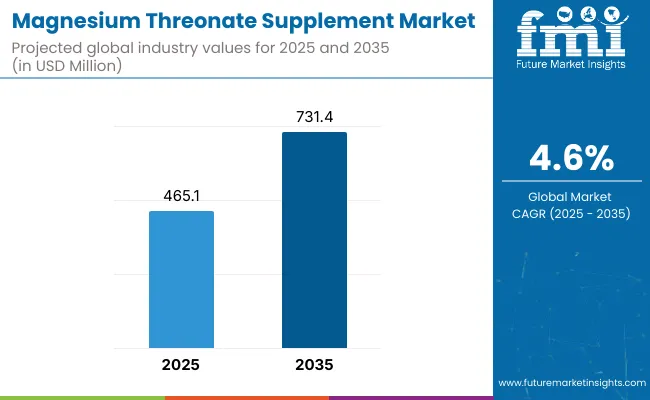
The Magnesium Threonate Supplement Market has been forecasted to attain a valuation of USD 465.1 million in 2025, rising to USD 731.4 million by 2035, resulting in an incremental gain of USD 266.3 million, which reflects a 57.2% increase over the forecast decade. A compound annual growth rate (CAGR) of 4.6% is expected to be recorded, indicating a steady yet resilient expansion trajectory for magnesium-based cognitive support supplements.
Quick Stats for Magnesium Threonate Supplement Market

  • Magnesium Threonate Supplement Market Value (2025): USD 465.1 million
  • Magnesium Threonate Supplement Market Forecast Value (2035): USD 731.4 million
  • Magnesium Threonate Supplement Market Forecast CAGR (2025 to 2035): 4.6%
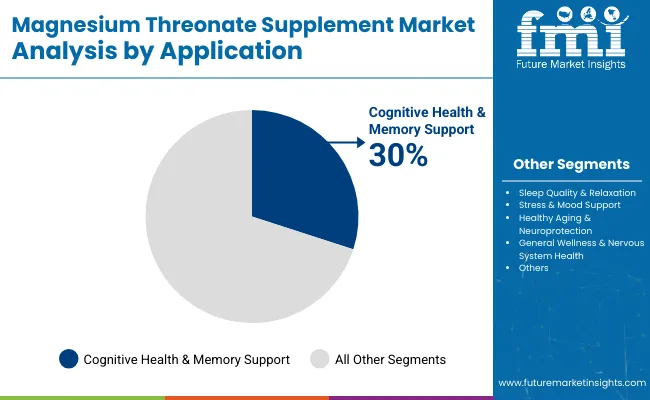
  • Leading Segment in 2025 (Application): Cognitive Health & Memory Support (30%)
  • Key Growth Regions: North America, East Asia, and Europe
  • Top Key Players: Life Extension, NOW Foods, Pure Encapsulations, Thorne Research, Doctor’s Best, Source Naturals, Jarrow Formulas, Swanson Health Products, Double Wood Supplements, Nootropics Depot

Magnesium Threonate Supplement Market

Magnesium Threonate Supplement Market Key Takeaways

Metric Value
Market Estimated Value in (2025E) USD 465.1 million
Market Forecast Value in (2035F) USD 731.4 million
Forecast CAGR (2025 to 2035) 4.6%

During the initial five-year phase from 2025 to 2030, a moderate incline is projected from USD 465.1 million to approximately USD 583.3 million adding nearly USD 118.2 million, which would contribute 44.4% of the total decade growth.

This period is expected to be defined by rising mental wellness awareness, growing consumer preference for neuroprotective ingredients, and increasing product availability across e-commerce and practitioner-led channels. Strong uptake is likely to be witnessed across adult populations seeking cognitive optimization, especially in North America and parts of Asia.

Between 2030 and 2035, the market is projected to expand further by USD 148.1 million, contributing the remaining 55.6% of total growth, supported by broader clinical acceptance, deeper penetration in aging demographics, and product innovations featuring synergistic formulations.

Digital therapeutics, personalization technologies, and practitioner-prescribed nutraceutical protocols are expected to serve as growth amplifiers in the latter half. A higher adoption rate across functional beverages and personalized capsule delivery formats is anticipated, shifting volume away from traditional supplements.

From 2020 to 2024, the Magnesium Threonate Supplement Market expanded from USD ~360 million to USD 465.1 million, fueled by mounting interest in nootropics and age-related cognitive health. During this period, growth was led by capsule-based formulations, with Magtein® (magnesium L-threonate) dominating premium product portfolios. Global leaders such as Life Extension and Pure Encapsulations secured early market leadership by aligning their formulations with clinical studies and exclusive ingredient rights.

Revenue concentration was observed in offline pharmacy and online DTC segments, while subscription-based models were still emerging. By 2025, the market is expected to pivot toward personalized wellness bundles, practitioner-guided protocols, and AI-enhanced product recommendations.

The revenue mix is projected to shift as liquid, gummy, and powder formulations grow faster than traditional capsules, contributing to more dynamic growth across demographic groups. Competitive advantage is transitioning from ingredient sourcing alone to ecosystem integration, encompassing practitioner education, compliance support, and multi-format innovation.

Why the Magnesium Threonate Supplement Market is growing?

Growth in the Magnesium Threonate Supplement Market has been driven by increasing scientific validation of its neuroprotective and cognitive-enhancing properties. The compound’s ability to elevate magnesium levels in the brain considered critical for synaptic plasticity and memory formation has been widely acknowledged through peer-reviewed research.

Rising consumer awareness regarding age-related cognitive decline and stress-related neurological issues has led to heightened demand for preventive solutions. Broader inclusion in clinical wellness protocols has been facilitated through practitioner-led channels and integrative medicine practices.

Adoption has been accelerated by the compound’s differentiation from generic magnesium supplements, as its bioavailability and blood-brain barrier penetration have been recognized as superior. Regulatory shifts toward supporting cognitive health claims have created new pathways for market legitimacy.

Product innovation particularly in functional gummies, powders, and liquid formulations has enabled broader consumer appeal. Continued investments in education by leading nutraceutical brands are expected to expand consumer trust, while premium positioning through practitioner distribution channels is forecast to sustain long-term value creation.

Segmental Analysis

The Magnesium Threonate Supplement Market has been segmented based on Application, Product Format, Sales Channel, and Region, allowing stakeholders to capture nuanced growth patterns and shifting consumer preferences.

Each segment has been shaped by unique adoption drivers, clinical relevance, and evolving distribution strategies. Applications span from cognitive health to general wellness, reflecting the compound’s role in neuroprotection and psychological balance. Product format segmentation includes capsules, powders, liquids, and gummies, each tailored to different demographic and therapeutic needs.

Sales channels encompass traditional pharmacy chains, specialty health stores, and emerging direct-to-consumer brands, each offering distinct consumer engagement models. This granular segmentation is expected to enhance precision in strategic planning and future investment decision-making across the value chain.
Insights into the Application Segment with Cognitive Health Leading the Demand

Magnesium Threonate Supplement Market By Application

Application Market Value Share, 2025
Cognitive Health & Memory Support 30%
Sleep Quality & Relaxation 18%
Stress & Mood Support 20%
Healthy Aging & Neuroprotection 22%
General Wellness & Nervous System Health 10%

The Cognitive Health & Memory Support segment has been projected to lead the market with a 30% share in 2025, supported by an 8.4% CAGR through 2035. This dominance has been attributed to the rising prevalence of cognitive decline in aging populations, heightened interest in brain optimization among younger consumers, and increasing clinical credibility of magnesium threonate as a brain-targeting compound.

The Healthy Aging & Neuroprotection segment, with a CAGR of 8.8%, is expected to emerge as a high-potential growth area, especially as longevity-focused consumers adopt preventive neuro-wellness strategies. Meanwhile, Stress & Mood Support is being positioned as a resilient mid-growth area, driven by urban lifestyle stressors and the shift toward non-pharma mood regulators. Collectively, these segments are expected to anchor long-term adoption across age and demographic groups.

Insights into the Product Format Segment with Capsules Dominating the Market

Product Format Market Value Share, 2025
Capsules 40%
Tablets 20%
Powder 12%
Gummies 15%
Liquid Formulations 13%

Capsules are expected to retain their dominant position with a 40% share in 2025 and a strong CAGR of 8.6%. This performance has been supported by widespread consumer trust, precision dosing capabilities, and clinical preference.

However, the Gummies segment, growing at a robust CAGR of 9.2%, is forecast to attract younger demographics and wellness-focused consumers, particularly in lifestyle-driven markets like North America and Asia. Liquid Formulations, posting an 8.9% CAGR, are gaining traction due to ease of absorption and growing relevance in geriatric and pediatric markets. These format shifts indicate a clear trend toward convenience, compliance, and personalization in supplement consumption.
Insights into the Sales Channel Segment with Pharmacies & Drugstores Leading Distribution

Magnesium Threonate Supplement Market By Sales

Sales Channel 2025 Share (%)
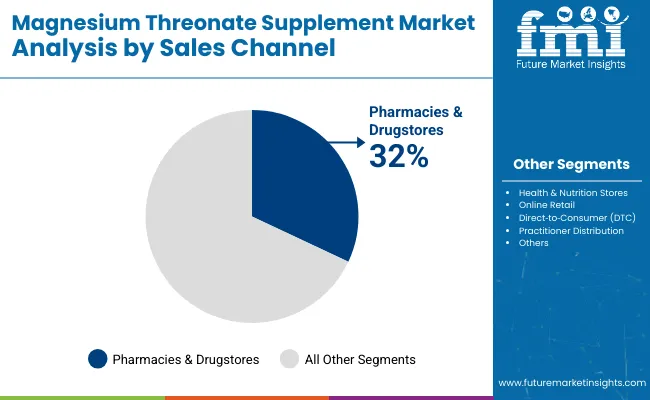
Pharmacies & Drugstores 32%
Health & Nutrition Stores 18%
Online Retail 25%
Direct to Consumer (DTC) 15%
Practitioner Distribution 10%

Pharmacies & Drugstores are forecasted to retain the highest share (32%) in 2025, supported by wide availability and consumer trust in regulated outlets. However, Online Retail and DTC Brands, growing at 9.4% and 9.7% CAGR respectively, are expected to disrupt the landscape.

Their rise has been enabled by digital education, influencer-driven marketing, and personalized subscription models. Meanwhile, Practitioner / Clinic Distribution has been emerging as a niche yet authoritative channel, reinforced by magnesium threonate’s clinical backing. Hybrid models combining online reach with practitioner guidance are anticipated to define the future of channel strategy in this space.

What are the Drivers, Restraints, and Key Trends of the Magnesium Threonate Supplement Market?

The adoption of Magnesium Threonate supplements has been steadily expanding, though certain scientific and commercial barriers remain. Rising consumer demand for cognitive enhancement is counterbalanced by formulation challenges, regulatory ambiguity, and varying awareness across global regions.

Clinically Validated Cognitive Enhancement Claims Have Strengthened Market Confidence

Market demand has been driven by peer-reviewed evidence highlighting magnesium threonate’s role in improving memory function and neuroplasticity. Unlike generic magnesium salts, this compound has been proven to cross the blood-brain barrier effectively, a feature that has reinforced its clinical value.

Neurologists and integrative medicine practitioners have increasingly recommended it for use in mild cognitive impairment, ADHD, and age-related cognitive decline. Consumer trust has also been enhanced through branded clinical formulations and published trial results, further elevating perceived efficacy. As the burden of neurological disorders rises globally, magnesium threonate is expected to be positioned as a cornerstone in preventive brain health protocols.

Practitioner-Led Supplementation Is Emerging as a Distinct Growth Channel

A notable trend has been observed in the practitioner distribution space, where magnesium threonate is being integrated into functional medicine protocols. Healthcare providers are leveraging diagnostic tools to personalize dosing, thereby enhancing compliance and outcomes. This trend has contributed to a shift from self-selected retail purchases to guided, high-credibility therapeutic use. It is expected that this model will support long-term brand loyalty and sustained patient retention.
Analysis of Magnesium Threonate Supplement Market By Key Countries

Magnesium Threonate Supplement Market By Country

Countries CAGR
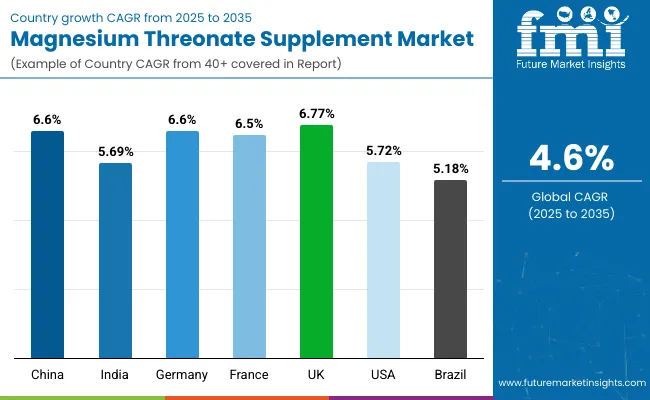
China 6.60%
India 5.69%
Germany 6.60%
France 6.50%
UK 6.77%
USA 5.72%
Brazil 5.18%

Adoption of magnesium threonate supplements has been progressing unevenly across countries, influenced by clinical literacy, nutraceutical regulations, and consumer access to cognitive health interventions. Asia-Pacific has been identified as the fastest-growing regional cluster, with China and India projected to expand at CAGRs of 6.60% and 5.69%, respectively.

Growth in China has been attributed to the rapid emergence of functional supplement channels, aging population dynamics, and increased usage of magnesium-based cognitive support in integrative healthcare settings. In India, urban wellness trends and the expansion of practitioner-guided formulations have supported uptake, particularly among educated urban consumers and geriatric populations.

In Europe, Germany (6.60%), France (6.50%), and the UK (6.77%) are expected to anchor regional growth through strong demand for brain health products and rising interest in nootropics. Regulatory clarity on health claims and premium positioning in pharmacy chains have further reinforced regional performance.

In North America, the USA (5.72%) is anticipated to remain a mature yet steadily advancing market, driven by a mix of direct-to-consumer brands and practitioner-led wellness protocols. Meanwhile, Brazil (5.18%) leads Latin America’s expansion through expanding e-commerce penetration and growing consumer interest in stress and mood support, positioning the country as an emerging hotspot for cognitive supplements.

Sales Outlook for Magnesium Threonate Supplement in the United States

Year USA
2025 111.6
2026 118.8
2027 126.0
2028 133.1
2029 140.4
2030 148.9
2031 157.3
2032 167.7
2033 177.8
2034 187.7
2035 197.7

The Magnesium Threonate Supplement Market in the United States has been forecasted to expand at a CAGR of 5.9% between 2025 and 2035. This growth has been supported by the widespread prioritization of cognitive wellness and age-related neuroprotection among aging and high-performance demographics. The supplement’s clinical differentiation particularly its ability to cross the blood-brain barrier has been increasingly recognized by USA-based healthcare practitioners and integrative nutritionists.

Digital health platforms and functional wellness clinics have been playing a critical role in expanding personalized supplementation protocols, within which magnesium threonate has been prominently featured. Market demand has also been enhanced by a shift toward preventive neurological care, particularly among professionals and older adults seeking cognitive resilience.

  • Practitioner-guided use of magnesium threonate has been expanding in clinical neuro-nutrition protocols.
  • Direct-to-consumer e-commerce platforms are being used to deliver targeted formulations to aging USA populations.
  • Gummy and liquid formats are gaining traction in the USA market due to consumer preferences for ease of consumption and improved compliance.

Growth and Expansion Outlook for Magnesium Threonate Supplement Market in the United Kingdom

The Magnesium Threonate Supplement Market in the UK is projected to grow at a CAGR of 6.77% during 2025 to 2035. This expansion has been supported by increased consumer interest in cognitive performance, age-related memory support, and workplace mental stamina.

Regulatory alignment with EFSA guidance and integration of magnesium threonate into pharmacist-recommended brain health protocols have bolstered credibility. Distribution has been enhanced through omni-channel retail models combining high-street pharmacies and personalized DTC brands. Demand has also been rising for vegan, allergen-free formulations that meet stringent clean-label standards. Mental health awareness campaigns and employer-sponsored wellness initiatives are expected to further elevate market visibility and long-term usage across adult segments.

  • Cognitive stamina and memory retention have been prioritized in UK wellness routines.
  • Clean-label, vegan-certified capsules are being increasingly adopted by ethical consumers.
  • Pharmacy chains and DTC brands are jointly driving access and education.

Growth and Expansion Outlook for Magnesium Threonate Supplement Market in India

India’s Magnesium Threonate Supplement Market is expected to grow at a CAGR of 5.69% between 2025 and 2035. Urban professionals and students have increasingly turned to magnesium threonate for managing stress, concentration, and digital fatigue.

Rising interest in brain-boosting supplements has been observed in the ayurveda-integrated health market, where magnesium threonate is positioned as a modern cognitive enhancer. Adoption has been driven by greater e-commerce penetration, expansion of e-pharmacies, and personalized wellness platforms. However, regional disparities in supplement access and lower awareness in Tier 3 cities have slowed mass uptake. Endorsement by functional medicine practitioners and neurological therapists is expected to amplify awareness and boost sustained market growth.

  • Stress reduction and focus enhancement have driven use among students and professionals.
  • Ayurveda-aligned marketing is helping build cultural relevance for cognitive supplements.
  • E-pharmacies and personalized wellness platforms are catalyzing early adoption.

Sales Outlook for Magnesium Threonate Supplement in China

China’s Magnesium Threonate Supplement Market is projected to expand at a CAGR of 6.60% from 2025 to 2035. Demand has been reinforced by the convergence of aging demographics, educational competitiveness, and strong trust in functional nutraceuticals. Magnesium threonate’s role in neuroprotection and academic performance has been highlighted by health influencers and TCM-informed practitioners.

Growth has been aided by robust cross-border e-commerce channels and domestic brand innovation. Premium formats such as enteric-coated capsules and high-absorption powders are gaining attention among health-conscious consumers. Further support is expected from the integration of magnesium threonate into neuro-wellness bundles within family-focused health packages.

  • Performance anxiety and neurodevelopment needs are driving youth-targeted demand.
  • Domestic supplement houses are introducing clinically positioned premium SKUs.
  • Cross-border platforms are expanding market reach and product diversity.

In-depth Analysis of Magnesium Threonate Supplement in Germany

Countries 2025
UK 18.11%
Germany 20.70%
Italy 9.91%
France 14.52%
Spain 10.87%
BENELUX 6.09%
Nordic 5.79%
Rest of Europe 14%
Countries 2035
UK 19.14%
Germany 21.59%
Italy 10.84%
France 14.67%
Spain 11.48%
BENELUX 5.46%
Nordic 5.27%
Rest of Europe 12%

The Magnesium Threonate Supplement Market in Germany is forecasted to achieve a CAGR of 6.60% between 2025 and 2035. A science-first consumer mindset and high trust in pharmacy-based recommendations have positioned magnesium threonate favorably within the cognitive health segment. Aging demographics and strong demand for mental clarity solutions among working professionals have further supported adoption. EFSA-compliant claims and clean-label regulations have facilitated premium placement in functional health stores.

Demand has been further fueled by neurological rehabilitation centers and wellness clinics integrating magnesium threonate into structured cognitive recovery protocols. The continued expansion of practitioner education and neuro-focused supplement portfolios is expected to shape the future market trajectory.

  • High trust in clinical-grade supplements is reinforcing premium market positioning.
  • Aging populations are driving neuroprotective supplementation in structured wellness.
  • Practitioner education is fostering demand across neuro-rehab and cognitive therapy.

Growth Outlook for Magnesium Threonate Supplement Market in Japan

Application 2025 Share (%)
Cognitive Health & Memory Support 32%
Sleep Quality & Relaxation 18%
Stress & Mood Support 20%
Healthy Aging & Neuroprotection 20%
General Wellness & Nervous System Health 10%

The Magnesium Threonate Supplement Market in Japan has been projected to reach USD 46.5 million by 2025. Cognitive Health & Memory Support leads the application landscape with a 32% share, followed by Healthy Aging & Neuroprotection and Stress & Mood Support at 20% each, reflecting Japan’s dual focus on elderly cognitive care and stress mitigation in high-pressure professional environments. Market adoption has been accelerated by Japan’s demographic aging, where magnesium threonate is being positioned as a proactive tool for memory preservation and neuroplasticity.

Sleep support and emotional balance have also emerged as key health goals, with growing consumer preference for non-pharmaceutical interventions. Practitioners and pharmacies have increasingly recommended magnesium threonate-based formulations, especially those aligned with clinical studies and functional food guidelines. Digital platforms and AI-enabled health trackers are enabling tailored cognitive health supplementation, while regulatory openness to functional labeling is fostering premium product positioning.

  • Japan is expected to hold a 10.5% share of global magnesium threonate demand by 2025.
  • Cognitive Health dominates application use at 32%, reflecting aging-focused priorities.
  • Healthy aging and mood support applications are being boosted by clinician guidance and digital personalization tools.

Opportunity Analysis of South Korea Magnesium Threonate Supplement Market

Sales Channel Market Value Share, 2025
Pharmacies & Drugstores 30%
Health & Nutrition Stores 20%
Online Retail 25%
Direct to Consumer (DTC) Brands 15%
Practitioner / Clinic Distribution 10%

The Magnesium Threonate Supplement Market in South Korea has been projected to reach USD 25.6 million in 2025. Pharmacies & Drugstores are expected to lead distribution with a 30% share, followed closely by Online Retail (25%) and Health & Nutrition Stores (20%). Growth across digital channels is anticipated to be driven by South Korea’s highly connected population, advanced e-commerce infrastructure, and a growing appetite for nootropic and cognitive wellness products among health-literate consumers.

Direct-to-Consumer (DTC) brands have been gaining momentum, particularly among millennials and working professionals seeking personalized, subscription-based cognitive health solutions. Clinic-led distribution remains niche yet influential, as magnesium threonate continues to be incorporated into physician-guided brain health regimens. Clean-label positioning and premium packaging are expected to influence purchasing behaviors, while AI-integrated health platforms may soon facilitate tailored supplement dosing for neuroprotection and focus enhancement.
  • Pharmacies remain dominant but online and DTC channels are rising rapidly.
  • Digital health ecosystems and subscription models are reshaping product access.
  • Practitioner engagement is amplifying credibility and long-term use in neuro-focused regimens.

Competitive Landscape of Magnesium Threonate Supplement Market

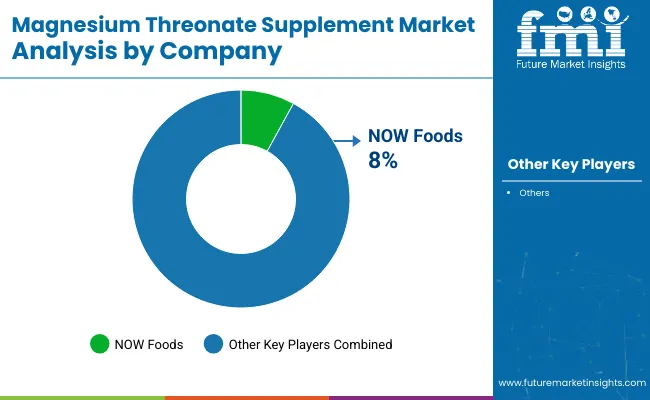
Magnesium Threonate Supplement Market Analysis By Company

Companies Global Value Share 2025
NOW Foods 8%
Others 92%

The Magnesium Threonate Supplement Market is moderately fragmented, characterised by three tiers of competitors: global leaders, mid‑sized innovators, and niche specialists. Market leadership has been maintained by companies such as Life Extension, NOW Foods, Pure Encapsulations, and Thorne Research, which collectively are estimated to account for 30-40% of the global market. These brands have built authority through patented Magtein® formulations, investment in clinical research, and global distribution in health‑conscious markets

Mid‑sized players including Doctor’s Best, Source Naturals, Jarrow Formulas, Swanson Health Products, and Double Wood Supplements have gained traction by offering clinically positioned magnesium threonate formats in capsules, powders, and gummies. These companies have been driving expansion through regional retail networks and e‑commerce partnerships

Niche specialists such as Nootropics Depot focus on customized, research-grade supplement formulations with small batch production and targeted therapeutic positioning. These firms excel in highly specific sub‑segments like student nootropics or stress‑focused blends.

Competitive differentiation is increasingly shifting toward integrated value propositions such as subscription services, third‑party testing validation, and influencer‑driven transparency. Brands are expected to strengthen their positioning through ecosystem-based offerings: digital health guides, product bundles targeting multiple brain health endpoints, and practitioner partnerships.

Key Developments in Magnesium Threonate Supplement Market

  • In January 2025, Sports Research brand was reported to have launched Magtein® Magnesium L‑threonate across all USA Costco clubs, significantly expanding consumer accessibility and retail penetration in mainstream warehouse retail channels.
  • In January 2025, the European Union granted novel food approval for Magtein® (magnesium L‑threonate), authorising exclusive marketing rights to AIDP and ThreoTech across EU member states from November 7, 2024 through 2029, significantly reinforcing regulatory legitimacy and ingredient exclusivity.

Scope of the Report

Item Value
Quantitative Units USD 465.1 million
Ingredient Type Magnesium L- Threonate (Magtein ® and other branded variants)
Application Cognitive Health & Memory Support, Sleep Quality & Relaxation, Stress & Mood Support, Healthy Aging, General Wellness
Product Format Capsules, Tablets, Powders, Gummies, Liquid Formulations
Sales Channel Pharmacies & Drugstores, Health & Nutrition Stores, Online Retail, DTC Brands, Practitioner / Clinic Distribution
Regions Covered North America, Latin America, Europe, East Asia, South Asia & Pacific, Middle East & Africa
Countries Covered United States, Canada, United Kingdom, Germany, France, Japan, South Korea, China, India, Brazil
Key Companies Profiled Life Extension, NOW Foods, Doctor’s Best, Pure Encapsulations, Thorne Research, Source Naturals, Jarrow Formulas, Swanson Health Products, Double Wood Supplements, Nootropics Depot
Additional Attributes Dollar sales by format and region; clinical differentiation vs generic magnesium; use in cognitive protocols; demand driven by aging, stress, digital fatigue; personalized wellness adoption; channel-specific penetration; regulatory developments (e.g., EU novel food approval); competitive positioning of Magtein ®-based formulations.

Key Segments

By Application:

  • Cognitive Health & Memory Support
  • Sleep Quality & Relaxation
  • Stress & Mood Support
  • Healthy Aging & Neuroprotection
  • General Wellness & Nervous System Health

By Product Format:

  • Capsules
  • Tablets
  • Powder
  • Gummies
  • Liquid Formulations

By Sales Channel:

  • Pharmacies & Drugstores
  • Health & Nutrition Stores
  • Online Retail
  • Direct‑to‑Consumer (DTC) Brands
  • Practitioner / Clinic Distribution

By Region:

  • North America
  • Latin America
  • Europe
  • East Asia
  • South Asia & Pacific
  • Middle East & Africa

Table of Content

  1. Executive Summary
    • Global Market Outlook
    • Demand-side Trends
    • Supply-side Trends
    • Technology Roadmap Analysis
    • Analysis and Recommendations
  2. Market Overview
    • Market Coverage / Taxonomy
    • Market Definition / Scope / Limitations
  3. Market Background
    • Market Dynamics
      • Drivers
      • Restraints
      • Opportunity
      • Trends
    • Scenario Forecast
      • Demand in Optimistic Scenario
      • Demand in Likely Scenario
      • Demand in Conservative Scenario
    • Opportunity Map Analysis
    • Product Life Cycle Analysis
    • Supply Chain Analysis
    • Investment Feasibility Matrix
    • Value Chain Analysis
    • PESTLE and Porter’s Analysis
    • Regulatory Landscape
    • Regional Parent Market Outlook
    • Production and Consumption Statistics
    • Import and Export Statistics
  4. Global Market Analysis 2020 to 2024 and Forecast, 2025 to 2035
    • Historical Market Size Value (USD Million) & Volume (Units) Analysis, 2020 to 2024
    • Current and Future Market Size Value (USD Million) & Volume (Units) Projections, 2025 to 2035
      • Y-o-Y Growth Trend Analysis
      • Absolute $ Opportunity Analysis
  5. Global Market Pricing Analysis 2020 to 2024 and Forecast 2025 to 2035
  6. Global Market Analysis 2020 to 2024 and Forecast 2025 to 2035, By Application
    • Introduction / Key Findings
    • Historical Market Size Value (USD Million) & Volume (Units) Analysis By Application, 2020 to 2024
    • Current and Future Market Size Value (USD Million) & Volume (Units) Analysis and Forecast By Application, 2025 to 2035
      • Cognitive Health & Memory Support
      • Sleep Quality & Relaxation
      • Stress & Mood Support
      • Healthy Aging & Neuroprotection
      • General Wellness & Nervous System Health
    • Y-o-Y Growth Trend Analysis By Application, 2020 to 2024
    • Absolute $ Opportunity Analysis By Application, 2025 to 2035
  7. Global Market Analysis 2020 to 2024 and Forecast 2025 to 2035, By Product Format
    • Introduction / Key Findings
    • Historical Market Size Value (USD Million) & Volume (Units) Analysis By Product Format, 2020 to 2024
    • Current and Future Market Size Value (USD Million) & Volume (Units) Analysis and Forecast By Product Format, 2025 to 2035
      • Capsules
      • Tablets
      • Powder
      • Gummies
      • Liquid Formulations
    • Y-o-Y Growth Trend Analysis By Product Format, 2020 to 2024
    • Absolute $ Opportunity Analysis By Product Format, 2025 to 2035
  8. Global Market Analysis 2020 to 2024 and Forecast 2025 to 2035, By Sales Channel
    • Introduction / Key Findings
    • Historical Market Size Value (USD Million) & Volume (Units) Analysis By Sales Channel, 2020 to 2024
    • Current and Future Market Size Value (USD Million) & Volume (Units) Analysis and Forecast By Sales Channel, 2025 to 2035
      • Pharmacies & Drugstores
      • Health & Nutrition Stores
      • Online Retail
      • Direct‑to‑Consumer (DTC) Brands
      • Practitioner / Clinic Distribution
    • Y-o-Y Growth Trend Analysis By Sales Channel, 2020 to 2024
    • Absolute $ Opportunity Analysis By Sales Channel, 2025 to 2035
  9. Global Market Analysis 2020 to 2024 and Forecast 2025 to 2035, By Region
    • Introduction
    • Historical Market Size Value (USD Million) & Volume (Units) Analysis By Region, 2020 to 2024
    • Current Market Size Value (USD Million) & Volume (Units) Analysis and Forecast By Region, 2025 to 2035
      • North America
      • Latin America
      • Europe
      • East Asia
      • South Asia & Pacific
      • Middle East & Africa
    • Market Attractiveness Analysis By Region
  10. North America Market Analysis 2020 to 2024 and Forecast 2025 to 2035, By Country
    • Historical Market Size Value (USD Million) & Volume (Units) Trend Analysis By Market Taxonomy, 2020 to 2024
    • Market Size Value (USD Million) & Volume (Units) Forecast By Market Taxonomy, 2025 to 2035
      • By Country
        • USA
        • Canada
      • By Application
      • By Product Format
      • By Sales Channel
    • Market Attractiveness Analysis
      • By Country
      • By Application
      • By Product Format
      • By Sales Channel
    • Key Takeaways
  11. Latin America Market Analysis 2020 to 2024 and Forecast 2025 to 2035, By Country
    • Historical Market Size Value (USD Million) & Volume (Units) Trend Analysis By Market Taxonomy, 2020 to 2024
    • Market Size Value (USD Million) & Volume (Units) Forecast By Market Taxonomy, 2025 to 2035
      • By Country
        • Brazil
        • Mexico
        • Colombia
        • Rest of Latin America
      • By Application
      • By Product Format
      • By Sales Channel
    • Market Attractiveness Analysis
      • By Country
      • By Application
      • By Product Format
      • By Sales Channel
    • Key Takeaways
  12. Europe Market Analysis 2020 to 2024 and Forecast 2025 to 2035, By Country
    • Historical Market Size Value (USD Million) & Volume (Units) Trend Analysis By Market Taxonomy, 2020 to 2024
    • Market Size Value (USD Million) & Volume (Units) Forecast By Market Taxonomy, 2025 to 2035
      • By Country
        • Germany
        • UK
        • France
        • Italy
        • Spain
        • Belgium
        • Netherlands
        • Nordic
        • Switzerland
        • Russia
        • Poland
        • Rest of Europe
      • By Application
      • By Product Format
      • By Sales Channel
    • Market Attractiveness Analysis
      • By Country
      • By Application
      • By Product Format
      • By Sales Channel
    • Key Takeaways
  13. East Asia Market Analysis 2020 to 2024 and Forecast 2025 to 2035, By Country
    • Historical Market Size Value (USD Million) & Volume (Units) Trend Analysis By Market Taxonomy, 2020 to 2024
    • Market Size Value (USD Million) & Volume (Units) Forecast By Market Taxonomy, 2025 to 2035
      • By Country
        • China
        • Japan
        • South Korea
      • By Application
      • By Product Format
      • By Sales Channel
    • Market Attractiveness Analysis
      • By Country
      • By Application
      • By Product Format
      • By Sales Channel
    • Key Takeaways
  14. South Asia & Pacific Market Analysis 2020 to 2024 and Forecast 2025 to 2035, By Country
    • Historical Market Size Value (USD Million) & Volume (Units) Trend Analysis By Market Taxonomy, 2020 to 2024
    • Market Size Value (USD Million) & Volume (Units) Forecast By Market Taxonomy, 2025 to 2035
      • By Country
        • India
        • Thailand
        • Malaysia
        • Indonesia
        • Singapore
        • Vietnam
        • Australia
        • New Zealand
        • Rest of South Asia
      • By Application
      • By Product Format
      • By Sales Channel
    • Market Attractiveness Analysis
      • By Country
      • By Application
      • By Product Format
      • By Sales Channel
    • Key Takeaways
  15. Middle East & Africa Market Analysis 2020 to 2024 and Forecast 2025 to 2035, By Country
    • Historical Market Size Value (USD Million) & Volume (Units) Trend Analysis By Market Taxonomy, 2020 to 2024
    • Market Size Value (USD Million) & Volume (Units) Forecast By Market Taxonomy, 2025 to 2035
      • By Country
        • Kingdom of Saudi Arabia
        • Other GCC Countries
        • Turkiye
        • South Africa
        • Other African Union
        • Rest of Middle East & Africa
      • By Application
      • By Product Format
      • By Sales Channel
    • Market Attractiveness Analysis
      • By Country
      • By Application
      • By Product Format
      • By Sales Channel
    • Key Takeaways
  16. Key Countries Market Analysis
    • USA
      • Pricing Analysis
      • Market Share Analysis, 2024
        • By Application
        • By Product Format
        • By Sales Channel
    • Canada
      • Pricing Analysis
      • Market Share Analysis, 2024
        • By Application
        • By Product Format
        • By Sales Channel
    • Brazil
      • Pricing Analysis
      • Market Share Analysis, 2024
        • By Application
        • By Product Format
        • By Sales Channel
    • Mexico
      • Pricing Analysis
      • Market Share Analysis, 2024
        • By Application
        • By Product Format
        • By Sales Channel
    • Colombia
      • Pricing Analysis
      • Market Share Analysis, 2024
        • By Application
        • By Product Format
        • By Sales Channel
    • Germany
      • Pricing Analysis
      • Market Share Analysis, 2024
        • By Application
        • By Product Format
        • By Sales Channel
    • UK
      • Pricing Analysis
      • Market Share Analysis, 2024
        • By Application
        • By Product Format
        • By Sales Channel
    • France
      • Pricing Analysis
      • Market Share Analysis, 2024
        • By Application
        • By Product Format
        • By Sales Channel
    • Italy
      • Pricing Analysis
      • Market Share Analysis, 2024
        • By Application
        • By Product Format
        • By Sales Channel
    • Spain
      • Pricing Analysis
      • Market Share Analysis, 2024
        • By Application
        • By Product Format
        • By Sales Channel
    • Belgium
      • Pricing Analysis
      • Market Share Analysis, 2024
        • By Application
        • By Product Format
        • By Sales Channel
    • Netherlands
      • Pricing Analysis
      • Market Share Analysis, 2024
        • By Application
        • By Product Format
        • By Sales Channel
    • Nordic
      • Pricing Analysis
      • Market Share Analysis, 2024
        • By Application
        • By Product Format
        • By Sales Channel
    • Switzerland
      • Pricing Analysis
      • Market Share Analysis, 2024
        • By Application
        • By Product Format
        • By Sales Channel
    • Russia
      • Pricing Analysis
      • Market Share Analysis, 2024
        • By Application
        • By Product Format
        • By Sales Channel
    • Poland
      • Pricing Analysis
      • Market Share Analysis, 2024
        • By Application
        • By Product Format
        • By Sales Channel
    • China
      • Pricing Analysis
      • Market Share Analysis, 2024
        • By Application
        • By Product Format
        • By Sales Channel
    • Japan
      • Pricing Analysis
      • Market Share Analysis, 2024
        • By Application
        • By Product Format
        • By Sales Channel
    • South Korea
      • Pricing Analysis
      • Market Share Analysis, 2024
        • By Application
        • By Product Format
        • By Sales Channel
    • India
      • Pricing Analysis
      • Market Share Analysis, 2024
        • By Application
        • By Product Format
        • By Sales Channel
    • Thailand
      • Pricing Analysis
      • Market Share Analysis, 2024
        • By Application
        • By Product Format
        • By Sales Channel
    • Indonesia
      • Pricing Analysis
      • Market Share Analysis, 2024
        • By Application
        • By Product Format
        • By Sales Channel
    • Australia
      • Pricing Analysis
      • Market Share Analysis, 2024
        • By Application
        • By Product Format
        • By Sales Channel
    • New Zealand
      • Pricing Analysis
      • Market Share Analysis, 2024
        • By Application
        • By Product Format
        • By Sales Channel
    • Turkey
      • Pricing Analysis
      • Market Share Analysis, 2024
        • By Application
        • By Product Format
        • By Sales Channel
    • UAE
      • Pricing Analysis
      • Market Share Analysis, 2024
        • By Application
        • By Product Format
        • By Sales Channel
    • Saudi Arabia
      • Pricing Analysis
      • Market Share Analysis, 2024
        • By Application
        • By Product Format
        • By Sales Channel
    • Israel
      • Pricing Analysis
      • Market Share Analysis, 2024
        • By Application
        • By Product Format
        • By Sales Channel
    • North Africa
      • Pricing Analysis
      • Market Share Analysis, 2024
        • By Application
        • By Product Format
        • By Sales Channel
    • South Africa
      • Pricing Analysis
      • Market Share Analysis, 2024
        • By Application
        • By Product Format
        • By Sales Channel
  17. Market Structure Analysis
    • Competition Dashboard
    • Competition Benchmarking
    • Market Share Analysis of Top Players
      • By Regional
      • By Application
      • By Product Format
      • By Sales Channel
  18. Competition Analysis
    • Competition Deep Dive
      • Life Extension
        • Overview
        • Product Portfolio
        • Profitability by Market Segments (Product/Age /Sales Channel/Region)
        • Sales Footprint
        • Strategy Overview
        • NOW Foods
        • Doctor’s Best
        • Pure Encapsulations
        • Thorne Research
        • Source Naturals
        • Double Wood Supplements
        • Jarrow Formulas
        • Swanson Health Products
        • Nootropics Depot
        • Others
    • Assumptions & Acronyms Used
    • Research Methodology

List of Tables

  • Table 1: Global Market Value (USD Million) Forecast by Region, 2020-2035
  • Table 2: Global Market Volume (Units) Forecast by Region, 2020-2035
  • Table 3: Global Market Value (USD Million) Forecast by Application, 2020-2035
  • Table 4: Global Market Volume (Units) Forecast by Application, 2020-2035
  • Table 5: Global Market Value (USD Million) Forecast by Product Format, 2020-2035
  • Table 6: Global Market Volume (Units) Forecast by Product Format, 2020-2035
  • Table 7: Global Market Value (USD Million) Forecast by Sales Channel, 2020-2035
  • Table 8: Global Market Volume (Units) Forecast by Sales Channel, 2020-2035
  • Table 9: North America Market Value (USD Million) Forecast by Country, 2020-2035
  • Table 10: North America Market Volume (Units) Forecast by Country, 2020-2035
  • Table 11: North America Market Value (USD Million) Forecast by Application, 2020-2035
  • Table 12: North America Market Volume (Units) Forecast by Application, 2020-2035
  • Table 13: North America Market Value (USD Million) Forecast by Product Format, 2020-2035
  • Table 14: North America Market Volume (Units) Forecast by Product Format, 2020-2035
  • Table 15: North America Market Value (USD Million) Forecast by Sales Channel, 2020-2035
  • Table 16: North America Market Volume (Units) Forecast by Sales Channel, 2020-2035
  • Table 17: Latin America Market Value (USD Million) Forecast by Country, 2020-2035
  • Table 18: Latin America Market Volume (Units) Forecast by Country, 2020-2035
  • Table 19: Latin America Market Value (USD Million) Forecast by Application, 2020-2035
  • Table 20: Latin America Market Volume (Units) Forecast by Application, 2020-2035
  • Table 21: Latin America Market Value (USD Million) Forecast by Product Format, 2020-2035
  • Table 22: Latin America Market Volume (Units) Forecast by Product Format, 2020-2035
  • Table 23: Latin America Market Value (USD Million) Forecast by Sales Channel, 2020-2035
  • Table 24: Latin America Market Volume (Units) Forecast by Sales Channel, 2020-2035
  • Table 25: Europe Market Value (USD Million) Forecast by Country, 2020-2035
  • Table 26: Europe Market Volume (Units) Forecast by Country, 2020-2035
  • Table 27: Europe Market Value (USD Million) Forecast by Application, 2020-2035
  • Table 28: Europe Market Volume (Units) Forecast by Application, 2020-2035
  • Table 29: Europe Market Value (USD Million) Forecast by Product Format, 2020-2035
  • Table 30: Europe Market Volume (Units) Forecast by Product Format, 2020-2035
  • Table 31: Europe Market Value (USD Million) Forecast by Sales Channel, 2020-2035
  • Table 32: Europe Market Volume (Units) Forecast by Sales Channel, 2020-2035
  • Table 33: East Asia Market Value (USD Million) Forecast by Country, 2020-2035
  • Table 34: East Asia Market Volume (Units) Forecast by Country, 2020-2035
  • Table 35: East Asia Market Value (USD Million) Forecast by Application, 2020-2035
  • Table 36: East Asia Market Volume (Units) Forecast by Application, 2020-2035
  • Table 37: East Asia Market Value (USD Million) Forecast by Product Format, 2020-2035
  • Table 38: East Asia Market Volume (Units) Forecast by Product Format, 2020-2035
  • Table 39: East Asia Market Value (USD Million) Forecast by Sales Channel, 2020-2035
  • Table 40: East Asia Market Volume (Units) Forecast by Sales Channel, 2020-2035
  • Table 41: South Asia & Pacific Market Value (USD Million) Forecast by Country, 2020-2035
  • Table 42: South Asia & Pacific Market Volume (Units) Forecast by Country, 2020-2035
  • Table 43: South Asia & Pacific Market Value (USD Million) Forecast by Application, 2020-2035
  • Table 44: South Asia & Pacific Market Volume (Units) Forecast by Application, 2020-2035
  • Table 45: South Asia & Pacific Market Value (USD Million) Forecast by Product Format, 2020-2035
  • Table 46: South Asia & Pacific Market Volume (Units) Forecast by Product Format, 2020-2035
  • Table 47: South Asia & Pacific Market Value (USD Million) Forecast by Sales Channel, 2020-2035
  • Table 48: South Asia & Pacific Market Volume (Units) Forecast by Sales Channel, 2020-2035
  • Table 49: MEA Market Value (USD Million) Forecast by Country, 2020-2035
  • Table 50: MEA Market Volume (Units) Forecast by Country, 2020-2035
  • Table 51: MEA Market Value (USD Million) Forecast by Application, 2020-2035
  • Table 52: MEA Market Volume (Units) Forecast by Application, 2020-2035
  • Table 53: MEA Market Value (USD Million) Forecast by Product Format, 2020-2035
  • Table 54: MEA Market Volume (Units) Forecast by Product Format, 2020-2035
  • Table 55: MEA Market Value (USD Million) Forecast by Sales Channel, 2020-2035
  • Table 56: MEA Market Volume (Units) Forecast by Sales Channel, 2020-2035

List of Figures

  • Figure 1: Global Market Value (USD Million) by Application, 2025-2035
  • Figure 2: Global Market Value (USD Million) by Product Format, 2025-2035
  • Figure 3: Global Market Value (USD Million) by Sales Channel, 2025-2035
  • Figure 4: Global Market Value (USD Million) by Region, 2025-2035
  • Figure 5: Global Market Value (USD Million) Analysis by Region, 2020-2035
  • Figure 6: Global Market Volume (Units) Analysis by Region, 2020-2035
  • Figure 7: Global Market Value Share (%) and BPS Analysis by Region, 2025-2035
  • Figure 8: Global Market Y-o-Y Growth (%) Projections by Region, 2025-2035
  • Figure 9: Global Market Value (USD Million) Analysis by Application, 2020-2035
  • Figure 10: Global Market Volume (Units) Analysis by Application, 2020-2035
  • Figure 11: Global Market Value Share (%) and BPS Analysis by Application, 2025-2035
  • Figure 12: Global Market Y-o-Y Growth (%) Projections by Application, 2025-2035
  • Figure 13: Global Market Value (USD Million) Analysis by Product Format, 2020-2035
  • Figure 14: Global Market Volume (Units) Analysis by Product Format, 2020-2035
  • Figure 15: Global Market Value Share (%) and BPS Analysis by Product Format, 2025-2035
  • Figure 16: Global Market Y-o-Y Growth (%) Projections by Product Format, 2025-2035
  • Figure 17: Global Market Value (USD Million) Analysis by Sales Channel, 2020-2035
  • Figure 18: Global Market Volume (Units) Analysis by Sales Channel, 2020-2035
  • Figure 19: Global Market Value Share (%) and BPS Analysis by Sales Channel, 2025-2035
  • Figure 20: Global Market Y-o-Y Growth (%) Projections by Sales Channel, 2025-2035
  • Figure 21: Global Market Attractiveness by Application, 2025-2035
  • Figure 22: Global Market Attractiveness by Product Format, 2025-2035
  • Figure 23: Global Market Attractiveness by Sales Channel, 2025-2035
  • Figure 24: Global Market Attractiveness by Region, 2025-2035
  • Figure 25: North America Market Value (USD Million) by Application, 2025-2035
  • Figure 26: North America Market Value (USD Million) by Product Format, 2025-2035
  • Figure 27: North America Market Value (USD Million) by Sales Channel, 2025-2035
  • Figure 28: North America Market Value (USD Million) by Country, 2025-2035
  • Figure 29: North America Market Value (USD Million) Analysis by Country, 2020-2035
  • Figure 30: North America Market Volume (Units) Analysis by Country, 2020-2035
  • Figure 31: North America Market Value Share (%) and BPS Analysis by Country, 2025-2035
  • Figure 32: North America Market Y-o-Y Growth (%) Projections by Country, 2025-2035
  • Figure 33: North America Market Value (USD Million) Analysis by Application, 2020-2035
  • Figure 34: North America Market Volume (Units) Analysis by Application, 2020-2035
  • Figure 35: North America Market Value Share (%) and BPS Analysis by Application, 2025-2035
  • Figure 36: North America Market Y-o-Y Growth (%) Projections by Application, 2025-2035
  • Figure 37: North America Market Value (USD Million) Analysis by Product Format, 2020-2035
  • Figure 38: North America Market Volume (Units) Analysis by Product Format, 2020-2035
  • Figure 39: North America Market Value Share (%) and BPS Analysis by Product Format, 2025-2035
  • Figure 40: North America Market Y-o-Y Growth (%) Projections by Product Format, 2025-2035
  • Figure 41: North America Market Value (USD Million) Analysis by Sales Channel, 2020-2035
  • Figure 42: North America Market Volume (Units) Analysis by Sales Channel, 2020-2035
  • Figure 43: North America Market Value Share (%) and BPS Analysis by Sales Channel, 2025-2035
  • Figure 44: North America Market Y-o-Y Growth (%) Projections by Sales Channel, 2025-2035
  • Figure 45: North America Market Attractiveness by Application, 2025-2035
  • Figure 46: North America Market Attractiveness by Product Format, 2025-2035
  • Figure 47: North America Market Attractiveness by Sales Channel, 2025-2035
  • Figure 48: North America Market Attractiveness by Country, 2025-2035
  • Figure 49: Latin America Market Value (USD Million) by Application, 2025-2035
  • Figure 50: Latin America Market Value (USD Million) by Product Format, 2025-2035
  • Figure 51: Latin America Market Value (USD Million) by Sales Channel, 2025-2035
  • Figure 52: Latin America Market Value (USD Million) by Country, 2025-2035
  • Figure 53: Latin America Market Value (USD Million) Analysis by Country, 2020-2035
  • Figure 54: Latin America Market Volume (Units) Analysis by Country, 2020-2035
  • Figure 55: Latin America Market Value Share (%) and BPS Analysis by Country, 2025-2035
  • Figure 56: Latin America Market Y-o-Y Growth (%) Projections by Country, 2025-2035
  • Figure 57: Latin America Market Value (USD Million) Analysis by Application, 2020-2035
  • Figure 58: Latin America Market Volume (Units) Analysis by Application, 2020-2035
  • Figure 59: Latin America Market Value Share (%) and BPS Analysis by Application, 2025-2035
  • Figure 60: Latin America Market Y-o-Y Growth (%) Projections by Application, 2025-2035
  • Figure 61: Latin America Market Value (USD Million) Analysis by Product Format, 2020-2035
  • Figure 62: Latin America Market Volume (Units) Analysis by Product Format, 2020-2035
  • Figure 63: Latin America Market Value Share (%) and BPS Analysis by Product Format, 2025-2035
  • Figure 64: Latin America Market Y-o-Y Growth (%) Projections by Product Format, 2025-2035
  • Figure 65: Latin America Market Value (USD Million) Analysis by Sales Channel, 2020-2035
  • Figure 66: Latin America Market Volume (Units) Analysis by Sales Channel, 2020-2035
  • Figure 67: Latin America Market Value Share (%) and BPS Analysis by Sales Channel, 2025-2035
  • Figure 68: Latin America Market Y-o-Y Growth (%) Projections by Sales Channel, 2025-2035
  • Figure 69: Latin America Market Attractiveness by Application, 2025-2035
  • Figure 70: Latin America Market Attractiveness by Product Format, 2025-2035
  • Figure 71: Latin America Market Attractiveness by Sales Channel, 2025-2035
  • Figure 72: Latin America Market Attractiveness by Country, 2025-2035
  • Figure 73: Europe Market Value (USD Million) by Application, 2025-2035
  • Figure 74: Europe Market Value (USD Million) by Product Format, 2025-2035
  • Figure 75: Europe Market Value (USD Million) by Sales Channel, 2025-2035
  • Figure 76: Europe Market Value (USD Million) by Country, 2025-2035
  • Figure 77: Europe Market Value (USD Million) Analysis by Country, 2020-2035
  • Figure 78: Europe Market Volume (Units) Analysis by Country, 2020-2035
  • Figure 79: Europe Market Value Share (%) and BPS Analysis by Country, 2025-2035
  • Figure 80: Europe Market Y-o-Y Growth (%) Projections by Country, 2025-2035
  • Figure 81: Europe Market Value (USD Million) Analysis by Application, 2020-2035
  • Figure 82: Europe Market Volume (Units) Analysis by Application, 2020-2035
  • Figure 83: Europe Market Value Share (%) and BPS Analysis by Application, 2025-2035
  • Figure 84: Europe Market Y-o-Y Growth (%) Projections by Application, 2025-2035
  • Figure 85: Europe Market Value (USD Million) Analysis by Product Format, 2020-2035
  • Figure 86: Europe Market Volume (Units) Analysis by Product Format, 2020-2035
  • Figure 87: Europe Market Value Share (%) and BPS Analysis by Product Format, 2025-2035
  • Figure 88: Europe Market Y-o-Y Growth (%) Projections by Product Format, 2025-2035
  • Figure 89: Europe Market Value (USD Million) Analysis by Sales Channel, 2020-2035
  • Figure 90: Europe Market Volume (Units) Analysis by Sales Channel, 2020-2035
  • Figure 91: Europe Market Value Share (%) and BPS Analysis by Sales Channel, 2025-2035
  • Figure 92: Europe Market Y-o-Y Growth (%) Projections by Sales Channel, 2025-2035
  • Figure 93: Europe Market Attractiveness by Application, 2025-2035
  • Figure 94: Europe Market Attractiveness by Product Format, 2025-2035
  • Figure 95: Europe Market Attractiveness by Sales Channel, 2025-2035
  • Figure 96: Europe Market Attractiveness by Country, 2025-2035
  • Figure 97: East Asia Market Value (USD Million) by Application, 2025-2035
  • Figure 98: East Asia Market Value (USD Million) by Product Format, 2025-2035
  • Figure 99: East Asia Market Value (USD Million) by Sales Channel, 2025-2035
  • Figure 100: East Asia Market Value (USD Million) by Country, 2025-2035
  • Figure 101: East Asia Market Value (USD Million) Analysis by Country, 2020-2035
  • Figure 102: East Asia Market Volume (Units) Analysis by Country, 2020-2035
  • Figure 103: East Asia Market Value Share (%) and BPS Analysis by Country, 2025-2035
  • Figure 104: East Asia Market Y-o-Y Growth (%) Projections by Country, 2025-2035
  • Figure 105: East Asia Market Value (USD Million) Analysis by Application, 2020-2035
  • Figure 106: East Asia Market Volume (Units) Analysis by Application, 2020-2035
  • Figure 107: East Asia Market Value Share (%) and BPS Analysis by Application, 2025-2035
  • Figure 108: East Asia Market Y-o-Y Growth (%) Projections by Application, 2025-2035
  • Figure 109: East Asia Market Value (USD Million) Analysis by Product Format, 2020-2035
  • Figure 110: East Asia Market Volume (Units) Analysis by Product Format, 2020-2035
  • Figure 111: East Asia Market Value Share (%) and BPS Analysis by Product Format, 2025-2035
  • Figure 112: East Asia Market Y-o-Y Growth (%) Projections by Product Format, 2025-2035
  • Figure 113: East Asia Market Value (USD Million) Analysis by Sales Channel, 2020-2035
  • Figure 114: East Asia Market Volume (Units) Analysis by Sales Channel, 2020-2035
  • Figure 115: East Asia Market Value Share (%) and BPS Analysis by Sales Channel, 2025-2035
  • Figure 116: East Asia Market Y-o-Y Growth (%) Projections by Sales Channel, 2025-2035
  • Figure 117: East Asia Market Attractiveness by Application, 2025-2035
  • Figure 118: East Asia Market Attractiveness by Product Format, 2025-2035
  • Figure 119: East Asia Market Attractiveness by Sales Channel, 2025-2035
  • Figure 120: East Asia Market Attractiveness by Country, 2025-2035
  • Figure 121: South Asia & Pacific Market Value (USD Million) by Application, 2025-2035
  • Figure 122: South Asia & Pacific Market Value (USD Million) by Product Format, 2025-2035
  • Figure 123: South Asia & Pacific Market Value (USD Million) by Sales Channel, 2025-2035
  • Figure 124: South Asia & Pacific Market Value (USD Million) by Country, 2025-2035
  • Figure 125: South Asia & Pacific Market Value (USD Million) Analysis by Country, 2020-2035
  • Figure 126: South Asia & Pacific Market Volume (Units) Analysis by Country, 2020-2035
  • Figure 127: South Asia & Pacific Market Value Share (%) and BPS Analysis by Country, 2025-2035
  • Figure 128: South Asia & Pacific Market Y-o-Y Growth (%) Projections by Country, 2025-2035
  • Figure 129: South Asia & Pacific Market Value (USD Million) Analysis by Application, 2020-2035
  • Figure 130: South Asia & Pacific Market Volume (Units) Analysis by Application, 2020-2035
  • Figure 131: South Asia & Pacific Market Value Share (%) and BPS Analysis by Application, 2025-2035
  • Figure 132: South Asia & Pacific Market Y-o-Y Growth (%) Projections by Application, 2025-2035
  • Figure 133: South Asia & Pacific Market Value (USD Million) Analysis by Product Format, 2020-2035
  • Figure 134: South Asia & Pacific Market Volume (Units) Analysis by Product Format, 2020-2035
  • Figure 135: South Asia & Pacific Market Value Share (%) and BPS Analysis by Product Format, 2025-2035
  • Figure 136: South Asia & Pacific Market Y-o-Y Growth (%) Projections by Product Format, 2025-2035
  • Figure 137: South Asia & Pacific Market Value (USD Million) Analysis by Sales Channel, 2020-2035
  • Figure 138: South Asia & Pacific Market Volume (Units) Analysis by Sales Channel, 2020-2035
  • Figure 139: South Asia & Pacific Market Value Share (%) and BPS Analysis by Sales Channel, 2025-2035
  • Figure 140: South Asia & Pacific Market Y-o-Y Growth (%) Projections by Sales Channel, 2025-2035
  • Figure 141: South Asia & Pacific Market Attractiveness by Application, 2025-2035
  • Figure 142: South Asia & Pacific Market Attractiveness by Product Format, 2025-2035
  • Figure 143: South Asia & Pacific Market Attractiveness by Sales Channel, 2025-2035
  • Figure 144: South Asia & Pacific Market Attractiveness by Country, 2025-2035
  • Figure 145: MEA Market Value (USD Million) by Application, 2025-2035
  • Figure 146: MEA Market Value (USD Million) by Product Format, 2025-2035
  • Figure 147: MEA Market Value (USD Million) by Sales Channel, 2025-2035
  • Figure 148: MEA Market Value (USD Million) by Country, 2025-2035
  • Figure 149: MEA Market Value (USD Million) Analysis by Country, 2020-2035
  • Figure 150: MEA Market Volume (Units) Analysis by Country, 2020-2035
  • Figure 151: MEA Market Value Share (%) and BPS Analysis by Country, 2025-2035
  • Figure 152: MEA Market Y-o-Y Growth (%) Projections by Country, 2025-2035
  • Figure 153: MEA Market Value (USD Million) Analysis by Application, 2020-2035
  • Figure 154: MEA Market Volume (Units) Analysis by Application, 2020-2035
  • Figure 155: MEA Market Value Share (%) and BPS Analysis by Application, 2025-2035
  • Figure 156: MEA Market Y-o-Y Growth (%) Projections by Application, 2025-2035
  • Figure 157: MEA Market Value (USD Million) Analysis by Product Format, 2020-2035
  • Figure 158: MEA Market Volume (Units) Analysis by Product Format, 2020-2035
  • Figure 159: MEA Market Value Share (%) and BPS Analysis by Product Format, 2025-2035
  • Figure 160: MEA Market Y-o-Y Growth (%) Projections by Product Format, 2025-2035
  • Figure 161: MEA Market Value (USD Million) Analysis by Sales Channel, 2020-2035
  • Figure 162: MEA Market Volume (Units) Analysis by Sales Channel, 2020-2035
  • Figure 163: MEA Market Value Share (%) and BPS Analysis by Sales Channel, 2025-2035
  • Figure 164: MEA Market Y-o-Y Growth (%) Projections by Sales Channel, 2025-2035
  • Figure 165: MEA Market Attractiveness by Application, 2025-2035
  • Figure 166: MEA Market Attractiveness by Product Format, 2025-2035
  • Figure 167: MEA Market Attractiveness by Sales Channel, 2025-2035
  • Figure 168: MEA Market Attractiveness by Country, 2025-2035

Frequently Asked Questions

How big is the Magnesium Threonate Supplement Market in 2025?

The global Magnesium Threonate Supplement Market is estimated to be valued at USD 465.1 million in 2025.

What will be the size of the Magnesium Threonate Supplement Market in 2035?

The market size for the Magnesium Threonate Supplement Market is projected to reach approximately USD 731.4 million by 2035.

How much will the Magnesium Threonate Supplement Market grow between 2025 and 2035?

The Magnesium Threonate Supplement Market is expected to grow at a CAGR of 4.6% between 2025 and 2035.

What are the key product formats in the Magnesium Threonate Supplement Market?

The key product formats in the Magnesium Threonate Supplement Market include capsules, tablets, powders, gummies, and liquid formulations.

Which application segment will contribute a significant share in the Magnesium Threonate Supplement Market in 2025?

In terms of application, the Cognitive Health & Memory Support segment is projected to command the highest share at 30% in the Magnesium Threonate Supplement Market in 2025.

Explore Similar Insights

Future Market Insights

Magnesium Threonate Supplement Market