Marula Oil Infusions Market Size and Share Forecast Outlook 2025 to 2035

The Marula Oil Infusions Market is projected to grow from USD 1,052.8 million in 2025 to USD 3,562.7 million by 2035, at a CAGR of 13.0%. The moisturizing function will dominate with a 52.5% market share in 2025, while oils will lead the product type segment with a 50.5% share in the same year.
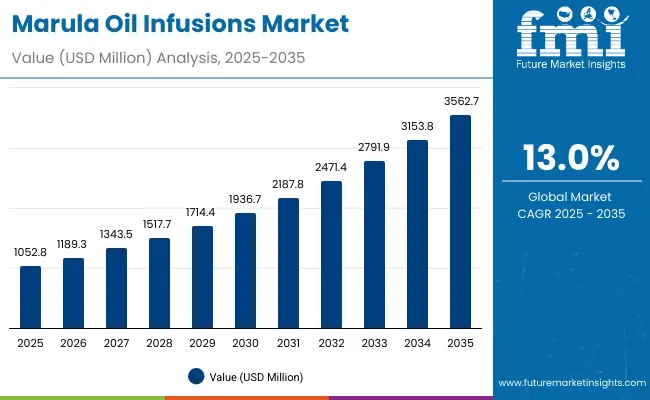
Quick Stats for Marula Oil Infusions Market

  • Marula Oil Infusions Market Value (2025): USD 1,052.8 million
  • Marula Oil Infusions Market Forecast Value (2035): USD 3,562.7 million
  • Marula Oil Infusions Market Forecast CAGR: 13.0%
  • Leading Segment in Marula Oil Infusions Market in 2025: Moisturizing (52.5%)
  • Key Growth Regions in the Marula Oil Infusions Market: North America, Asia-Pacific, Europe
  • Top Key Players in Marula Oil Infusions Market: Drunk Elephant, The Ordinary, Acure, African Botanics, Shea Terra Organics, John Paul Selects, Marula by John Paul, Kiehl’s, Eminence, Aubrey Organics

Marula Oil Infusions Market

Marula Oil Infusions Market Key Takeaways

Metric Value
Marula Oil Infusions Market Estimated Value in (2025E) USD 1,052.8 million
Marula Oil Infusions Market Forecast Value in (2035F) USD 3,562.7 million
Forecast CAGR (2025 to 2035) 13.0%

During the first five-year phase (2025-2030), the market expands from USD 1,052.8 million to USD 1,936.7 million, adding USD 883.9 million equivalent to around 35% of total decade growth. Growth in this period is fueled by consumer preference for hydration-focused oils, creams, and serums, combined with rising adoption of vegan and clean-label claims.

In the second half (2030-2035), the market accelerates by USD 1,626 million, accounting for 65% of total decade growth, as demand surges in Asia-Pacific and Europe. Expansion is supported by e-commerce platforms, premium brand launches, and dermatologist-tested certifications, making marula oilbased infusions a central part of natural skincare routines globally.

From 2020 to 2024, the Marula Oil Infusions Market gained traction as consumer preference for natural oils and clean beauty intensified. Growth was largely driven by moisturizing and anti-aging functions, supported by the rise of premium and niche indie brands that emphasized transparency, vegan positioning, and ethical sourcing. During this period, the competitive landscape was dominated by ingredient-led skincare innovators, who controlled nearly 70-75% of revenues by targeting both premium and affordable categories. Digital-first adoption remained minimal, contributing less than 10% of total market value.

Demand for Marula Oil Infusions is expected to reach USD 1,052.8 million in 2025, with the revenue mix shifting as vegan-certified claims, organic positioning, and e-commerce sales gain traction. Traditional premium leaders now face growing competition from indie and region-specific brands, especially in Asia-Pacific, where cost-effective, plant-based oils are expanding rapidly. Competitive advantage is shifting from brand heritage alone to innovation in delivery formats, direct-to-consumer engagement, and sustainability-driven differentiation.

Why the Marula Oil Infusions Market is growing?

Marula oil is rich in fatty acids, antioxidants, and amino acids, making it highly effective for deep hydration and barrier repair. Consumers are increasingly choosing marula oilinfused products over synthetic moisturizers due to its natural origin and fast absorption. This shift toward clean, plant-based hydration solutions is accelerating market adoption, particularly in serums, oils, and creams targeted at dryness and sensitive skin concerns.

The global surge in vegan, cruelty-free, and ethically sourced beauty is boosting marula oil infusions, which align perfectly with consumer values. Brands emphasize fair-trade sourcing from African regions and eco-conscious packaging to attract ethically driven buyers. Younger demographics, especially Gen Z and millennials, are prioritizing products with transparent ingredient lists and sustainability credentials, positioning marula oil as a preferred active in clean-label and premium skincare portfolios.

Segmental Analysis

The market is segmented by function, product type, channel, claim, and region. Functional categories include moisturizing, anti-aging, brightening, and repair, reflecting marula oil’s versatility in addressing hydration, wrinkle reduction, radiance, and barrier-strengthening needs. Based on product type, segmentation covers oils, creams/lotions, serums, and masks. Oils remain the backbone of the market given marula oil’s natural profile, while creams and serums are gaining traction for their daily-use convenience and targeted benefits. Masks, though smaller, are carving a niche in intensive skincare treatments.

Sales channels include e-commerce, pharmacies, mass retail, and specialty beauty stores, providing a mix of digital-first convenience and offline trust. E-commerce is rapidly expanding due to influencer-driven marketing and subscription models, while pharmacies continue to anchor credibility for dermatologist-tested products. Claims-based segmentation spans vegan, natural/organic, clean-label, and dermatologist-tested, underscoring rising demand for ethical, transparent, and science-backed formulations. Vegan certification and fair-trade sourcing resonate strongly with conscious consumers, while dermatologist-tested claims reinforce efficacy in premium categories.

Regionally, the market scope includes North America, Asia-Pacific, and Europe, with notable growth in the United States, China, India, Germany, the UK, and Japan. Asia-Pacific is projected to record the fastest CAGR, supported by growing consumer preference for natural oils and surging adoption of clean beauty in urban centers.
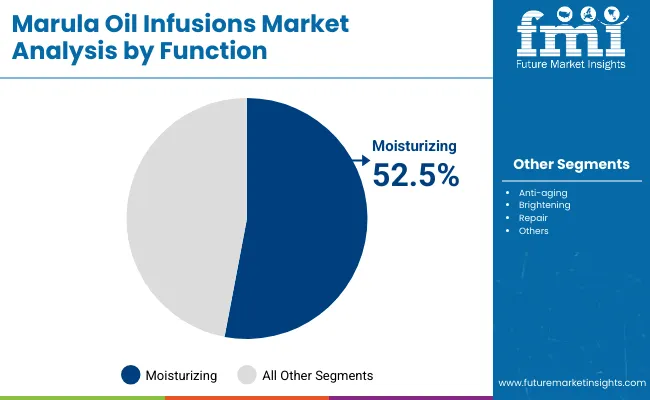
Insights into the Function Segment with Moisturizing Leading in Market Share

Marula Oil Infusions Market By Function

Function Value Share% 2025
Moisturizing 52.5%
Others 47.5%

The moisturizing segment is projected to contribute 52.5% of the Marula Oil Infusions Market revenue in 2025, establishing it as the dominant function category. This leadership is driven by marula oil’s natural richness in essential fatty acids and antioxidants, which deliver deep hydration and barrier protectionappealing to consumers with dry and sensitive skin.

The segment’s growth is further supported by the rising demand for multi-functional daily-use creams, oils, and serums that combine hydration with anti-aging and brightening benefits. As vegan and clean-label positioning gain traction, moisturizing products with marula oil infusions are expected to remain the backbone of the market throughout the forecast period.
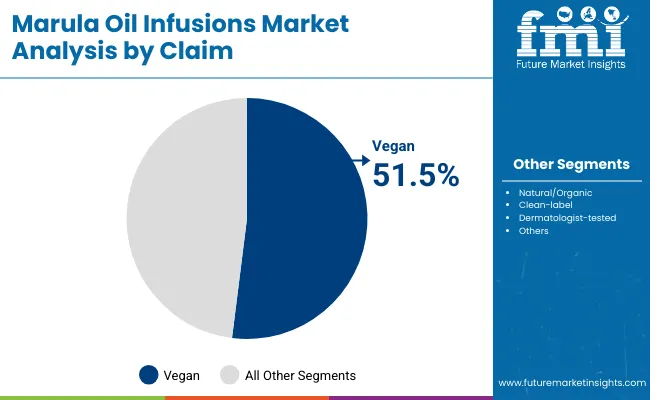
Insights into the Claim Segment with Vegan Leading in Market Share

Marula Oil Infusions Market By Claim

Claim Value Share% 2025
Vegan 51.5%
Others 48.5%

The vegan segment is forecasted to hold 51.5% of the Marula Oil Infusions Market share in 2025, making it the leading claim category. This dominance is fueled by increasing consumer demand for cruelty-free, ethically sourced, and plant-based skincare, where marula oil’s natural origin aligns perfectly with conscious beauty preferences.

Fair-trade sourcing from Africa, sustainability initiatives, and clean-label positioning, which resonate strongly with Gen Z and millennial consumers, further supports the segment’s growth. As global retailers expand vegan-certified beauty sections, marula oil infusions positioned under this claim are expected to remain at the forefront of adoption.
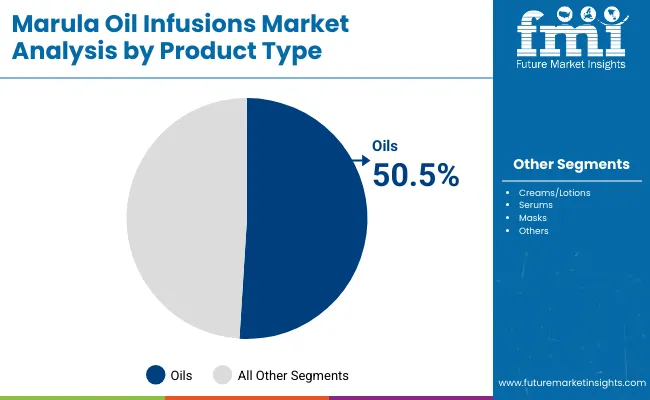
Insights into the Product Type Segment with Oils Leading in Market Share

Marula Oil Infusions Market By Product Type

Product Type Value Share% 2025
Oils 50.5%
Others 49.5%

The oils segment is projected to account for 50.5% of the Marula Oil Infusions Market revenue in 2025, making it the dominant product type. This leadership stems from marula oil’s natural appeal as a pure, cold-pressed ingredient that delivers hydration, anti-aging, and repair benefits in its most concentrated form. Oils are widely used both as standalone products and as base infusions in multipurpose skincare routines.

Growth in this segment is also supported by the popularity of vegan and clean-label claims, which highlight marula oil’s ethical sourcing and minimal processing. As consumers increasingly prefer simple, natural formulations with visible results, oils are expected to remain at the forefront of marula oil infusion adoption through 2035.

What are the Drivers, Restraints, and Key Trends of the Marula Oil Infusions Market?

Rising Consumer Preference for Natural Oils

The growing shift toward plant-based and natural skincare is a major driver of the Marula Oil Infusions Market. Rich in antioxidants, omega fatty acids, and amino acids, marula oil provides deep moisturization, anti-aging benefits, and skin barrier repair. Consumers increasingly seek alternatives to synthetic moisturizers, fueling demand across premium and mass-market skincare. Its versatility across oils, serums, and creams ensures wide adoption, while clean-label and vegan certifications further enhance its appeal to health-conscious and ethically aware buyers.

Expansion of E-commerce and D2C Models

E-commerce platforms and direct-to-consumer (D2C) brands are accelerating the reach of marula oilinfused skincare products globally. Digital-native beauty startups leverage influencer marketing, subscription kits, and personalized recommendations to capture young consumers, particularly in Asia-Pacific and North America. This trend enables rapid consumer education around marula oil’s benefits, while affordable online launches increase penetration in tier-2 and tier-3 cities. The channel’s scalability and low entry barriers allow both established players and niche brands to expand faster than traditional retail.

Regulatory and Certification Challenges

Despite strong demand, inconsistent global regulations around natural oils and organic certifications pose challenges for the Marula Oil Infusions Market. Differing standards across the USA, EU, and Asia complicate labeling, delay product launches, and increase compliance costs, particularly for smaller brands. Misleading claims regarding purity, sourcing, or therapeutic benefits may also create skepticism among consumers. This lack of harmonization slows cross-border trade and limits the scalability of marula oil products, restraining growth despite rising consumer interest.

Integration into Multi-Functional Skincare Routines

A key trend is the incorporation of marula oil into multi-functional skincare solutions. Consumers increasingly favor simplified routines with products offering hydration, anti-aging, brightening, and repair benefits in one formula. Marula oil’s versatility makes it ideal for hybrid serums, creams, and oils that serve multiple purposes. Brands are innovating with encapsulation technologies, blends with peptides, and sustainable packaging to meet these evolving expectations. This shift toward “skinimalism” is pushing marula oil infusions to the forefront of modern skincare regimens.
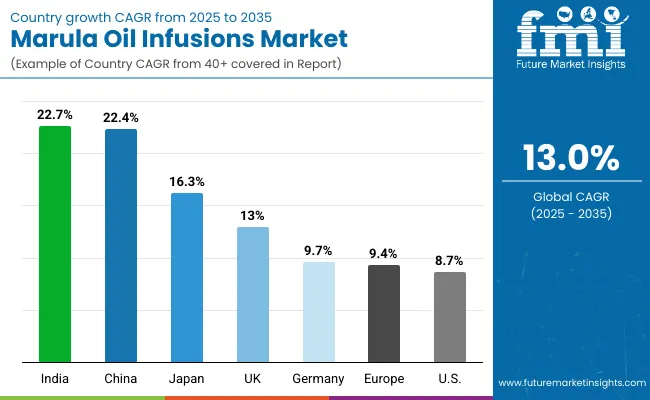
Analysis of Marula Oil Infusions Market By Key Countries

Country Wise Marula Oil Infusions Market

Countries Estimated CAGR (2025 2035)
China 22.4%
USA 8.7%
India 22.7%
UK 13.0%
Germany 9.7%
Japan 16.3%

The global Marula Oil Infusions Market shows clear regional variations in growth speed, shaped by consumer awareness, affordability, and adoption of natural skincare. Asia-Pacific emerges as the fastest-growing region, anchored by India (22.7% CAGR) and China (22.4% CAGR). India’s rapid growth reflects the rising preference for plant-based oils in Ayurvedic and modern skincare regimens, combined with expanding D2C beauty startups targeting tier-2 and tier-3 cities. China’s trajectory is supported by C-beauty innovation, social commerce platforms, and a strong shift toward vegan and natural-certified claims.

Japan (16.3% CAGR) stands out in Asia for its adoption of marula oil in clinical-grade anti-aging and brightening products, where consumer trust in dermatologist-tested skincare drives growth. In Europe, the UK (13.0% CAGR) shows strong adoption of vegan and sustainable beauty, while Germany (9.7% CAGR) remains steady due to its pharmacy-led skincare culture and strict organic certification standards. In North America, the USA (8.7% CAGR) shows moderate growth, reflecting a mature skincare market where marula oil infusions are gaining share through premium and clean-label product launches. Expansion is driven by e-commerce, subscription models, and specialty beauty stores, though growth rates trail behind Asia and Europe.
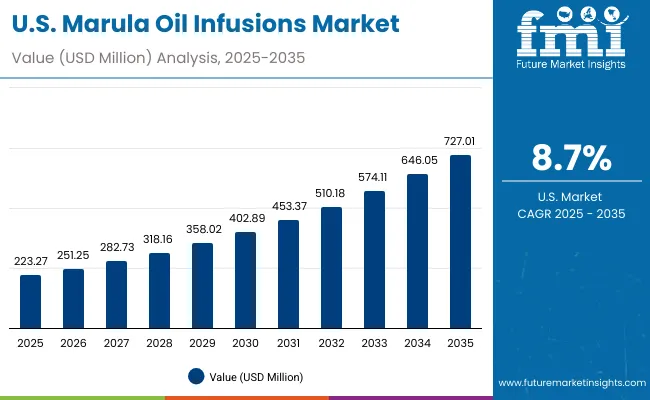
Sales Outlook for Marula Oil Infusions in the United States

Usa Marula Oil Infusions Market

Year USA Marula Oil Infusions Market (USD Million)
2025 223.27
2026 251.25
2027 282.73
2028 318.16
2029 358.02
2030 402.89
2031 453.37
2032 510.18
2033 574.11
2034 646.05
2035 727.01

The Marula Oil Infusions Market in the United States is projected to grow from USD 223.27 million in 2025 to USD 727.01 million by 2035, expanding at a CAGR of 12.5%. Growth is driven by rising demand for moisturizing and anti-aging formulations, which together dominate consumer preference. In 2025, moisturizing accounts for 56.7% of USA market value, supported by marula oil’s role as a natural, fast-absorbing hydrator.

The USA market is also witnessing a shift toward vegan and dermatologist-tested product claims, fueling adoption across both premium and pharmacy-led retail channels. E-commerce growth, subscription skincare models, and influencer-driven awareness are expanding reach, while premium brands emphasize sustainability and fair-trade sourcing of marula oil.

  • Moisturizing leads with 56.7% share in 2025, reflecting hydration-focused demand.
  • Serums and oils dominate adoption, with growing traction in creams and hybrid formats.
  • E-commerce and subscription beauty models are boosting consumer engagement and retention.

Growth and Expansion Outlook for Marula Oil Infusions Market in the United Kingdom

The Marula Oil Infusions Market in the United Kingdom is expected to grow at a CAGR of 13.0% from 2025 to 2035, supported by increasing consumer demand for vegan, clean-label, and sustainable skincare. British consumers are highly receptive to natural oils such as marula, especially in moisturizing and anti-aging formulations that align with the growing “skinimalism” trend.

Growth is further boosted by the strong presence of indie beauty brands and clean-beauty retailers that highlight transparency, ethical sourcing, and eco-friendly packaging. E-commerce platforms and pharmacies are rapidly expanding their marula oilbased portfolios, while premium retailers position it as a luxury natural ingredient. Sustainability-focused initiatives and consumer awareness campaigns continue to reinforce the adoption of marula oil infusions in both mass and premium categories.

  • Vegan and clean-label claims drive adoption across both mass and premium channels.
  • Indie brands and specialty retailers are popularizing marula oil serums and creams.
  • E-commerce and pharmacy distribution expand accessibility and consumer reach

Growth and Expansion Outlook for Marula Oil Infusions Market in India

India is witnessing rapid growth in the Marula Oil Infusions Market, forecast to expand at a CAGR of 22.7% through 2035the highest among leading countries. This expansion is fueled by rising demand for natural and plant-based skincare, where marula oil resonates with India’s strong Ayurveda-inspired beauty traditions. Consumers are increasingly adopting marula oilinfused products for moisturizing, anti-aging, and repair functions, especially as urban pollution and lifestyle stress accelerate skincare concerns.

Tier-2 and tier-3 cities are becoming growth hubs, as D2C startups and e-commerce platforms introduce affordable serums, creams, and oils infused with marula oil. Awareness campaigns, influencer marketing, and dermatologist endorsements are further accelerating adoption. The shift toward vegan and clean-label claims also appeals strongly to young urban consumers seeking transparency and ethical sourcing.

  • Ayurveda-aligned positioning enhances consumer trust in marula oil.
  • E-commerce and D2C startups drive accessibility beyond metro cities.
  • Vegan and clean-label claims resonate strongly with younger demographics.

Sales Outlook for Marula Oil Infusions in China

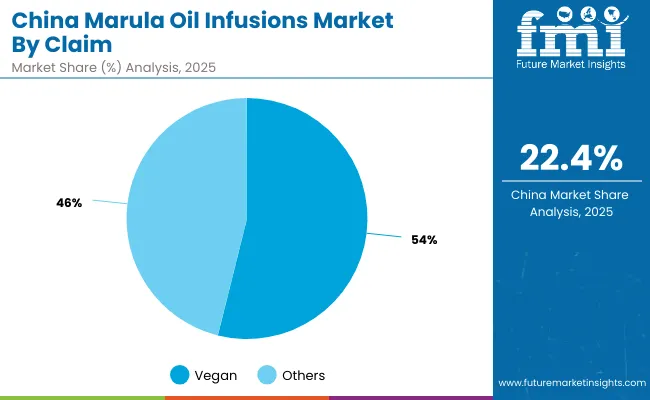
The Marula Oil Infusions Market in China is expected to grow at a CAGR of 22.4%, making it one of the fastest-expanding markets globally. Growth is driven by increasing consumer preference for vegan-certified and natural skincare, with vegan claims leading at 53.9% in 2025. Chinese consumers are particularly responsive to plant-based oils such as marula for hydration, anti-aging, and repair functions, supported by rising disposable incomes and urban lifestyle changes.

The momentum is further accelerated by the rise of C-beauty brands, competitive domestic pricing, and the expansion of social commerce platforms like Douyin and Little Red Book, which are central to skincare product discovery. Premium brands emphasize fair-trade sourcing and clean-label transparency to appeal to affluent urban buyers, while local startups offer accessible marula oil infusions to mass markets.
  • Vegan claims dominate at 53.9% of the market in 2025.
  • C-beauty brands and social commerce ecosystems are driving mass adoption.
  • Premium and affordable positioning together broaden reach across income groups.

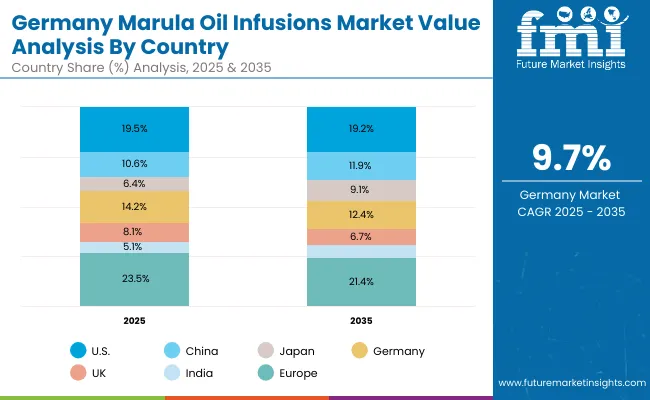
In-depth Analysis of Marula Oil Infusions in Germany

Europe Marula Oil Infusions Market

Countries 2025 Share (%)
USA 19.5%
China 10.6%
Japan 6.4%
Germany 14.2%
UK 8.1%
India 5.1%
Countries 2035 Share (%)
USA 19.2%
China 11.9%
Japan 9.1%
Germany 12.4%
UK 6.7%
India 5.7%

The Marula Oil Infusions Market in Germany is projected to grow at a CAGR of 9.7% through 2035, reflecting steady but moderate expansion compared to Asia-Pacific markets. Germany maintains one of the largest shares in Europe due to its pharmacy-led skincare culture and strong consumer preference for dermatologist-tested and organic-certified formulations. However, its global share is forecast to decline slightly from 14.2% in 2025 to 12.4% in 2035, as faster-growing Asian markets capture more value.

German consumers place high trust in natural oils backed by scientific validation, making marula oil particularly attractive for moisturizing and anti-aging applications. Pharmacies and specialty beauty stores dominate sales, while premium brands highlight eco-certifications and sustainable sourcing to align with EU standards. Clean-label and vegan claims also contribute to growth, though adoption is more cautious and evidence-driven compared to trend-driven Asian markets.
  • Pharmacy distribution plays a critical role in consumer adoption.
  • Organic and dermatologist-tested certifications are vital for brand credibility.
  • Moisturizing and anti-aging functions anchor marula oil demand in both premium and mass categories.

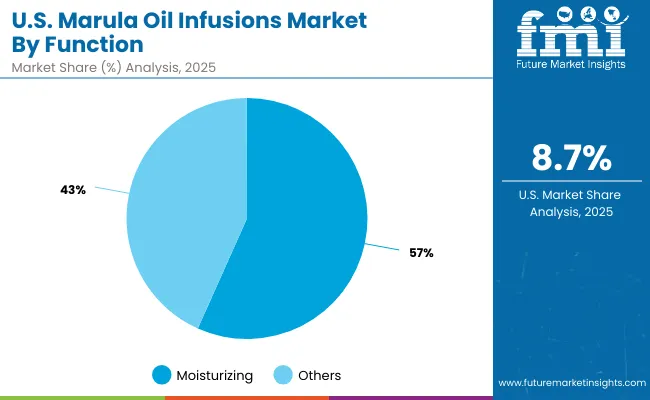
Growth Outlook for Marula Oil Infusions Market in USA

Usa Marula Oil Infusions Market By Function

USA by function Value Share% 2025
Moisturizing 56.7%
Others 43.3%

The Marula Oil Infusions Market in the United States is projected at USD 223.27 million in 2025, expanding to USD 727.01 million by 2035 at a CAGR of 12.5%. The market is strongly anchored by moisturizing applications, which lead with 56.7% share in 2025, as consumers prioritize hydration-focused products that support barrier repair and long-lasting softness.

American consumers are also driving growth in anti-aging and multi-functional serums, where marula oil’s antioxidant-rich composition is positioned against oxidative stress and early signs of aging. Growth is reinforced by the popularity of vegan and dermatologist-tested claims, e-commerce subscription models, and premium product launches by leading clean beauty brands.
  • Moisturizing dominates with 56.7% share, highlighting hydration as the core driver.
  • Serums and oils are expanding fastest due to concentrated benefits and versatility.
  • Vegan and dermatologist-tested positioning enhance trust and adoption across retail and digital channels.

Opportunity Analysis of China Marula Oil Infusions Market

China Marula Oil Infusions Market By Claim

China by Claim Value Share% 2025
Vegan 53.9%
Others 46.1%

The Marula Oil Infusions Market in China is projected to grow at a CAGR of 22.4%, supported by strong consumer adoption of vegan-certified skincare, which dominates at 53.9% in 2025. This reflects the rising importance of ethical and plant-based formulations, with marula oil gaining traction for its hydration, anti-aging, and skin repair benefits. Opportunities are amplified by C-beauty innovation and the rapid rise of social commerce platforms such as Douyin and Little Red Book, which play a key role in educating consumers and driving trial purchases. Affordable domestic offerings cater to mass-market buyers, while premium international brands focus on fair-trade sourcing and clean-label transparency to capture affluent consumers.
  • Vegan claims dominate at 53.9%, aligning with clean beauty demand.
  • Social commerce ecosystems accelerate awareness and adoption.
  • Premium and affordable positioning expand consumer reach across multiple income segments.

Competitive Landscape of Marula Oil Infusions Market

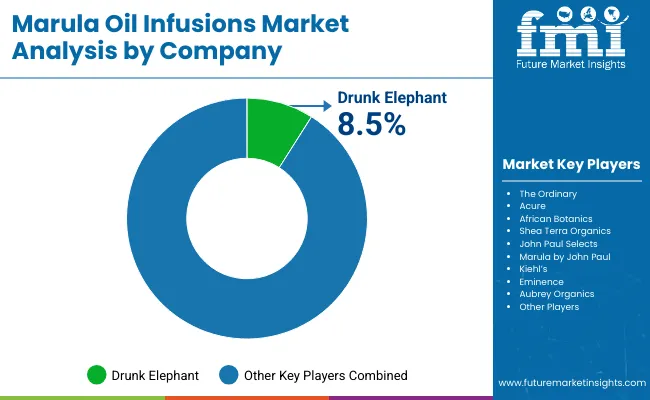
Marula Oil Infusions Market By Comapny

Comapny Global Value Share 2025
Drunk Elephant 8.5%
Others 91.5%

The Marula Oil Infusions Market is moderately fragmented, with global leaders, niche innovators, and clean-beauty specialists competing across both premium and mass skincare segments. Global leaders such as Drunk Elephant, Kiehl’s, and The Ordinary maintain strong positions through premium branding, dermatologist-tested claims, and extensive e-commerce presence. Their strategies emphasize marula oilinfused serums and oils, highlighting hydration, anti-aging, and clean-label positioning to secure loyal consumer bases in North America and Europe.

Mid-sized innovators including Acure, African Botanics, and Shea Terra Organics focus on fair-trade sourcing, natural formulations, and eco-conscious packaging. These brands appeal strongly to consumers seeking affordable yet ethical alternatives, particularly in North America and Asia-Pacific. Niche-focused players such as Eminence, Aubrey Organics, and John Paul Selects emphasize artisanal blends, organic certifications, and holistic skincare routines. Their adaptability to local consumer needs and targeted marketing allows them to retain presence despite limited global scale.

Competitive differentiation is shifting from brand heritage alone to a broader focus on sustainability credentials, transparency in sourcing, and direct-to-consumer engagement. Companies that integrate ethical sourcing stories, innovative product formats, and digital-first marketing are expected to strengthen their foothold in this growing market.

Key Developments in Marula Oil Infusions Market

  • 2024: The Ordinary and Acure expanded their clean beauty portfolios with marula oilinfused serums and facial oils, emphasizing vegan certification and sustainable packaging to attract younger, ethically conscious consumers.
  • 2025: Drunk Elephant strengthened its market leadership with an 8.5% global share, launching a new line of multi-functional marula oil creams and moisturizers that combine hydration, anti-aging, and repair benefits, supported by strong e-commerce campaigns in North America and Europe.

Scope of the Report

Item Value
Quantitative Units USD 1,052.8 Million
Function Moisturizing, Anti-aging, Brightening, Repair
Product Type Oils, Creams/lotions, Serums, Masks
Channel E-commerce, Pharmacies, Mass retail, Specialty beauty stores
Claim Vegan, Natural/organic, Clean-label, Dermatologist-tested
Regions Covered North America, Europe, Asia-Pacific, Latin America, Middle East & Africa
Country Covered United States, Canada, Germany, France, United Kingdom, China, Japan, India, Brazil, South Africa
Key Companies Profiled Drunk Elephant, The Ordinary, Acure, African Botanics, Shea Terra Organics, John Paul Selects, Marula by John Paul, Kiehl’s, Eminence, Aubrey Organics
Additional Attributes Dollar sales by scanner type and end-use industry, adoption trends in reverse engineering and quality control, rising demand for handheld and portable 3D scanners, sector-specific growth in aerospace, automotive, and healthcare, software and services revenue segmentation, integration with AR/VR and digital twin technologies, regional trends influenced by digitization initiatives, and innovations in laser triangulation, structured light, and photogrammetry methods.

Key Segments

By Function:

  • Moisturizing
  • Anti-aging
  • Brightening
  • Repair

By Product Type:

  • Serums
  • Oils
  • Creams/lotions
  • Masks

By Channel:

  • E-commerce
  • Pharmacies
  • Specialty beauty stores
  • Mass retail

By Claim:

  • Natural/organic
  • Dermatologist-tested
  • Vegan
  • Clean-label

By Region:

  • North America
  • Latin America
  • Europe
  • East Asia
  • South Asia & Pacific
  • Middle East and Africa

Table of Content

  1. Executive Summary
    • Global Market Outlook
    • Demand-side Trends
    • Supply-side Trends
    • Technology Roadmap Analysis
    • Analysis and Recommendations
  2. Market Overview
    • Market Coverage / Taxonomy
    • Market Definition / Scope / Limitations
  3. Market Background
    • Market Dynamics
      • Drivers
      • Restraints
      • Opportunity
      • Trends
    • Scenario Forecast
      • Demand in Optimistic Scenario
      • Demand in Likely Scenario
      • Demand in Conservative Scenario
    • Opportunity Map Analysis
    • Product Life Cycle Analysis
    • Supply Chain Analysis
      • Supply Side Participants and their Roles
        • Producers
        • Mid-Level Participants (Traders/ Agents/ Brokers)
        • Wholesalers and Distributors
      • Value Added and Value Created at Node in the Supply Chain
      • List of Raw Material Suppliers
      • List of Existing and Potential Buyer’s
    • Investment Feasibility Matrix
    • Value Chain Analysis
      • Profit Margin Analysis
      • Wholesalers and Distributors
      • Retailers
    • PESTLE and Porter’s Analysis
    • Regulatory Landscape
      • By Key Regions
      • By Key Countries
    • Regional Parent Market Outlook
    • Production and Consumption Statistics
    • Import and Export Statistics
  4. Global Market Analysis 2020 to 2024 and Forecast, 2025 to 2035
    • Historical Market Size Value (USD Million) & Volume (Units) Analysis, 2020 to 2024
    • Current and Future Market Size Value (USD Million) & Volume (Units) Projections, 2025 to 2035
      • Y-o-Y Growth Trend Analysis
      • Absolute $ Opportunity Analysis
  5. Global Market Analysis 2020 to 2024 and Forecast 2025 to 2035, By Function
    • Introduction / Key Findings
    • Historical Market Size Value (USD Million) & Volume (Units) Analysis By Function, 2020 to 2024
    • Current and Future Market Size Value (USD Million) & Volume (Units) Analysis and Forecast By Function, 2025 to 2035
      • Moisturizing
      • Anti-aging
      • Brightening
      • Repair
    • Y-o-Y Growth Trend Analysis By Function, 2020 to 2024
    • Absolute $ Opportunity Analysis By Function, 2025 to 2035
  6. Global Market Analysis 2020 to 2024 and Forecast 2025 to 2035, By Product Type
    • Introduction / Key Findings
    • Historical Market Size Value (USD Million) & Volume (Units) Analysis By Product Type, 2020 to 2024
    • Current and Future Market Size Value (USD Million) & Volume (Units) Analysis and Forecast By Product Type, 2025 to 2035
      • Serums
      • Oils
      • Creams/lotions
      • Masks
    • Y-o-Y Growth Trend Analysis By Product Type, 2020 to 2024
    • Absolute $ Opportunity Analysis By Product Type, 2025 to 2035
  7. Global Market Analysis 2020 to 2024 and Forecast 2025 to 2035, By Channel
    • Introduction / Key Findings
    • Historical Market Size Value (USD Million) & Volume (Units) Analysis By Channel, 2020 to 2024
    • Current and Future Market Size Value (USD Million) & Volume (Units) Analysis and Forecast By Channel, 2025 to 2035
      • E-commerce
      • Pharmacies
      • Specialty beauty stores
      • Mass retail
    • Y-o-Y Growth Trend Analysis By Channel, 2020 to 2024
    • Absolute $ Opportunity Analysis By Channel, 2025 to 2035
  8. Global Market Analysis 2020 to 2024 and Forecast 2025 to 2035, By Claim
    • Introduction / Key Findings
    • Historical Market Size Value (USD Million) & Volume (Units) Analysis By Claim, 2020 to 2024
    • Current and Future Market Size Value (USD Million) & Volume (Units) Analysis and Forecast By Claim, 2025 to 2035
      • Natural/organic
      • Dermatologist-tested
      • Vegan
      • Clean-label
    • Y-o-Y Growth Trend Analysis By Claim, 2020 to 2024
    • Absolute $ Opportunity Analysis By Claim, 2025 to 2035
  9. Global Market Analysis 2020 to 2024 and Forecast 2025 to 2035, By Region
    • Introduction
    • Historical Market Size Value (USD Million) & Volume (Units) Analysis By Region, 2020 to 2024
    • Current Market Size Value (USD Million) & Volume (Units) Analysis and Forecast By Region, 2025 to 2035
      • North America
      • Latin America
      • Europe
      • East Asia
      • South Asia & Pacific
      • Middle East and Africa
    • Market Attractiveness Analysis By Region
  10. North America Market Analysis 2020 to 2024 and Forecast 2025 to 2035, By Country
    • Historical Market Size Value (USD Million) & Volume (Units) Trend Analysis By Market Taxonomy, 2020 to 2024
    • Market Size Value (USD Million) & Volume (Units) Forecast By Market Taxonomy, 2025 to 2035
      • By Country
        • U.S.
        • Canada
      • By Function
      • By Product Type
      • By Channel
      • By Claim
    • Market Attractiveness Analysis
      • By Country
      • By Function
      • By Product Type
      • By Channel
      • By Claim
    • Key Takeaways
  11. Latin America Market Analysis 2020 to 2024 and Forecast 2025 to 2035, By Country
    • Historical Market Size Value (USD Million) & Volume (Units) Trend Analysis By Market Taxonomy, 2020 to 2024
    • Market Size Value (USD Million) & Volume (Units) Forecast By Market Taxonomy, 2025 to 2035
      • By Country
        • Brazil
        • Mexico
        • Colombia
        • Rest of Latin America
      • By Function
      • By Product Type
      • By Channel
      • By Claim
    • Market Attractiveness Analysis
      • By Country
      • By Function
      • By Product Type
      • By Channel
      • By Claim
    • Key Takeaways
  12. Europe Market Analysis 2020 to 2024 and Forecast 2025 to 2035, By Country
    • Historical Market Size Value (USD Million) & Volume (Units) Trend Analysis By Market Taxonomy, 2020 to 2024
    • Market Size Value (USD Million) & Volume (Units) Forecast By Market Taxonomy, 2025 to 2035
      • By Country
        • Germany
        • U.K.
        • France
        • Italy
        • Spain
        • Belgium
        • Netherlands
        • Nordic
        • Switzerland
        • Russia
        • Poland
        • Rest of Europe
      • By Function
      • By Product Type
      • By Channel
      • By Claim
    • Market Attractiveness Analysis
      • By Country
      • By Function
      • By Product Type
      • By Channel
      • By Claim
    • Key Takeaways
  13. East Asia Market Analysis 2020 to 2024 and Forecast 2025 to 2035, By Country
    • Historical Market Size Value (USD Million) & Volume (Units) Trend Analysis By Market Taxonomy, 2020 to 2024
    • Market Size Value (USD Million) & Volume (Units) Forecast By Market Taxonomy, 2025 to 2035
      • By Country
        • China
        • Japan
        • South Korea
      • By Function
      • By Product Type
      • By Channel
      • By Claim
    • Market Attractiveness Analysis
      • By Country
      • By Function
      • By Product Type
      • By Channel
      • By Claim
    • Key Takeaways
  14. South Asia & Pacific Market Analysis 2020 to 2024 and Forecast 2025 to 2035, By Country
    • Historical Market Size Value (USD Million) & Volume (Units) Trend Analysis By Market Taxonomy, 2020 to 2024
    • Market Size Value (USD Million) & Volume (Units) Forecast By Market Taxonomy, 2025 to 2035
      • By Country
        • India
        • Thailand
        • Malaysia
        • Indonesia
        • Singapore
        • Vietnam
        • Australia
        • New Zealand
        • Rest of South Asia
      • By Function
      • By Product Type
      • By Channel
      • By Claim
    • Market Attractiveness Analysis
      • By Country
      • By Function
      • By Product Type
      • By Channel
      • By Claim
    • Key Takeaways
  15. Middle East and Africa Market Analysis 2020 to 2024 and Forecast 2025 to 2035, By Country
    • Historical Market Size Value (USD Million) & Volume (Units) Trend Analysis By Market Taxonomy, 2020 to 2024
    • Market Size Value (USD Million) & Volume (Units) Forecast By Market Taxonomy, 2025 to 2035
      • By Country
        • Turkey
        • UAE
        • Saudi Arabia
        • Israel
        • Other GCC Countries
        • North Africa
        • South Africa
      • By Function
      • By Product Type
      • By Channel
      • By Claim
    • Market Attractiveness Analysis
      • By Country
      • By Function
      • By Product Type
      • By Channel
      • By Claim
    • Key Takeaways
  16. Key Countries Market Analysis
    • U.S.
      • Pricing Analysis
      • Market Share Analysis, 2024
        • By Function
        • By Product Type
        • By Channel
        • By Claim
    • Canada
      • Pricing Analysis
      • Market Share Analysis, 2024
        • By Function
        • By Product Type
        • By Channel
        • By Claim
    • Brazil
      • Pricing Analysis
      • Market Share Analysis, 2024
        • By Function
        • By Product Type
        • By Channel
        • By Claim
    • Mexico
      • Pricing Analysis
      • Market Share Analysis, 2024
        • By Function
        • By Product Type
        • By Channel
        • By Claim
    • Colombia
      • Pricing Analysis
      • Market Share Analysis, 2024
        • By Function
        • By Product Type
        • By Channel
        • By Claim
    • Germany
      • Pricing Analysis
      • Market Share Analysis, 2024
        • By Function
        • By Product Type
        • By Channel
        • By Claim
    • U.K.
      • Pricing Analysis
      • Market Share Analysis, 2024
        • By Function
        • By Product Type
        • By Channel
        • By Claim
    • France
      • Pricing Analysis
      • Market Share Analysis, 2024
        • By Function
        • By Product Type
        • By Channel
        • By Claim
    • Italy
      • Pricing Analysis
      • Market Share Analysis, 2024
        • By Function
        • By Product Type
        • By Channel
        • By Claim
    • Spain
      • Pricing Analysis
      • Market Share Analysis, 2024
        • By Function
        • By Product Type
        • By Channel
        • By Claim
    • Belgium
      • Pricing Analysis
      • Market Share Analysis, 2024
        • By Function
        • By Product Type
        • By Channel
        • By Claim
    • Netherlands
      • Pricing Analysis
      • Market Share Analysis, 2024
        • By Function
        • By Product Type
        • By Channel
        • By Claim
    • Nordic
      • Pricing Analysis
      • Market Share Analysis, 2024
        • By Function
        • By Product Type
        • By Channel
        • By Claim
    • Switzerland
      • Pricing Analysis
      • Market Share Analysis, 2024
        • By Function
        • By Product Type
        • By Channel
        • By Claim
    • Russia
      • Pricing Analysis
      • Market Share Analysis, 2024
        • By Function
        • By Product Type
        • By Channel
        • By Claim
    • Poland
      • Pricing Analysis
      • Market Share Analysis, 2024
        • By Function
        • By Product Type
        • By Channel
        • By Claim
    • China
      • Pricing Analysis
      • Market Share Analysis, 2024
        • By Function
        • By Product Type
        • By Channel
        • By Claim
    • Japan
      • Pricing Analysis
      • Market Share Analysis, 2024
        • By Function
        • By Product Type
        • By Channel
        • By Claim
    • South Korea
      • Pricing Analysis
      • Market Share Analysis, 2024
        • By Function
        • By Product Type
        • By Channel
        • By Claim
    • India
      • Pricing Analysis
      • Market Share Analysis, 2024
        • By Function
        • By Product Type
        • By Channel
        • By Claim
    • Thailand
      • Pricing Analysis
      • Market Share Analysis, 2024
        • By Function
        • By Product Type
        • By Channel
        • By Claim
    • Indonesia
      • Pricing Analysis
      • Market Share Analysis, 2024
        • By Function
        • By Product Type
        • By Channel
        • By Claim
    • Australia
      • Pricing Analysis
      • Market Share Analysis, 2024
        • By Function
        • By Product Type
        • By Channel
        • By Claim
    • New Zealand
      • Pricing Analysis
      • Market Share Analysis, 2024
        • By Function
        • By Product Type
        • By Channel
        • By Claim
    • Turkey
      • Pricing Analysis
      • Market Share Analysis, 2024
        • By Function
        • By Product Type
        • By Channel
        • By Claim
    • UAE
      • Pricing Analysis
      • Market Share Analysis, 2024
        • By Function
        • By Product Type
        • By Channel
        • By Claim
    • Saudi Arabia
      • Pricing Analysis
      • Market Share Analysis, 2024
        • By Function
        • By Product Type
        • By Channel
        • By Claim
    • Israel
      • Pricing Analysis
      • Market Share Analysis, 2024
        • By Function
        • By Product Type
        • By Channel
        • By Claim
    • North Africa
      • Pricing Analysis
      • Market Share Analysis, 2024
        • By Function
        • By Product Type
        • By Channel
        • By Claim
    • South Africa
      • Pricing Analysis
      • Market Share Analysis, 2024
        • By Function
        • By Product Type
        • By Channel
        • By Claim
  17. Market Structure Analysis
    • Competition Dashboard
    • Competition Benchmarking
    • Market Share Analysis of Top Players
      • By Regional
      • By Function
      • By Product Type
      • By Channel
      • By Claim
  18. Competition Analysis
    • Competition Deep Dive
      • Drunk Elephant
        • Overview
        • Product Portfolio
        • Profitability by Market Segments (Product/Age /Sales Channel/Region)
        • Sales Footprint
        • Strategy Overview
          • Marketing Strategy
          • Product Strategy
          • Channel Strategy
      • The Ordinary
        • Overview
        • Product Portfolio
        • Profitability by Market Segments (Product/Age /Sales Channel/Region)
        • Sales Footprint
        • Strategy Overview
          • Marketing Strategy
          • Product Strategy
          • Channel Strategy
      • Acure
        • Overview
        • Product Portfolio
        • Profitability by Market Segments (Product/Age /Sales Channel/Region)
        • Sales Footprint
        • Strategy Overview
          • Marketing Strategy
          • Product Strategy
          • Channel Strategy
      • African Botanics
        • Overview
        • Product Portfolio
        • Profitability by Market Segments (Product/Age /Sales Channel/Region)
        • Sales Footprint
        • Strategy Overview
          • Marketing Strategy
          • Product Strategy
          • Channel Strategy
      • Shea Terra Organics
        • Overview
        • Product Portfolio
        • Profitability by Market Segments (Product/Age /Sales Channel/Region)
        • Sales Footprint
        • Strategy Overview
          • Marketing Strategy
          • Product Strategy
          • Channel Strategy
      • John Paul Selects
        • Overview
        • Product Portfolio
        • Profitability by Market Segments (Product/Age /Sales Channel/Region)
        • Sales Footprint
        • Strategy Overview
          • Marketing Strategy
          • Product Strategy
          • Channel Strategy
      • Marula by John Paul
        • Overview
        • Product Portfolio
        • Profitability by Market Segments (Product/Age /Sales Channel/Region)
        • Sales Footprint
        • Strategy Overview
          • Marketing Strategy
          • Product Strategy
          • Channel Strategy
      • Kiehl’s
        • Overview
        • Product Portfolio
        • Profitability by Market Segments (Product/Age /Sales Channel/Region)
        • Sales Footprint
        • Strategy Overview
          • Marketing Strategy
          • Product Strategy
          • Channel Strategy
      • Eminence
        • Overview
        • Product Portfolio
        • Profitability by Market Segments (Product/Age /Sales Channel/Region)
        • Sales Footprint
        • Strategy Overview
          • Marketing Strategy
          • Product Strategy
          • Channel Strategy
      • Aubrey Organics
        • Overview
        • Product Portfolio
        • Profitability by Market Segments (Product/Age /Sales Channel/Region)
        • Sales Footprint
        • Strategy Overview
          • Marketing Strategy
          • Product Strategy
          • Channel Strategy
      • Others
        • Overview
        • Product Portfolio
        • Profitability by Market Segments (Product/Age /Sales Channel/Region)
        • Sales Footprint
        • Strategy Overview
          • Marketing Strategy
          • Product Strategy
          • Channel Strategy
  19. Assumptions & Acronyms Used
  20. Research Methodology

List of Tables

  • Table 1: Global Market Value (USD Million) Forecast by Region, 2020-2035
  • Table 2: Global Market Volume (Units) Forecast by Region, 2020-2035
  • Table 3: Global Market Value (USD Million) Forecast by Function, 2020-2035
  • Table 4: Global Market Volume (Units) Forecast by Function, 2020-2035
  • Table 5: Global Market Value (USD Million) Forecast by Product Type, 2020-2035
  • Table 6: Global Market Volume (Units) Forecast by Product Type, 2020-2035
  • Table 7: Global Market Value (USD Million) Forecast by Channel, 2020-2035
  • Table 8: Global Market Volume (Units) Forecast by Channel, 2020-2035
  • Table 9: Global Market Value (USD Million) Forecast by Claim, 2020-2035
  • Table 10: Global Market Volume (Units) Forecast by Claim, 2020-2035
  • Table 11: North America Market Value (USD Million) Forecast by Country, 2020-2035
  • Table 12: North America Market Volume (Units) Forecast by Country, 2020-2035
  • Table 13: North America Market Value (USD Million) Forecast by Function, 2020-2035
  • Table 14: North America Market Volume (Units) Forecast by Function, 2020-2035
  • Table 15: North America Market Value (USD Million) Forecast by Product Type, 2020-2035
  • Table 16: North America Market Volume (Units) Forecast by Product Type, 2020-2035
  • Table 17: North America Market Value (USD Million) Forecast by Channel, 2020-2035
  • Table 18: North America Market Volume (Units) Forecast by Channel, 2020-2035
  • Table 19: North America Market Value (USD Million) Forecast by Claim, 2020-2035
  • Table 20: North America Market Volume (Units) Forecast by Claim, 2020-2035
  • Table 21: Latin America Market Value (USD Million) Forecast by Country, 2020-2035
  • Table 22: Latin America Market Volume (Units) Forecast by Country, 2020-2035
  • Table 23: Latin America Market Value (USD Million) Forecast by Function, 2020-2035
  • Table 24: Latin America Market Volume (Units) Forecast by Function, 2020-2035
  • Table 25: Latin America Market Value (USD Million) Forecast by Product Type, 2020-2035
  • Table 26: Latin America Market Volume (Units) Forecast by Product Type, 2020-2035
  • Table 27: Latin America Market Value (USD Million) Forecast by Channel, 2020-2035
  • Table 28: Latin America Market Volume (Units) Forecast by Channel, 2020-2035
  • Table 29: Latin America Market Value (USD Million) Forecast by Claim, 2020-2035
  • Table 30: Latin America Market Volume (Units) Forecast by Claim, 2020-2035
  • Table 31: Europe Market Value (USD Million) Forecast by Country, 2020-2035
  • Table 32: Europe Market Volume (Units) Forecast by Country, 2020-2035
  • Table 33: Europe Market Value (USD Million) Forecast by Function, 2020-2035
  • Table 34: Europe Market Volume (Units) Forecast by Function, 2020-2035
  • Table 35: Europe Market Value (USD Million) Forecast by Product Type, 2020-2035
  • Table 36: Europe Market Volume (Units) Forecast by Product Type, 2020-2035
  • Table 37: Europe Market Value (USD Million) Forecast by Channel, 2020-2035
  • Table 38: Europe Market Volume (Units) Forecast by Channel, 2020-2035
  • Table 39: Europe Market Value (USD Million) Forecast by Claim, 2020-2035
  • Table 40: Europe Market Volume (Units) Forecast by Claim, 2020-2035
  • Table 41: East Asia Market Value (USD Million) Forecast by Country, 2020-2035
  • Table 42: East Asia Market Volume (Units) Forecast by Country, 2020-2035
  • Table 43: East Asia Market Value (USD Million) Forecast by Function, 2020-2035
  • Table 44: East Asia Market Volume (Units) Forecast by Function, 2020-2035
  • Table 45: East Asia Market Value (USD Million) Forecast by Product Type, 2020-2035
  • Table 46: East Asia Market Volume (Units) Forecast by Product Type, 2020-2035
  • Table 47: East Asia Market Value (USD Million) Forecast by Channel, 2020-2035
  • Table 48: East Asia Market Volume (Units) Forecast by Channel, 2020-2035
  • Table 49: East Asia Market Value (USD Million) Forecast by Claim, 2020-2035
  • Table 50: East Asia Market Volume (Units) Forecast by Claim, 2020-2035
  • Table 51: South Asia & Pacific Market Value (USD Million) Forecast by Country, 2020-2035
  • Table 52: South Asia & Pacific Market Volume (Units) Forecast by Country, 2020-2035
  • Table 53: South Asia & Pacific Market Value (USD Million) Forecast by Function, 2020-2035
  • Table 54: South Asia & Pacific Market Volume (Units) Forecast by Function, 2020-2035
  • Table 55: South Asia & Pacific Market Value (USD Million) Forecast by Product Type, 2020-2035
  • Table 56: South Asia & Pacific Market Volume (Units) Forecast by Product Type, 2020-2035
  • Table 57: South Asia & Pacific Market Value (USD Million) Forecast by Channel, 2020-2035
  • Table 58: South Asia & Pacific Market Volume (Units) Forecast by Channel, 2020-2035
  • Table 59: South Asia & Pacific Market Value (USD Million) Forecast by Claim, 2020-2035
  • Table 60: South Asia & Pacific Market Volume (Units) Forecast by Claim, 2020-2035
  • Table 61: Middle East and Africa Market Value (USD Million) Forecast by Country, 2020-2035
  • Table 62: Middle East and Africa Market Volume (Units) Forecast by Country, 2020-2035
  • Table 63: Middle East and Africa Market Value (USD Million) Forecast by Function, 2020-2035
  • Table 64: Middle East and Africa Market Volume (Units) Forecast by Function, 2020-2035
  • Table 65: Middle East and Africa Market Value (USD Million) Forecast by Product Type, 2020-2035
  • Table 66: Middle East and Africa Market Volume (Units) Forecast by Product Type, 2020-2035
  • Table 67: Middle East and Africa Market Value (USD Million) Forecast by Channel, 2020-2035
  • Table 68: Middle East and Africa Market Volume (Units) Forecast by Channel, 2020-2035
  • Table 69: Middle East and Africa Market Value (USD Million) Forecast by Claim, 2020-2035
  • Table 70: Middle East and Africa Market Volume (Units) Forecast by Claim, 2020-2035

List of Figures

  • Figure 1: Global Market Value (USD Million) by Function, 2025-2035
  • Figure 2: Global Market Value (USD Million) by Product Type, 2025-2035
  • Figure 3: Global Market Value (USD Million) by Channel, 2025-2035
  • Figure 4: Global Market Value (USD Million) by Claim, 2025-2035
  • Figure 5: Global Market Value (USD Million) by Region, 2025-2035
  • Figure 6: Global Market Value (USD Million) Analysis by Region, 2020-2035
  • Figure 7: Global Market Volume (Units) Analysis by Region, 2020-2035
  • Figure 8: Global Market Value Share (%) and BPS Analysis by Region, 2025-2035
  • Figure 9: Global Market Y-o-Y Growth (%) Projections by Region, 2025-2035
  • Figure 10: Global Market Value (USD Million) Analysis by Function, 2020-2035
  • Figure 11: Global Market Volume (Units) Analysis by Function, 2020-2035
  • Figure 12: Global Market Value Share (%) and BPS Analysis by Function, 2025-2035
  • Figure 13: Global Market Y-o-Y Growth (%) Projections by Function, 2025-2035
  • Figure 14: Global Market Value (USD Million) Analysis by Product Type, 2020-2035
  • Figure 15: Global Market Volume (Units) Analysis by Product Type, 2020-2035
  • Figure 16: Global Market Value Share (%) and BPS Analysis by Product Type, 2025-2035
  • Figure 17: Global Market Y-o-Y Growth (%) Projections by Product Type, 2025-2035
  • Figure 18: Global Market Value (USD Million) Analysis by Channel, 2020-2035
  • Figure 19: Global Market Volume (Units) Analysis by Channel, 2020-2035
  • Figure 20: Global Market Value Share (%) and BPS Analysis by Channel, 2025-2035
  • Figure 21: Global Market Y-o-Y Growth (%) Projections by Channel, 2025-2035
  • Figure 22: Global Market Value (USD Million) Analysis by Claim, 2020-2035
  • Figure 23: Global Market Volume (Units) Analysis by Claim, 2020-2035
  • Figure 24: Global Market Value Share (%) and BPS Analysis by Claim, 2025-2035
  • Figure 25: Global Market Y-o-Y Growth (%) Projections by Claim, 2025-2035
  • Figure 26: Global Market Attractiveness by Function, 2025-2035
  • Figure 27: Global Market Attractiveness by Product Type, 2025-2035
  • Figure 28: Global Market Attractiveness by Channel, 2025-2035
  • Figure 29: Global Market Attractiveness by Claim, 2025-2035
  • Figure 30: Global Market Attractiveness by Region, 2025-2035
  • Figure 31: North America Market Value (USD Million) by Function, 2025-2035
  • Figure 32: North America Market Value (USD Million) by Product Type, 2025-2035
  • Figure 33: North America Market Value (USD Million) by Channel, 2025-2035
  • Figure 34: North America Market Value (USD Million) by Claim, 2025-2035
  • Figure 35: North America Market Value (USD Million) by Country, 2025-2035
  • Figure 36: North America Market Value (USD Million) Analysis by Country, 2020-2035
  • Figure 37: North America Market Volume (Units) Analysis by Country, 2020-2035
  • Figure 38: North America Market Value Share (%) and BPS Analysis by Country, 2025-2035
  • Figure 39: North America Market Y-o-Y Growth (%) Projections by Country, 2025-2035
  • Figure 40: North America Market Value (USD Million) Analysis by Function, 2020-2035
  • Figure 41: North America Market Volume (Units) Analysis by Function, 2020-2035
  • Figure 42: North America Market Value Share (%) and BPS Analysis by Function, 2025-2035
  • Figure 43: North America Market Y-o-Y Growth (%) Projections by Function, 2025-2035
  • Figure 44: North America Market Value (USD Million) Analysis by Product Type, 2020-2035
  • Figure 45: North America Market Volume (Units) Analysis by Product Type, 2020-2035
  • Figure 46: North America Market Value Share (%) and BPS Analysis by Product Type, 2025-2035
  • Figure 47: North America Market Y-o-Y Growth (%) Projections by Product Type, 2025-2035
  • Figure 48: North America Market Value (USD Million) Analysis by Channel, 2020-2035
  • Figure 49: North America Market Volume (Units) Analysis by Channel, 2020-2035
  • Figure 50: North America Market Value Share (%) and BPS Analysis by Channel, 2025-2035
  • Figure 51: North America Market Y-o-Y Growth (%) Projections by Channel, 2025-2035
  • Figure 52: North America Market Value (USD Million) Analysis by Claim, 2020-2035
  • Figure 53: North America Market Volume (Units) Analysis by Claim, 2020-2035
  • Figure 54: North America Market Value Share (%) and BPS Analysis by Claim, 2025-2035
  • Figure 55: North America Market Y-o-Y Growth (%) Projections by Claim, 2025-2035
  • Figure 56: North America Market Attractiveness by Function, 2025-2035
  • Figure 57: North America Market Attractiveness by Product Type, 2025-2035
  • Figure 58: North America Market Attractiveness by Channel, 2025-2035
  • Figure 59: North America Market Attractiveness by Claim, 2025-2035
  • Figure 60: North America Market Attractiveness by Country, 2025-2035
  • Figure 61: Latin America Market Value (USD Million) by Function, 2025-2035
  • Figure 62: Latin America Market Value (USD Million) by Product Type, 2025-2035
  • Figure 63: Latin America Market Value (USD Million) by Channel, 2025-2035
  • Figure 64: Latin America Market Value (USD Million) by Claim, 2025-2035
  • Figure 65: Latin America Market Value (USD Million) by Country, 2025-2035
  • Figure 66: Latin America Market Value (USD Million) Analysis by Country, 2020-2035
  • Figure 67: Latin America Market Volume (Units) Analysis by Country, 2020-2035
  • Figure 68: Latin America Market Value Share (%) and BPS Analysis by Country, 2025-2035
  • Figure 69: Latin America Market Y-o-Y Growth (%) Projections by Country, 2025-2035
  • Figure 70: Latin America Market Value (USD Million) Analysis by Function, 2020-2035
  • Figure 71: Latin America Market Volume (Units) Analysis by Function, 2020-2035
  • Figure 72: Latin America Market Value Share (%) and BPS Analysis by Function, 2025-2035
  • Figure 73: Latin America Market Y-o-Y Growth (%) Projections by Function, 2025-2035
  • Figure 74: Latin America Market Value (USD Million) Analysis by Product Type, 2020-2035
  • Figure 75: Latin America Market Volume (Units) Analysis by Product Type, 2020-2035
  • Figure 76: Latin America Market Value Share (%) and BPS Analysis by Product Type, 2025-2035
  • Figure 77: Latin America Market Y-o-Y Growth (%) Projections by Product Type, 2025-2035
  • Figure 78: Latin America Market Value (USD Million) Analysis by Channel, 2020-2035
  • Figure 79: Latin America Market Volume (Units) Analysis by Channel, 2020-2035
  • Figure 80: Latin America Market Value Share (%) and BPS Analysis by Channel, 2025-2035
  • Figure 81: Latin America Market Y-o-Y Growth (%) Projections by Channel, 2025-2035
  • Figure 82: Latin America Market Value (USD Million) Analysis by Claim, 2020-2035
  • Figure 83: Latin America Market Volume (Units) Analysis by Claim, 2020-2035
  • Figure 84: Latin America Market Value Share (%) and BPS Analysis by Claim, 2025-2035
  • Figure 85: Latin America Market Y-o-Y Growth (%) Projections by Claim, 2025-2035
  • Figure 86: Latin America Market Attractiveness by Function, 2025-2035
  • Figure 87: Latin America Market Attractiveness by Product Type, 2025-2035
  • Figure 88: Latin America Market Attractiveness by Channel, 2025-2035
  • Figure 89: Latin America Market Attractiveness by Claim, 2025-2035
  • Figure 90: Latin America Market Attractiveness by Country, 2025-2035
  • Figure 91: Europe Market Value (USD Million) by Function, 2025-2035
  • Figure 92: Europe Market Value (USD Million) by Product Type, 2025-2035
  • Figure 93: Europe Market Value (USD Million) by Channel, 2025-2035
  • Figure 94: Europe Market Value (USD Million) by Claim, 2025-2035
  • Figure 95: Europe Market Value (USD Million) by Country, 2025-2035
  • Figure 96: Europe Market Value (USD Million) Analysis by Country, 2020-2035
  • Figure 97: Europe Market Volume (Units) Analysis by Country, 2020-2035
  • Figure 98: Europe Market Value Share (%) and BPS Analysis by Country, 2025-2035
  • Figure 99: Europe Market Y-o-Y Growth (%) Projections by Country, 2025-2035
  • Figure 100: Europe Market Value (USD Million) Analysis by Function, 2020-2035
  • Figure 101: Europe Market Volume (Units) Analysis by Function, 2020-2035
  • Figure 102: Europe Market Value Share (%) and BPS Analysis by Function, 2025-2035
  • Figure 103: Europe Market Y-o-Y Growth (%) Projections by Function, 2025-2035
  • Figure 104: Europe Market Value (USD Million) Analysis by Product Type, 2020-2035
  • Figure 105: Europe Market Volume (Units) Analysis by Product Type, 2020-2035
  • Figure 106: Europe Market Value Share (%) and BPS Analysis by Product Type, 2025-2035
  • Figure 107: Europe Market Y-o-Y Growth (%) Projections by Product Type, 2025-2035
  • Figure 108: Europe Market Value (USD Million) Analysis by Channel, 2020-2035
  • Figure 109: Europe Market Volume (Units) Analysis by Channel, 2020-2035
  • Figure 110: Europe Market Value Share (%) and BPS Analysis by Channel, 2025-2035
  • Figure 111: Europe Market Y-o-Y Growth (%) Projections by Channel, 2025-2035
  • Figure 112: Europe Market Value (USD Million) Analysis by Claim, 2020-2035
  • Figure 113: Europe Market Volume (Units) Analysis by Claim, 2020-2035
  • Figure 114: Europe Market Value Share (%) and BPS Analysis by Claim, 2025-2035
  • Figure 115: Europe Market Y-o-Y Growth (%) Projections by Claim, 2025-2035
  • Figure 116: Europe Market Attractiveness by Function, 2025-2035
  • Figure 117: Europe Market Attractiveness by Product Type, 2025-2035
  • Figure 118: Europe Market Attractiveness by Channel, 2025-2035
  • Figure 119: Europe Market Attractiveness by Claim, 2025-2035
  • Figure 120: Europe Market Attractiveness by Country, 2025-2035
  • Figure 121: East Asia Market Value (USD Million) by Function, 2025-2035
  • Figure 122: East Asia Market Value (USD Million) by Product Type, 2025-2035
  • Figure 123: East Asia Market Value (USD Million) by Channel, 2025-2035
  • Figure 124: East Asia Market Value (USD Million) by Claim, 2025-2035
  • Figure 125: East Asia Market Value (USD Million) by Country, 2025-2035
  • Figure 126: East Asia Market Value (USD Million) Analysis by Country, 2020-2035
  • Figure 127: East Asia Market Volume (Units) Analysis by Country, 2020-2035
  • Figure 128: East Asia Market Value Share (%) and BPS Analysis by Country, 2025-2035
  • Figure 129: East Asia Market Y-o-Y Growth (%) Projections by Country, 2025-2035
  • Figure 130: East Asia Market Value (USD Million) Analysis by Function, 2020-2035
  • Figure 131: East Asia Market Volume (Units) Analysis by Function, 2020-2035
  • Figure 132: East Asia Market Value Share (%) and BPS Analysis by Function, 2025-2035
  • Figure 133: East Asia Market Y-o-Y Growth (%) Projections by Function, 2025-2035
  • Figure 134: East Asia Market Value (USD Million) Analysis by Product Type, 2020-2035
  • Figure 135: East Asia Market Volume (Units) Analysis by Product Type, 2020-2035
  • Figure 136: East Asia Market Value Share (%) and BPS Analysis by Product Type, 2025-2035
  • Figure 137: East Asia Market Y-o-Y Growth (%) Projections by Product Type, 2025-2035
  • Figure 138: East Asia Market Value (USD Million) Analysis by Channel, 2020-2035
  • Figure 139: East Asia Market Volume (Units) Analysis by Channel, 2020-2035
  • Figure 140: East Asia Market Value Share (%) and BPS Analysis by Channel, 2025-2035
  • Figure 141: East Asia Market Y-o-Y Growth (%) Projections by Channel, 2025-2035
  • Figure 142: East Asia Market Value (USD Million) Analysis by Claim, 2020-2035
  • Figure 143: East Asia Market Volume (Units) Analysis by Claim, 2020-2035
  • Figure 144: East Asia Market Value Share (%) and BPS Analysis by Claim, 2025-2035
  • Figure 145: East Asia Market Y-o-Y Growth (%) Projections by Claim, 2025-2035
  • Figure 146: East Asia Market Attractiveness by Function, 2025-2035
  • Figure 147: East Asia Market Attractiveness by Product Type, 2025-2035
  • Figure 148: East Asia Market Attractiveness by Channel, 2025-2035
  • Figure 149: East Asia Market Attractiveness by Claim, 2025-2035
  • Figure 150: East Asia Market Attractiveness by Country, 2025-2035
  • Figure 151: South Asia & Pacific Market Value (USD Million) by Function, 2025-2035
  • Figure 152: South Asia & Pacific Market Value (USD Million) by Product Type, 2025-2035
  • Figure 153: South Asia & Pacific Market Value (USD Million) by Channel, 2025-2035
  • Figure 154: South Asia & Pacific Market Value (USD Million) by Claim, 2025-2035
  • Figure 155: South Asia & Pacific Market Value (USD Million) by Country, 2025-2035
  • Figure 156: South Asia & Pacific Market Value (USD Million) Analysis by Country, 2020-2035
  • Figure 157: South Asia & Pacific Market Volume (Units) Analysis by Country, 2020-2035
  • Figure 158: South Asia & Pacific Market Value Share (%) and BPS Analysis by Country, 2025-2035
  • Figure 159: South Asia & Pacific Market Y-o-Y Growth (%) Projections by Country, 2025-2035
  • Figure 160: South Asia & Pacific Market Value (USD Million) Analysis by Function, 2020-2035
  • Figure 161: South Asia & Pacific Market Volume (Units) Analysis by Function, 2020-2035
  • Figure 162: South Asia & Pacific Market Value Share (%) and BPS Analysis by Function, 2025-2035
  • Figure 163: South Asia & Pacific Market Y-o-Y Growth (%) Projections by Function, 2025-2035
  • Figure 164: South Asia & Pacific Market Value (USD Million) Analysis by Product Type, 2020-2035
  • Figure 165: South Asia & Pacific Market Volume (Units) Analysis by Product Type, 2020-2035
  • Figure 166: South Asia & Pacific Market Value Share (%) and BPS Analysis by Product Type, 2025-2035
  • Figure 167: South Asia & Pacific Market Y-o-Y Growth (%) Projections by Product Type, 2025-2035
  • Figure 168: South Asia & Pacific Market Value (USD Million) Analysis by Channel, 2020-2035
  • Figure 169: South Asia & Pacific Market Volume (Units) Analysis by Channel, 2020-2035
  • Figure 170: South Asia & Pacific Market Value Share (%) and BPS Analysis by Channel, 2025-2035
  • Figure 171: South Asia & Pacific Market Y-o-Y Growth (%) Projections by Channel, 2025-2035
  • Figure 172: South Asia & Pacific Market Value (USD Million) Analysis by Claim, 2020-2035
  • Figure 173: South Asia & Pacific Market Volume (Units) Analysis by Claim, 2020-2035
  • Figure 174: South Asia & Pacific Market Value Share (%) and BPS Analysis by Claim, 2025-2035
  • Figure 175: South Asia & Pacific Market Y-o-Y Growth (%) Projections by Claim, 2025-2035
  • Figure 176: South Asia & Pacific Market Attractiveness by Function, 2025-2035
  • Figure 177: South Asia & Pacific Market Attractiveness by Product Type, 2025-2035
  • Figure 178: South Asia & Pacific Market Attractiveness by Channel, 2025-2035
  • Figure 179: South Asia & Pacific Market Attractiveness by Claim, 2025-2035
  • Figure 180: South Asia & Pacific Market Attractiveness by Country, 2025-2035
  • Figure 181: Middle East and Africa Market Value (USD Million) by Function, 2025-2035
  • Figure 182: Middle East and Africa Market Value (USD Million) by Product Type, 2025-2035
  • Figure 183: Middle East and Africa Market Value (USD Million) by Channel, 2025-2035
  • Figure 184: Middle East and Africa Market Value (USD Million) by Claim, 2025-2035
  • Figure 185: Middle East and Africa Market Value (USD Million) by Country, 2025-2035
  • Figure 186: Middle East and Africa Market Value (USD Million) Analysis by Country, 2020-2035
  • Figure 187: Middle East and Africa Market Volume (Units) Analysis by Country, 2020-2035
  • Figure 188: Middle East and Africa Market Value Share (%) and BPS Analysis by Country, 2025-2035
  • Figure 189: Middle East and Africa Market Y-o-Y Growth (%) Projections by Country, 2025-2035
  • Figure 190: Middle East and Africa Market Value (USD Million) Analysis by Function, 2020-2035
  • Figure 191: Middle East and Africa Market Volume (Units) Analysis by Function, 2020-2035
  • Figure 192: Middle East and Africa Market Value Share (%) and BPS Analysis by Function, 2025-2035
  • Figure 193: Middle East and Africa Market Y-o-Y Growth (%) Projections by Function, 2025-2035
  • Figure 194: Middle East and Africa Market Value (USD Million) Analysis by Product Type, 2020-2035
  • Figure 195: Middle East and Africa Market Volume (Units) Analysis by Product Type, 2020-2035
  • Figure 196: Middle East and Africa Market Value Share (%) and BPS Analysis by Product Type, 2025-2035
  • Figure 197: Middle East and Africa Market Y-o-Y Growth (%) Projections by Product Type, 2025-2035
  • Figure 198: Middle East and Africa Market Value (USD Million) Analysis by Channel, 2020-2035
  • Figure 199: Middle East and Africa Market Volume (Units) Analysis by Channel, 2020-2035
  • Figure 200: Middle East and Africa Market Value Share (%) and BPS Analysis by Channel, 2025-2035
  • Figure 201: Middle East and Africa Market Y-o-Y Growth (%) Projections by Channel, 2025-2035
  • Figure 202: Middle East and Africa Market Value (USD Million) Analysis by Claim, 2020-2035
  • Figure 203: Middle East and Africa Market Volume (Units) Analysis by Claim, 2020-2035
  • Figure 204: Middle East and Africa Market Value Share (%) and BPS Analysis by Claim, 2025-2035
  • Figure 205: Middle East and Africa Market Y-o-Y Growth (%) Projections by Claim, 2025-2035
  • Figure 206: Middle East and Africa Market Attractiveness by Function, 2025-2035
  • Figure 207: Middle East and Africa Market Attractiveness by Product Type, 2025-2035
  • Figure 208: Middle East and Africa Market Attractiveness by Channel, 2025-2035
  • Figure 209: Middle East and Africa Market Attractiveness by Claim, 2025-2035
  • Figure 210: Middle East and Africa Market Attractiveness by Country, 2025-2035

Frequently Asked Questions

How big is the Marula Oil Infusions Market in 2025?

The global Marula Oil Infusions Market is estimated to be valued at USD 1,052.8 million in 2025.

What will be the size of Marula Oil Infusions Market in 2035?

The market size for the Marula Oil Infusions Market is projected to reach USD 3,562.7 million by 2035.

How much will be the Marula Oil Infusions Market growth between 2025 and 2035?

The Marula Oil Infusions Market is expected to grow at a 13.0% CAGR between 2025 and 2035.

What are the key product types in the Marula Oil Infusions Market?

The key product types in the Marula Oil Infusions Market are Oils, Creams/lotions, Serums, and Masks, with oils holding the leading share at 50.5% in 2025, followed closely by creams/lotions and serums as emerging formats for targeted skincare.

Which claim segment will contribute significant share in the Marula Oil Infusions Market in 2025?

In terms of claims, the Vegan segment is projected to command 53.9% share in 2025 in the China market, making it a significant growth driver globally. Overall, vegan and natural/organic claims are expected to lead adoption across all product types.

Explore Similar Insights

Future Market Insights

Marula Oil Infusions Market

Chat With

MaRIA

Hi There, I am MaRIA, Your Market Research Intelligence Assistant. How may I help you?