
- Market Size (2026)
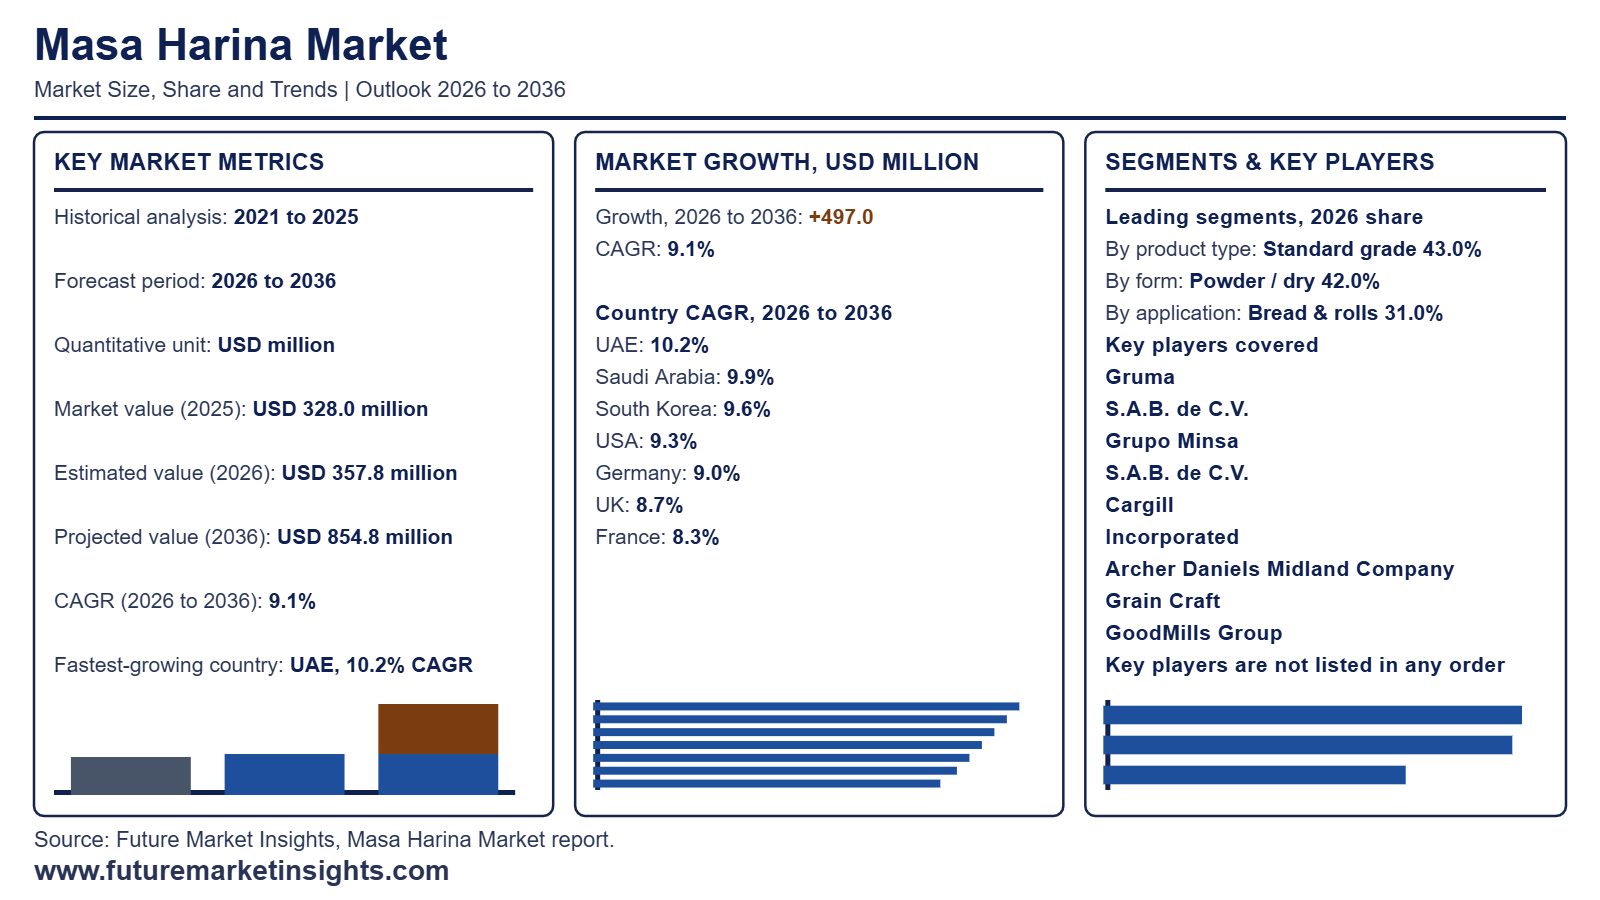
- USD 357.8 Mn
- Forecast (2036)
- USD 854.8 Mn
- CAGR (2026 to 2036)
- 9.1%
How Big Is the Masa Harina Market in 2026?
Global masa harina market recorded USD 328.0 million in 2025, climbed to USD 357.8 million in 2026, and is projected by Future Market Insights (FMI) to total USD 854.8 million by 2036, exhibiting a 9.1% CAGR and generating USD 497.0 million in incremental revenue over the ten-year forecast period.
| Market Metric | Valuation / Share / Forecast Benchmark |
|---|---|
| 2025 Market Size (Historical) | USD 328.0 million |
| 2026 Market Size (Estimated) | USD 357.8 million |
| 2036 Market Size (Projected) | USD 854.8 million |
| Compound Annual Growth Rate (2026 to 2036) | 9.1% CAGR |
| Incremental Dollar Opportunity (2026 to 2036) | USD 497.0 million |
| Dominant Product Type (2026 Share) | Standard grade (43.0% share in 2026; Other Segment Combined 57.0%) |
| Dominant Form (2026 Share) | Powder / dry (42.0% share in 2026; Other Segment Combined 58.0%) |
| Dominant Application (2026 Share) | Bread & rolls (31.0% share in 2026; Other Segment Combined 69.0%) |
| Dominant Claim & Sales Channel (2026 Share) | Conventional (55.0% share) | Direct to industrial bakeries (53.0% share) |
| Largest Country Markets (2026 Global Share) | USA (38.0% share; USD 136.0 million), Germany (10.5% share), UK (9.5% share) |
| Fastest-Growing Country Markets (2026 to 2036) | UAE (10.2% CAGR), Saudi Arabia (9.9% CAGR), South Korea (9.6% CAGR) |
| Leading Tier-1 Companies | Gruma, S.A.B. de C.V., Grupo Minsa, S.A.B. de C.V., Cargill, Incorporated, Archer Daniels Midland Company, Grain Craft, GoodMills Group, Limagrain Ingredients, King Arthur Baking, Bob's Red Mill |
Source: Future Market Insights analysis of the masa harina market, 2026.
This Report Answers
- How large the masa harina market is in 2026 and what it reaches by 2036
- Which product type, form and application segments lead in 2026
- What is driving demand and what is holding the category back
- Which countries grow fastest between 2026 and 2036
- What Gruma and other leading players have launched
- How the masa harina market is defined, segmented and measured
Executive Market Overview
Commercial tortilla plants and snack chip extruders depend on finely milled nixtamalized corn flour with precise water absorption to run high-speed automated sheeting and baking equipment smoothly. nixtamalized corn flour to standardize dough hydration on high-speed production lines. FMI finds that buyer adoption is accelerating as multi-plant operators eliminate 12-hour alkaline steeping tanks while securing verifiable mycotoxin reduction. Laboratory trials published by Arizona State University and USDA Agricultural Research Service (April 2026) confirm that cooking and steeping maize in calcium hydroxide cuts aflatoxin B1 concentrations by 81% to 86% while raising bioavailable calcium by 808.22%. Meanwhile, Gruma, S.A.B. de C.V. (February 2026) reported USD 6.4 billion in full-year net sales across its global Maseca and Azteca Milling divisions, attributed to foodservice and retail expansion across North America and Europe.
Standard white and yellow masa grades face tight contract pricing, prompting industrial millers to introduce traceably sourced non-GMO and fine-mesh bakery variants that command higher unit margins compared to bulk corn flour blends. In FMI's view, custom granulation control separates contract winners from commodity suppliers, as seen when GoodMills Innovation (May 2026) launched its SNACKMAXX masa flour range with tailored particle sizes for European snack lines. Institutional demand is also widening after the U.S. Food and Drug Administration (June 2026) reinforced guidance encouraging folic acid addition at up to 0.7 milligrams per pound of corn masa flour. Market sizing counts ingredient-level masa harina revenue across industrial and retail packaging channels, while excluding downstream finished tortillas, tortilla chips, un-nixtamalized cornmeal, and pure corn starch.
Analyst Perspective
"Masa harina millers will expand revenue faster through particle-size customization and non-GMO identity preservation than through bulk commodity tonnage, as high-speed snack and bakery plants pay premiums for predictable water absorption. The primary operational risk is alkaline wastewater treatment compliance, which raises capital thresholds for new nixtamalization lines through 2036."
- Nandini Roy Choudhury, Principal Consultant, Future Market Insights (FMI)
Key Market Trends & Insights
- North American Mill Consolidation Reshapes Industrial Supply Contracts:Large snack and bakery buyers increasingly prefer multi-plant flour suppliers capable of hedging regional harvest variability across wheat and corn milling networks. FMI observes that asset consolidation has concentrated contract supply, exemplified when Bunge Global SA (July 2025) completed the divestiture of its North American dry corn and corn masa milling business to Grain Craft across six United States mills and a transload hub in Mexico. Meanwhile, Archer Daniels Midland Company (August 2026) recorded USD 411 million in second-quarter 2026 Carbohydrate Solutions operating profit, driven by disciplined grain processing execution.
- Custom Granulation Profiles Replace Generic Masa in Snack Extrusion:High-speed rotary sheeters and twin-screw extruders require exact starch damage profiles so fried chips develop uniform micro-blisters without absorbing excess frying oil above 22% by weight. FMI believes millers that supply application-specific mesh distributions capture sticky multi-year accounts with commercial tortilla mix formulators. In May 2026, GoodMills Innovation (May 2026) commercialized SNACKMAXX yellow and white corn varieties masa flours in Europe with pilot-plant trial support, enabling snack processors to adjust crunch and cohesive dough sheeting without reformulating frying times.
- Folic Acid Fortification and Whole-Grain Crediting Unlock Institutional Procurement:Public school districts and healthcare commissaries are expanding orders for nixtamalized corn ingredients that satisfy federal nutrition standards and micronutrient fortification guidelines. Supply chain analysis published by the Food Fortification Initiative (April 2025) and maternal health guidance from the U.S. Food and Drug Administration (June 2026) highlight folic acid fortification of corn masa flour at up to 0.7 milligrams per pound under 21 CFR 172.345 to reduce neural tube defects. FMI expects fortified masa specifications to gain share in institutional foodservice tenders through 2036.
What Are the Main Drivers, Restraints, and Opportunities?
Demographic expansion of Hispanic consumers and mainstream adoption of gluten-free corn bakery formats lift core flour volume, whereas alkaline steeping effluent rules and foreign labeling compliance restrain rapid supplier switching, leaving non-GMO and fortified masa grades as the primary margin growth engine.
Driver: Expanding Hispanic Demographics and Abundant Food-Grade Corn Acreage
Recurring household and foodservice consumption of tortillas and precooked arepas anchors core masa harina orders across North America and international grocery chains. FMI's analysis indicates that demographic growth directly expands retail bag turnover and commercial bakery flour contracts. Demographic figures from the U.S. Census Bureau (August 2025) show the Hispanic population in the United States reached 68.0 million, representing 20% of the national population. On the raw material side, acreage estimates from the USDA National Agricultural Statistics Service (June 2025) confirm United States growers planted 95.2 million acres of corn in 2025, up 5% from 2024, helped by contracted identity-preserved white and yellow food-grade hybrids.
Restraint: Alkaline Steeping Effluent Treatment Costs and Import Labeling Compliance
Replacing one masa harina specification with another requires expensive line trials because lime concentration and drying temperatures alter water absorption and dough machinability.FMI notes that industrial nixtamalization also generates high-pH wastewater known as nejayote, which imposes wastewater neutralization costs on millers, while strict import labeling rules slow cross-border distribution. Regulatory notices from the Ministry of Food and Drug Safety, Republic of Korea (August 2025) updated consolidated food labeling standards under Notice No. 2025-60, requiring exact Korean allergen and ingredient declarations on imported flour sacks. Similarly, U.S. Department of Agriculture Foreign Agricultural Service (August 2026) reporting confirms that mandatory Arabic labeling and electronic registration gates lengthen onboarding for foreign ingredient suppliers.
Opportunity: Traceable Non-GMO Snack Grades and Gluten-Free Bakery Reformulation
Commercial bakeries formulating celiac-safe bread loaves and extruded snacks are combining nixtamalized masa harina with gluten-free flours to improve moisture retention and natural corn aroma. FMI projects premium non-GMO and clean-label masa grades to capture higher contract margins as European and Asian snack manufacturers localize production. In May 2026, GoodMills Innovation (May 2026) introduced SNACKMAXX masa flours made from European-grown non-GMO corn, while Cargill, Incorporated (November 2026) documented 3.2 million acres enrolled in North American regenerative agriculture programs through fiscal 2026, on account of multinational snack brands demanding traceable grain origination.
How Is the Masa Harina Market Segmented?
Masa Harina Market is segmented by Product Type, Form, Application, Claim, Sales Channel, and Region. Forecast period from 2026 to 2036.
| Segmentation Axis | Sub-Segments Covered | Dominant Sub-Segment (2026 Share %) | Other Segment Combined & Total (100.0%) |
|---|---|---|---|
| Product Type | Standard grade, Premium / specialty grade, Organic certified, Clean label grade | Standard grade (43.0%) | Other Segment Combined (57.0%) | Total (100.0%) |
| Form | Powder / dry, Liquid, Paste / semi-solid, Granules / pieces | Powder / dry (42.0%) | Other Segment Combined (58.0%) | Total (100.0%) |
| Application | Bread & rolls, Cakes & muffins, Biscuits & cookies, Viennoiserie & pastry, Other bakery & snacks | Bread & rolls (31.0%) | Other Segment Combined (69.0%) | Total (100.0%) |
| Claim | Conventional, Clean label, Organic, Non-GMO / identity preserved | Conventional (55.0%) | Other Segment Combined (45.0%) | Total (100.0%) |
| Sales Channel | Direct to industrial bakeries, Ingredient distributors, Foodservice & artisan supply, Online B2B | Direct to industrial bakeries (53.0%) | Other Segment Combined (47.0%) | Total (100.0%) |
Source: Future Market Insights analysis of the masa harina market, 2026.
Why Does Standard grade Lead Product Type Demand?
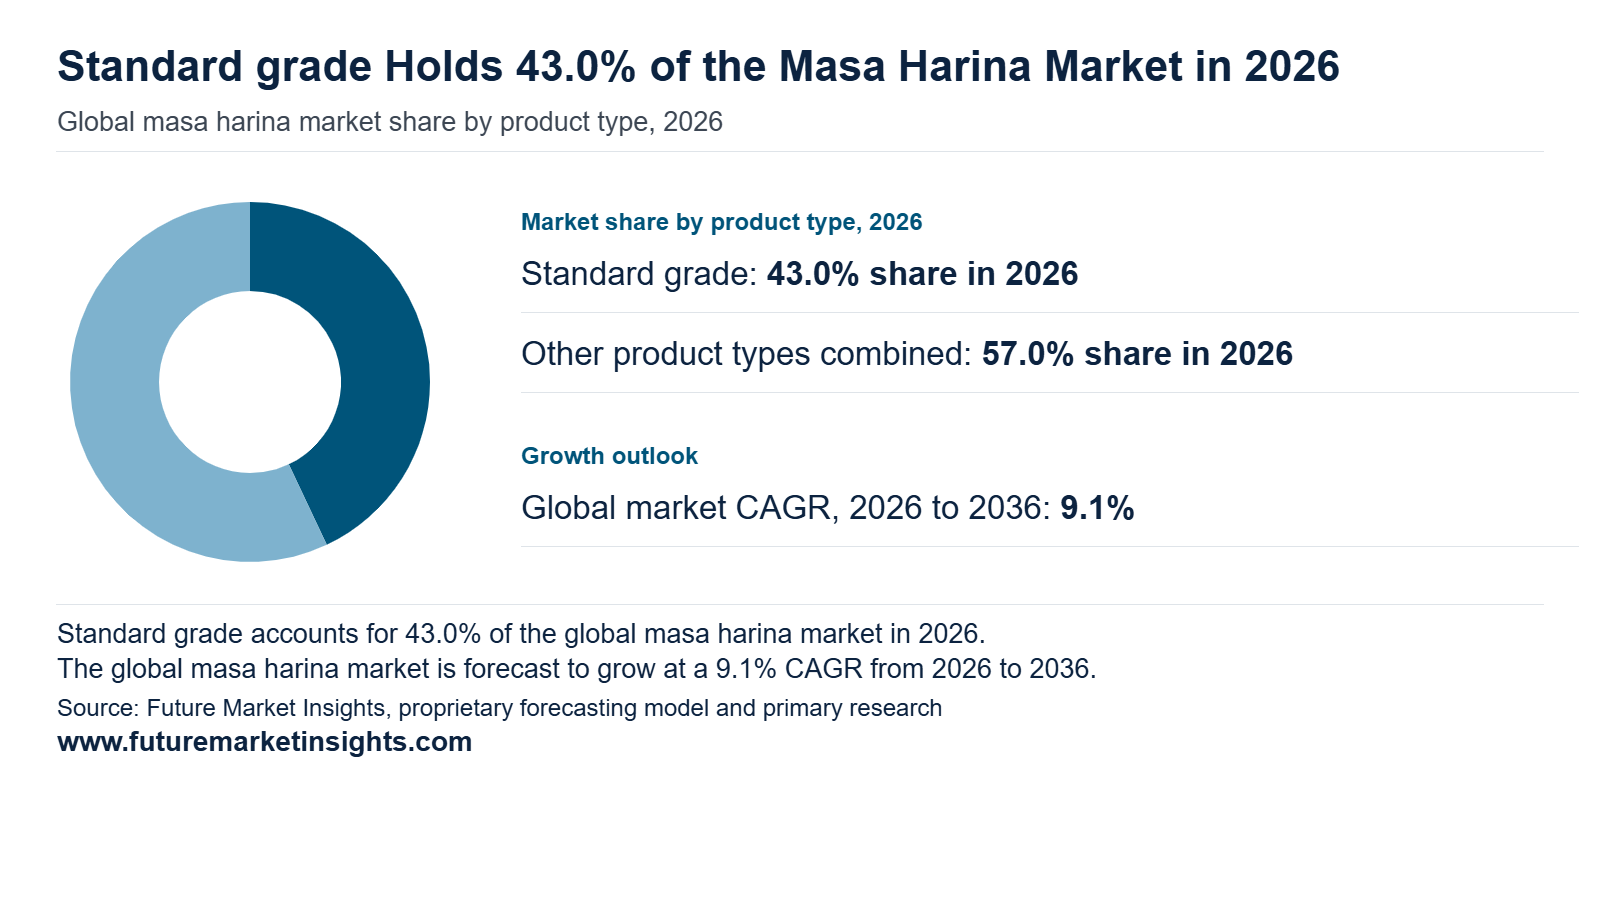
Standard grade varieties secure a leading 43.0% share of Product Type revenue in 2026, favored by commercial tortilla and snack manufacturers for dependable hydration stability and uniform starch gelatinization.). its cost-effective hydration stability and uniform starch gelatinization across high-volume tortilla and chip plants. Industrial buyers running continuous ovens prioritize repeatable water uptake over specialty heirloom certifications to keep unit dough costs stable against flour substitutes. Financial disclosures from Gruma, S.A.B. de C.V. (February 2026) confirm that core Maseca standard white and yellow corn flours anchor its global milling footprint across the Americas and Europe. In FMI's view, high-throughput foodservice and retail tortilla contracts will keep as the primary Product Type contributor through 2036.
How Does Powder / dry Sustain Form Leadership?
Powder / dry varieties secure a leading 42.0% share of Form revenue in 2026, favored by industrial bakeries for ambient silo storage stability and reduced shipping weight compared with perishable wet masa paste.). ambient silo storage stability and lower freight weight compared to refrigerated wet masa paste. Commercial bakeries meter dry nixtamalized flour directly into automated mixers with tortilla improvers to control dough viscosity on the line. Recipe and technical documentation from King Arthur Baking (July 2025) and product specifications from GoodMills Innovation (May 2026) show that controlled-granulation dry masa flour hydrates rapidly in warm water without lumping. FMI expects pneumatic bulk silo handling and export shelf-life advantages to preserve leadership through 2036.
What Keeps Bread & rolls Ahead in Application?
Bread & rolls represents the commercial foundation of Application demand with a 31.0% share in 2026, as commercial bakeries blend masa harina into specialty sandwich loaves and gluten-free food bakery lines to impart roasted maize aroma and extend crumb softness.). Within the bakery-centered application taxonomy, industrial bakeries blend masa harina into cornbread loaves and gluten-free food bakery lines to impart roasted maize aroma and extend crumb softness. FMI observes that alkaline calcium cross-linking improves moisture retention in composite bakery doughs, as demonstrated in controlled nixtamalization studies by Arizona State University and USDA Agricultural Research Service (April 2026). Meanwhile, savory tortilla chips and taco shells scale within the other bakery and snacks sub-segment. FMI projects composite artisan loaves and gluten-free pan breads to sustain leadership through 2036.
Why Does Conventional Retain the Largest Claim Share?
Conventional formulations command 55.0% of the Claim segment in 2026, representing the primary commercial volume across large-scale mills as conventional yellow and white dent corn supplies support steady flour production. Furthermore, conventional masa flour readily incorporates folic acid enrichment via flour fortification premix systems under U.S. Food and Drug Administration (June 2026) fortification guidelines. FMI expects cost-sensitive institutional and supermarket contracts to keep Conventional in the lead through 2036.
What Explains Direct to industrial bakeries as the Leading Sales Channel?
Direct to industrial bakeries channels anchor 53.0% of category sales in 2026, governed by tight commercial flour specifications on granulation and certified mycotoxin safety. Direct supply contracts also bundle pilot-line testing on commercial tortilla machine sheeters and ovens. Corporate disclosures from Bunge Global SA (July 2025) on the transfer of six United States corn and masa mills to Grain Craft and application support from GoodMills Innovation (May 2026) illustrate how millers serve industrial accounts directly. In FMI's view, bulk railcar and tote deliveries will anchor Direct to industrial bakeries leadership through 2036.
Regional & Country Outlook
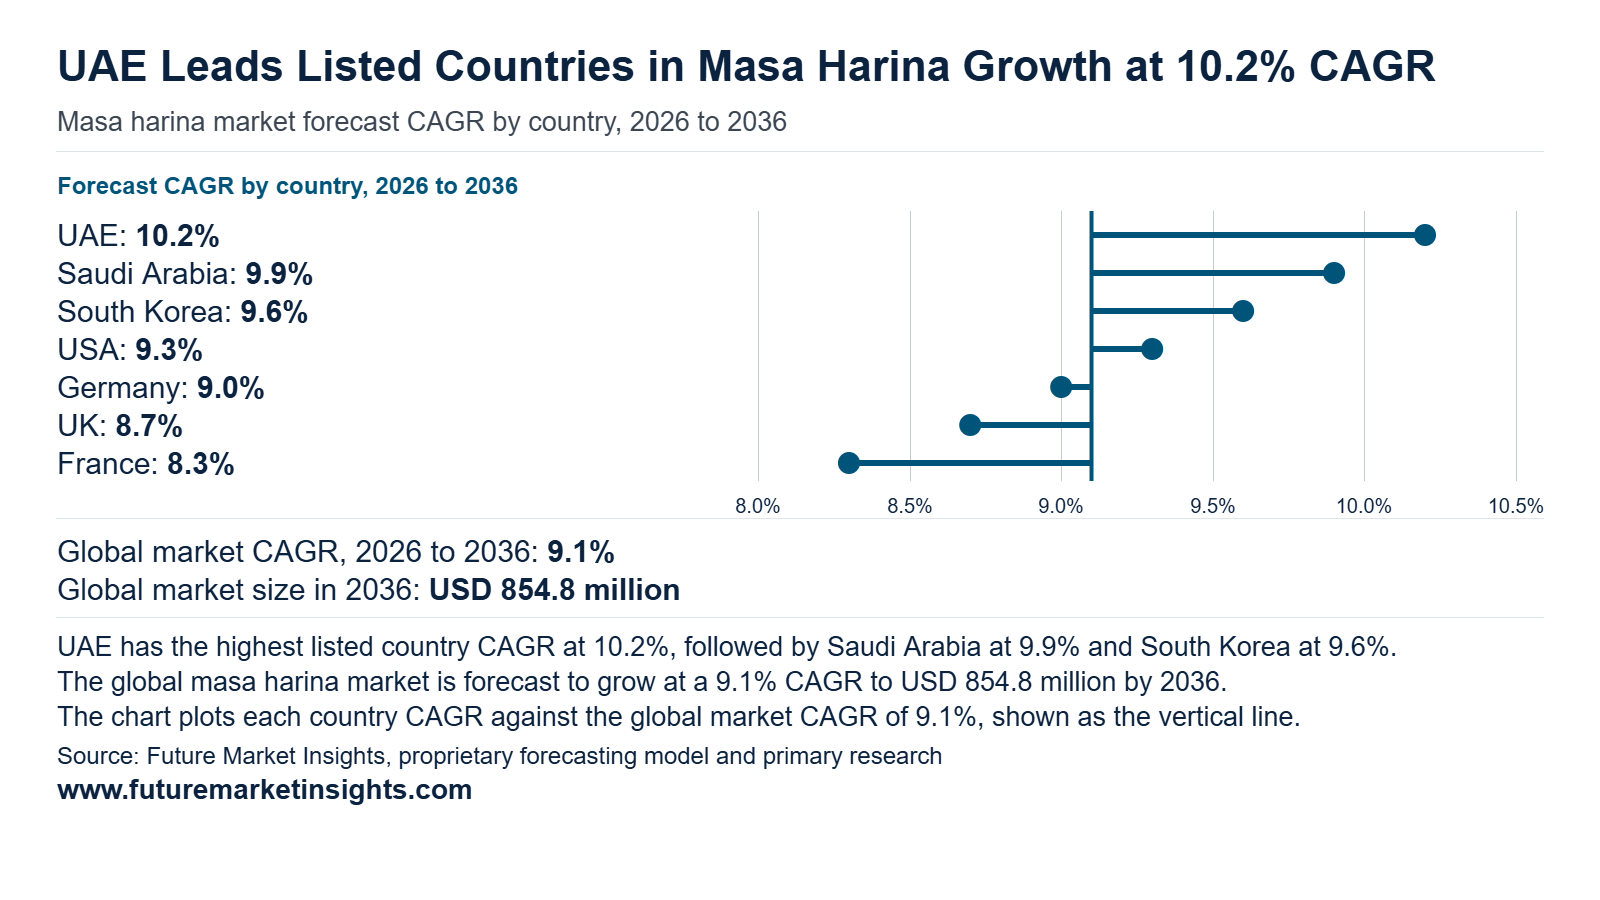
North America and Western Europe anchor current global masa harina revenue, while Middle Eastern and East Asian import hubs record the fastest percentage gains through 2036.FMI projects the eight profiled countries below to account for 75.5% of global market value in 2026 (USD 270.1 million), rising to 76.1% by 2036 (USD 650.5 million). Across the USA, remains the single largest country market at USD 136.0 million in 2026 (38.0% global share), anchored by domestic nixtamal milling capacity operated by Gruma, S.A.B. de C.V. (February 2026) and Grain Craft. Simultaneously, the UAE (10.2% CAGR), Saudi Arabia (9.9% CAGR), and South Korea (9.6% CAGR) lead growth as foodservice chains and snack plants localize Mexican flatbread and chip production with batter based premixes.
| Country | 2026 Revenue | 2036 Revenue | 10-Year Addition | 2026 to 2036 CAGR | Global Share (2026 to 2036) |
|---|---|---|---|---|---|
| UAE | USD 12.5 million | USD 33.0 million | +USD 20.5 million | 10.2% | 3.5% to 3.9% |
| Saudi Arabia | USD 16.1 million | USD 41.4 million | +USD 25.3 million | 9.9% | 4.5% to 4.8% |
| South Korea | USD 21.5 million | USD 53.8 million | +USD 32.3 million | 9.6% | 6.0% to 6.3% |
| USA | USD 136.0 million | USD 330.8 million | +USD 194.8 million | 9.3% | 38.0% to 38.7% |
| Germany | USD 37.6 million | USD 89.0 million | +USD 51.4 million | 9.0% | 10.5% to 10.4% |
| UK | USD 34.0 million | USD 78.3 million | +USD 44.3 million | 8.7% | 9.5% to 9.2% |
| France | USD 25.0 million | USD 55.5 million | +USD 30.5 million | 8.3% | 7.0% to 6.5% |
| Japan | USD 17.9 million | USD 38.6 million | +USD 20.7 million | 8.0% | 5.0% to 4.5% |
Source: Future Market Insights analysis of the masa harina market, 2026.
UAE
Demand for masa harina in UAE is projected to rise from USD 12.5 million in 2026 to USD 33.0 million by 2036, advancing at a 10.2% CAGR and adding USD 20.5 million in new revenue. FMI finds that hotel catering kitchens and regional snack processors in Dubai and Abu Dhabi rely on imported dry masa harina owing to rapid hospitality expansion and zero domestic maize milling. Trade data from the U.S. Department of Agriculture Foreign Agricultural Service (October 2026) confirms that UAE consumer-oriented food imports grew 9.3% to USD 17.7 billion in 2025 while grocery retail sales exceeded USD 20.0 billion. FMI expects streamlined municipal import clearance and expanding fast-casual Mexican dining to sustain double-digit masa harina contract orders across the UAE through 2036.
Saudi Arabia
Buyer adoption of masa harina across Saudi Arabia is estimated to expand from USD 16.1 million in 2026 to USD 41.4 million by 2036, spurred by a 9.9% CAGR and generating USD 25.3 million in commercial expansion. In FMI's assessment, modern supermarket expansion and domestic tortilla chip manufacturing in Riyadh and Jeddah are driving bulk dry masa imports. According to the U.S. Department of Agriculture Foreign Agricultural Service (August 2026), Saudi Arabia food retail sales reached USD 57.0 billion in 2025, while United States retail food shipments to the Kingdom hit a record USD 666.3 million in 2025 and rose another 22% in the first half of 2026. FMI projects distributor investments in Arabic-labeled bulk bags to accelerate industrial bakery adoption in Saudi Arabia through 2036.
South Korea
Masa harina industry in South Korea is set to scale from USD 21.5 million in 2026 to USD 53.8 million by 2036, driven by a 9.6% CAGR and adding USD 32.3 million in incremental market value. FMI observes that convenience-store taco meal kits and extruded corn snack launches are prompting Korean food processors to qualify imported nixtamalized flour over standard dry-milled corn grits. Grain trade records from the U.S. Department of Agriculture Foreign Agricultural Service (April 2026) document heavy reliance on imported food-grade corn, while the Ministry of Food and Drug Safety, Republic of Korea (April 2025) enforced revised food labeling standards under Notice No. 2025-27. In FMI's view, suppliers offering pre-verified Korean nutrition labels will capture rising snack-extrusion demand through 2036.
USA
Sales of masa harina throughout USA are projected to increase from USD 136.0 million in 2026 to USD 330.8 million by 2036, progressing at a 9.3% CAGR and creating USD 194.8 million in additional revenue. FMI believes domestic growth is fueled by mainstream supermarket demand for organic and folic-acid-fortified masa flours as well as industrial tortilleria contracts. Crop reports from the USDA National Agricultural Statistics Service (June 2025) show 95.2 million acres of corn planted in 2025, while USDA National Agricultural Statistics Service (June 2026) dry- and wet-milling logs confirm steady industrial corn processing across Midwest plants. FMI anticipates domestic capacity investments by Grain Craft and Azteca Milling to keep the USA at 38.7% of global masa harina sales through 2036.
Germany
Consumption of masa harina across Germany is estimated to climb from USD 37.6 million in 2026 to USD 89.0 million by 2036, reflecting a 9.0% CAGR and contributing USD 51.4 million over the forecast decade. FMI's analysis indicates that German savory snack manufacturers and gluten-free bakeries are replacing imported finished tortilla chips with locally extruded snacks made from European non-GMO masa flour. In May 2026, Hamburg-based GoodMills Innovation (May 2026) launched its SNACKMAXX masa flour line with tailored yellow and white corn varieties corn granulations and pilot-line engineering support for German snack processors. FMI expects regional non-GMO corn sourcing and lower intra-European freight costs to drive sustained contract expansion across Germany through 2036.
UK
Revenue generated by masa harina suppliers in UK is forecast to expand from USD 34.0 million in 2026 to USD 78.3 million by 2036, anchored by a 8.7% CAGR and generating USD 44.3 million in new category sales. FMI finds that British supermarket private-label tortilla wrap lines and free-from bakeries are expanding orders for certified gluten-free nixtamalized corn flour. Processing assessments from the U.S. Department of Agriculture Foreign Agricultural Service (March 2025) highlight rising British food-manufacturing demand for functional specialty flours that satisfy strict below-20-ppm gluten thresholds. In FMI's view, clear specification boundaries separating genuine nixtamalized masa from ordinary corn starch will support steady industrial bakery reorders in the UK through 2036.
France
Buyer procurement of masa harina throughout France is tracking from USD 25.0 million in 2026 to USD 55.5 million by 2036, exhibiting a 8.3% CAGR and contributing USD 30.5 million to national market value. FMI observes that French snack extruders and bakery chains are adopting hydrothermally treated and nixtamalized maize flours to achieve clean-label Nutri-Score targets in salted tortilla chips. Domestic ingredient innovation by France-based Limagrain Ingredients and European milling expansion documented by GoodMills Innovation (May 2026) give French food processors shortened trial cycles and certified European maize traceability. FMI projects supermarket snack reformulation and Mexican restaurant chain growth to support steady masa harina demand in France through 2036.
Japan
Demand for masa harina in Japan is projected to rise from USD 17.9 million in 2026 to USD 38.6 million by 2036, advancing at a 8.0% CAGR and adding USD 20.7 million in new revenue. FMI notes that Japanese snack makers and convenience-store suppliers require identity-preserved non-GMO maize documentation and exact particle-size uniformity before approving imported masa flour. Official grain balance sheets from the U.S. Department of Agriculture Foreign Agricultural Service (March 2026) confirm that Japanese food processors rely heavily on imported North American food-grade grains under strict quality-assurance protocols. FMI expects specialty retail baking packs and commercial taco-chip lines to sustain consistent masa harina sales growth across Japan through 2036.
Competitive Environment and Notable Companies
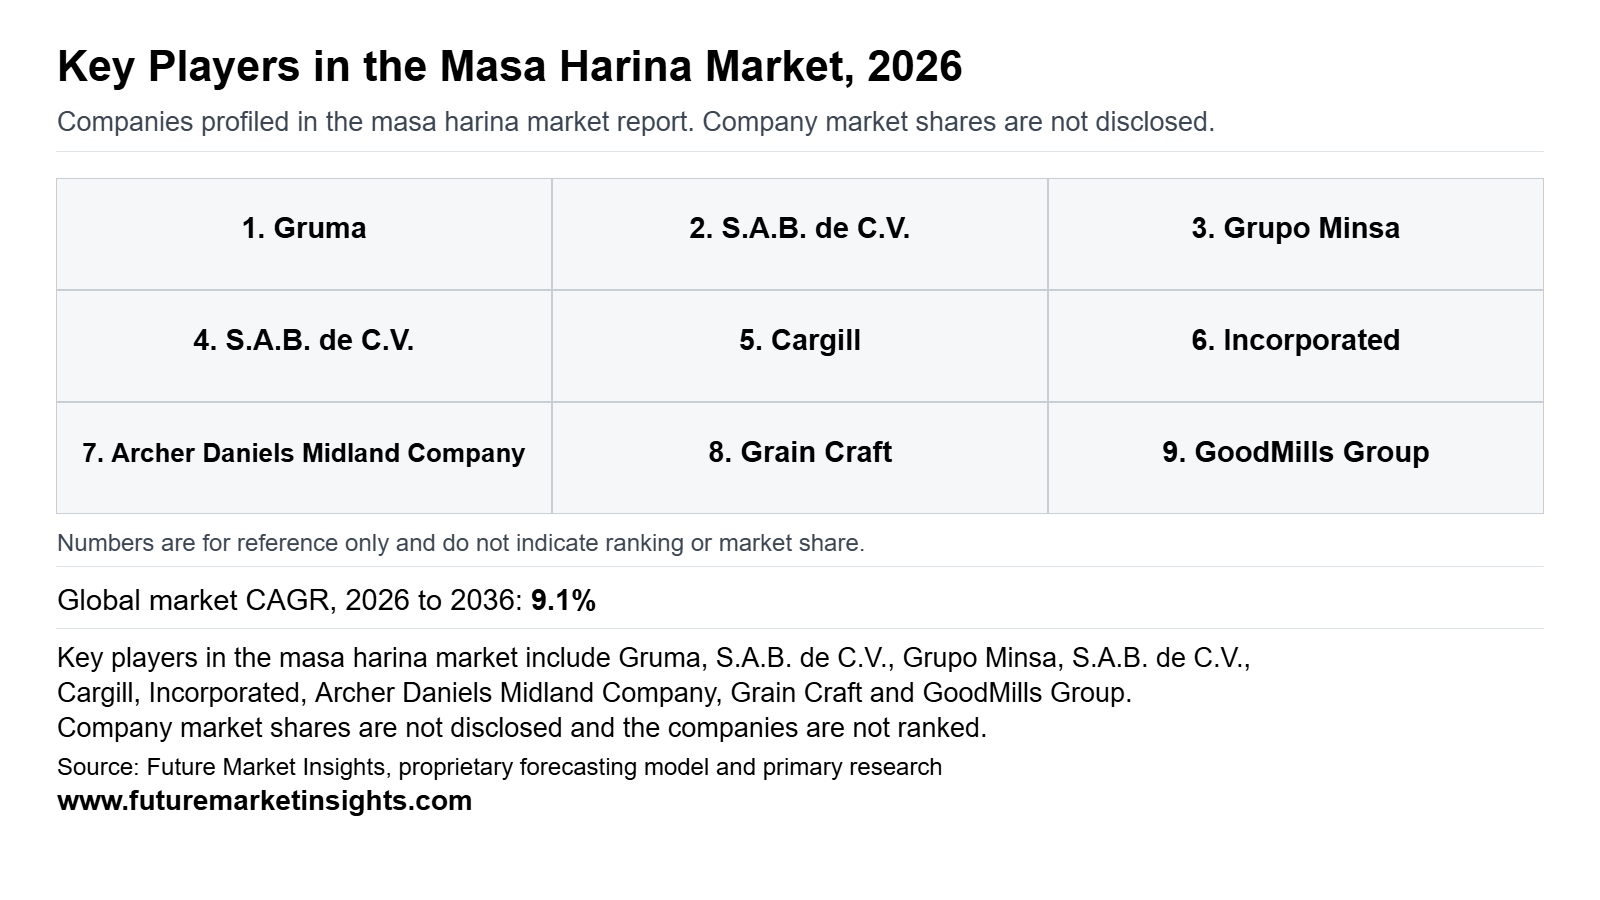
Competition in the global masa harina market operates across two distinct commercial tiers: multinational nixtamalized corn millers running integrated grain-origination and bulk railcar networks, and specialty ingredient formulators supplying custom-granulated or organic retail masa flours. Active market participants include Gruma, S.A.B. de C.V. (Maseca and Azteca Milling), Grupo Minsa, S.A.B. de C.V., Cargill, Incorporated, Archer Daniels Midland Company, Grain Craft, Bunge Global SA, GoodMills Group (GoodMills Innovation), Limagrain Ingredients, King Arthur Baking, and Bob's Red Mill. FMI finds that millers pairing non-GMO grain traceability with pilot-line extrusion support secure the highest contract retention.
How Are Companies Positioned in the Masa Harina Market?
Gruma, S.A.B. de C.V. leads global nixtamalized masa production, generating USD 6.4 billion in consolidated net sales per Gruma, S.A.B. de C.V. (February 2026) investor filings across its Maseca and Azteca Milling brands. In North America, Grain Craft expanded into top-tier industrial masa supply after acquiring six dry corn and masa mills from Bunge Global SA (July 2025), competing with Grupo Minsa and Archer Daniels Midland Company (August 2026). In Europe, GoodMills Innovation (May 2026) and Limagrain Ingredients lead snack-specific masa formulation, while King Arthur Baking (July 2025) and Bob's Red Mill anchor packaged retail and foodservice education.
What Matters When a Buyer Selects a Masa Harina Supplier?
Industrial bakery and snack procurement teams qualify masa harina suppliers on four measurable operational parameters: rapid water absorption curve repeatability, particle-size distribution across 60-to-100-mesh screens, verified aflatoxin reduction, and pneumatic bulk delivery reliability. Laboratory findings fromArizona State University and USDA Agricultural Research Service (April 2026) demonstrate that properly controlled alkaline steeping lowers aflatoxin B1 by 81% to 86%, making supplier steeping validation essential for food safety audits. Buyers also audit folic acid premix homogeneity under U.S. Food and Drug Administration (June 2026) fortification standards.
Which Capabilities Distinguish Product Offers?
Leading portfolios differentiate through custom granulation blending, colored maize varieties, and clean-label hydrothermal processing.GoodMills Innovation (May 2026) supplies yellow and white corn varieties SNACKMAXX masa flours engineered to prevent dough sticking on high-speed sheeting rollers. Cargill, Incorporated (November 2026) pairs its North American masa flour portfolio with regenerative corn sourcing across 3.2 million acres, whereas King Arthur Baking (July 2025) and Bob's Red Mill provide certified organic, lime-treated white and golden masa flours for retail and artisan bakery buyers.
How Does Geographic Reach Affect Competition?
Because corn masa flour carries a low value-to-weight ratio, regional milling proximity directly governs landed cost competitiveness.Gruma, S.A.B. de C.V. (February 2026) operates production plants across North Europe and Asia-Pacific, enabling local currency contracting. Following the July 2025 asset transfer from Bunge Global SA (July 2025), Grain Craft links United States corn belt mills with cross-border Mexican distribution, while GoodMills Innovation (May 2026) supplies European snack plants from German and continental mills without transatlantic ocean freight.
| Verified Company Evidence (2025 to 2026) | Commercial Effect | Buyer Action |
|---|---|---|
| July 2025: Bunge Global SA completed the sale of its North American dry corn and corn masa milling business to Grain Craft (Bunge Global SA, July 2025). | Consolidates six United States corn and masa mills plus a Querétaro transload hub under an independent flour miller. | Re-verify multi-plant supply contracts and combined wheat-and-masa freight bundles with Grain Craft. |
| February 2026: Gruma, S.A.B. de C.V. reported FY2025 net sales of USD 6.4 billion and USD 1,136 million EBITDA across its global Maseca and Azteca Milling units (Gruma, S.A.B. de C.V., February 2026). | Confirms strong margin expansion in value-added foodservice and European industrial masa flour supply. | Benchmark long-term Maseca and Azteca Milling contract pricing against regional non-GMO corn basis trends. |
| May 2026: GoodMills Innovation launched SNACKMAXX yellow, white, and red masa flours with pilot-plant trial support in Europe (GoodMills Innovation, May 2026). | Provides European snack extruders with regionally grown non-GMO masa flours tailored for crunch and oil-uptake control. | Schedule pilot sheeting and frying trials to test European non-GMO masa granulations against imported flours. |
| August 2026: Archer Daniels Midland Company reported USD 411 million in Q2 2026 Carbohydrate Solutions operating profit across its milling network (Archer Daniels Midland Company, August 2026). | Reinforces high capacity consumption and identity-preserved corn origination across North American dry-milling assets. | Lock in multi-quarter non-GMO and conventional masa flour volume allocations ahead of seasonal harvest swings. |
Source: Verified corporate disclosures and Future Market Insights analysis, 2026.
| Company | Core Positioning | Verified Activity & Source Attribution |
|---|---|---|
| Gruma, S.A.B. de C.V. | Global leader in nixtamalized masa harina (Maseca, Azteca Milling) | Reported USD 6.4 billion in FY2025 sales and USD 1,136 million EBITDA across global corn flour and tortilla operations (Gruma, S.A.B. de C.V., February 2026). |
| Grain Craft | North American industrial wheat, dry corn, and masa flour miller | Acquired six United States dry corn and masa mills and a Querétaro hub from Bunge on 1 July 2025 (Bunge Global SA, July 2025). |
| Archer Daniels Midland Company | Global agricultural processor supplying dry-milled corn and masa flours | Generated USD 411 million in Q2 2026 Carbohydrate Solutions operating profit and expanded Columbus corn grind capacity (Archer Daniels Midland Company, August 2026). |
| Cargill, Incorporated | Multinational supplier of North American corn masa flours and bakery ingredients | Expanded regenerative corn and grain programs to 3.2 million acres in its FY2026 report while supplying bulk masa flours (Cargill, Incorporated, November 2026). |
| GoodMills Group (GoodMills Innovation) | European industrial miller supplying SNACKMAXX non-GMO masa flours | Launched SNACKMAXX yellow, white, and red masa flours with pilot-line trial support in May 2026 (GoodMills Innovation, May 2026). |
| Bunge Global SA | International grain processor with South American and global milling operations | Completed divestiture of North American corn masa mills in July 2025 while expanding global grain and oilseed processing in Q3 2026 (Bunge Global SA, July 2025). |
| King Arthur Baking | United States specialty and retail supplier of certified organic white masa harina | Published consumer and bakery formulation guides for corn-and-flour masa tortillas in July 2025 (King Arthur Baking, July 2025). |
| Grupo Minsa, S.A.B. de C.V. | Mexican and North American producer of bagged and bulk nixtamalized masa flour | Documented as a core fortified and conventional corn masa supplier across North American supply chains (Food Fortification Initiative, April 2025). |
| Limagrain Ingredients | French cereal ingredient specialist producing industrial masa flours for snacks | Supplies hydrothermally treated white and yellow masa flours for European tortilla chips and soft tortillas. |
| Bob's Red Mill | Natural retail and foodservice brand offering organic and golden masa harina | Markets lime-treated organic and conventional stone-ground masa harina across grocery and online channels. |
Source: Verified corporate disclosures and Future Market Insights analysis, 2026.
Key takeaways
- Valued at USD 357.8 million in 2026, on course for USD 854.8 million by 2036.
- The decade adds USD 497.0 million in new value at a 9.1% CAGR.
- The product type segment is led by Standard grade at 43.0% of 2026 revenue.
- 42.0% of form revenue goes to Powder / dry in 2026.
- The UAE grows fastest at 10.2% CAGR, ahead of Saudi Arabia at 9.9%.
Masa Harina Market - Report Scope and Research Methodology
FMI sizes the global masa harina market using a bottom-up and top-down triangulation model that reconciles commercial nixtamalized corn milling capacity, food-grade maize acreage, and B2B ingredient contract prices across each country. Industrial dry masa shipments anchor the core model and are cross-checked against national grain-grinding logs from the USDA National Agricultural Statistics Service, import registries from the USDA Foreign Agricultural Service, and audited corporate disclosures from Gruma, Bunge as well as GoodMills. Segment and country valuations are standardized in USD million at factory-gate and importer-landed ingredient prices, strictly excluding downstream consumer revenue from finished tortillas, bagged tortilla chips, untreated cornmeal, and pure corn starch so that all regional and segment figures reconcile to the global total.
| Coverage Field | Report Scope |
|---|---|
| Market Definition | Revenue from nixtamalized or hydrothermally lime-treated corn masa flour sold as a food manufacturing, foodservice, or retail baking ingredient. |
| Historical Year | 2025 (USD 328.0 million) |
| Base & Estimated Year | 2026 (USD 357.8 million) |
| Forecast Period & 2036 Projection | 2026 to 2036 (USD 854.8 million; 9.1% CAGR; +USD 497.0 million incremental addition) |
| Quantitative Units | USD million for market value and revenue breakdowns. |
| Product Type Coverage | Standard grade (43.0%), Premium / specialty grade, Organic certified, Clean label grade (Other Segment Combined 57.0%). |
| Form Coverage | Powder / dry (42.0%), Liquid, Paste / semi-solid, Granules / pieces (Other Segment Combined 58.0%). |
| Application Coverage | Bread & rolls (31.0%), Cakes & muffins, Biscuits & cookies, Viennoiserie & pastry, Other bakery & snacks (Other Segment Combined 69.0%). |
| Claim Coverage | Conventional (55.0%), Clean label, Organic, Non-GMO / identity preserved (Other Segment Combined 45.0%). |
| Sales Channel Coverage | Direct to industrial bakeries (53.0%), Ingredient distributors, Foodservice & artisan supply, Online B2B (Other Segment Combined 47.0%). |
| Regions Covered | North America, Latin America, Western Europe, Eastern Europe, East Asia, South Asia and Pacific, Middle East and Africa. |
| Countries Profiled | UAE, Saudi Arabia, South Korea, USA, Germany, UK, France, and Japan. |
| Scope Exclusions | Finished packaged tortillas, fried tortilla chips, tamales, un-nixtamalized yellow cornmeal, and corn starch (such as UK cornflour starch). |
| Companies Profiled | Gruma, S.A.B. de C.V., Grain Craft, Archer Daniels Midland Company, Cargill, Incorporated, GoodMills Group, Bunge Global SA, King Arthur Baking, Grupo Minsa, Limagrain Ingredients, and Bob's Red Mill. |
Source: Future Market Insights analysis of the masa harina market, 2026.
Research Sources and Bibliography
- Archer Daniels Midland Company. (2026, August 4).ADM Reports Second Quarter 2026 Results. https://investors.adm.com/news/news-details/2026/ADM-Reports-Second-Quarter-2026-Results/default.aspx
- Arizona State University and USDA Agricultural Research Service. (2026, April 23).Local Nixtamalization Processes Reduce Aflatoxin B1 Concentration and Shift Metabolome in Naturally Contaminated Maize. https://pmc.ncbi.nlm.nih.gov/articles/PMC13154181/
- Bunge Global SA. (2025, July 1).Bunge Completes Sale of its North America Corn Milling Business. https://investors.bunge.com/news-and-events/press-releases/2025/07-01-2025-120042331
- Cargill, Incorporated. (2026, November 9).2026 Impact Report: Climate, Land and Water, and Sustainable Supply Chains. https://www.cargill.com/sustainability/2026-impact-report
- Food Fortification Initiative. (2025, April 15).Corn Masa in the United States: Supply Chain, Market, and Fortification Assessment. https://ffinetwork.org/wp-content/uploads/2025/04/CornMasaintheUnitedStates-SupplyChainMarketandFortification.pdf
- GoodMills Innovation. (2026, May 22).SNACKMAXX Masa Flours: Authentic Corn Flavour and Process Reliability for Snack Applications. https://www.goodmillsinnovation.com/en/2026/05/snackmaxx-masa-flours-authentic-corn-flavour-and-process-reliability-for-snack-applications/
- Gruma, S.A.B. de C.V.. (2026, February 18).Fourth Quarter 2025 Investor Presentation: World's Largest Corn Flour and Tortilla Producer. https://www.gruma.com/media/731822/investor_presentation_4q25.pdf
- King Arthur Baking. (2025, July 21).10 Kid-Friendly Recipes for Young Bakers Featuring Organic Masa Harina Corn-and-Flour Tortillas. https://www.kingarthurbaking.com/blog/2025/07/21/fun-things-to-bake-with-kids
- Ministry of Food and Drug Safety, Republic of Korea. (2025, April 21).Partial Revision of Food Labeling Standards (Notice No. 2025-27).
- Ministry of Food and Drug Safety, Republic of Korea. (2025, August 29).Consolidated Food Labeling Standards (Notice No. 2025-60).
- U.S. Census Bureau. (2025, August 27).National Hispanic Heritage Month: 2025 Facts for Features. https://www.census.gov/newsroom/facts-for-features/2025/hispanic-heritage-month.html
- U.S. Department of Agriculture Foreign Agricultural Service. (2025, March 31).United Kingdom: Food Processing Ingredients Annual (Report UK2025-0013). https://apps.fas.usda.gov/newgainapi/api/Report/DownloadReportByFileName?fileName=Food+Processing+Ingredients+Annual_London_United+Kingdom_UK2025-0013.pdf
- U.S. Department of Agriculture Foreign Agricultural Service. (2026, March 31).Japan: Oilseeds and Products Annual (Report JA2026-0016). https://apps.fas.usda.gov/newgainapi/api/Report/DownloadReportByFileName?fileName=Oilseeds%20and%20Products%20Annual_Tokyo_Japan_JA2026-0016
- U.S. Department of Agriculture Foreign Agricultural Service. (2026, April 14).Republic of Korea: Grain and Feed Annual (Report KS2026-0009). https://apps.fas.usda.gov/newgainapi/api/Report/DownloadReportByFileName?fileName=Grain+and+Feed+Annual_Seoul_Korea+-+Republic+of_KS2026-0009.pdf
- U.S. Department of Agriculture Foreign Agricultural Service. (2026, August 31).Saudi Arabia: Retail Foods Annual (Report SA2026-0013). https://www.fas.usda.gov/data/gain/2026/08/saudi-arabia-retail-foods-annual
- U.S. Department of Agriculture Foreign Agricultural Service. (2026, October 19).United Arab Emirates: Retail Foods Annual (Report TC2026-0013). https://www.fas.usda.gov/data/gain/2026/10/united-arab-emirates-retail-foods-annual
- U.S. Food and Drug Administration. (2026, June 22).Pregnancy and Maternal Nutrition Guidance: Adding Folic Acid to Corn Masa Flour. https://www.fda.gov/consumers/womens-health-topics/pregnancy
- USDA National Agricultural Statistics Service. (2025, June 30).Corn Planted Acreage Up 5% from 2024, Soybean Acreage Down 4% from Last Year. https://www.nass.usda.gov/Newsroom/archive/2025/06-30-2025.php
- USDA National Agricultural Statistics Service. (2026, June 1).Grain Crushings and Co-Products Production (June 2026 Release). https://esmis.nal.usda.gov/sites/default/release-files/795927/cagc0626.pdf
Table of Content
- Key Takeaways
- Market Size and CAGR
- Top Growth Driver
- Fastest Growing Segment
- Leading Region
- Key Companies
- Emerging Opportunities
- Executive Summary
- Global Market Outlook
- Demand-side Trends
- Supply-side Trends
- Technology Roadmap Analysis
- Analysis and Recommendations
- Analyst Perspective (What is happening? Why now? What should investors know?)
- Key Questions Answered
- How large is the market?
- What is the CAGR?
- What are key trends?
- Which region dominates?
- Who are the leaders?
Read More...
- Market Overview
- Market Coverage / Taxonomy
- Market Definition / Scope / Limitations
- Research Methodology
- Chapter Orientation
- Analytical Lens and Working Hypotheses
- Market Structure, Signals, and Trend Drivers
- Benchmarking and Cross-market Comparability
- Market Sizing, Forecasting, and Opportunity Mapping
- Research Design and Evidence Framework
- Desk Research Programme (Secondary Evidence)
- Expert Input and Fieldwork (Primary Evidence)
- Tooling, Models, and Reference Databases
- Data Engineering and Model Build
- Quality Assurance and Audit Trail
- Market Background
- Market Dynamics (Drivers, Restraints, Opportunity, Trends)
- Scenario Forecast (Optimistic, Likely, Conservative)
- Impact Analysis
- AI Impact
- Sustainability Impact
- Regulatory Impact
- Technology Impact
- Consumer / Buyer Analysis
- Purchase Drivers
- Adoption Barriers
- Buyer Journey
- Opportunity Map Analysis
- Product Life Cycle Analysis
- Supply Chain Analysis
- Investment Feasibility Matrix
- Value Chain Analysis
- PESTLE and Porter's Analysis
- Regulatory Landscape
- Regional Parent Market Outlook
- Production and Consumption Statistics
- Import and Export Statistics
- Global Market Analysis and Forecast, 2021 to 2036
- Historical Market Size Value (USD Million) Analysis, 2021 to 2025
- Current and Future Market Size Value (USD Million) Projections, 2026 to 2036
- Y-o-Y Growth Trend Analysis
- Absolute $ Opportunity Analysis
- Global Market Pricing Analysis, 2021 to 2036
- Global Market Analysis and Forecast, By Product Type, 2021 to 2036
- Introduction / Key Findings
- Historical Market Size Value (USD Million) Analysis By Product Type, 2021 to 2025
- Current and Future Market Size Value (USD Million) Analysis and Forecast By Product Type, 2026 to 2036
- Standard grade
- Premium / specialty grade
- Organic certified
- Clean label grade
- Y-o-Y Growth Trend Analysis By Product Type, 2021 to 2025
- Absolute $ Opportunity Analysis By Product Type, 2026 to 2036
- Global Market Analysis and Forecast, By Form, 2021 to 2036
- Introduction / Key Findings
- Historical Market Size Value (USD Million) Analysis By Form, 2021 to 2025
- Current and Future Market Size Value (USD Million) Analysis and Forecast By Form, 2026 to 2036
- Powder / dry
- Liquid
- Paste / semi-solid
- Granules / pieces
- Y-o-Y Growth Trend Analysis By Form, 2021 to 2025
- Absolute $ Opportunity Analysis By Form, 2026 to 2036
- Global Market Analysis and Forecast, By Application, 2021 to 2036
- Introduction / Key Findings
- Historical Market Size Value (USD Million) Analysis By Application, 2021 to 2025
- Current and Future Market Size Value (USD Million) Analysis and Forecast By Application, 2026 to 2036
- Bread & rolls
- Cakes & muffins
- Biscuits & cookies
- Viennoiserie & pastry
- Other bakery & snacks
- Y-o-Y Growth Trend Analysis By Application, 2021 to 2025
- Absolute $ Opportunity Analysis By Application, 2026 to 2036
- Global Market Analysis and Forecast, By Claim, 2021 to 2036
- Introduction / Key Findings
- Historical Market Size Value (USD Million) Analysis By Claim, 2021 to 2025
- Current and Future Market Size Value (USD Million) Analysis and Forecast By Claim, 2026 to 2036
- Conventional
- Clean label
- Organic
- Non-GMO / identity preserved
- Y-o-Y Growth Trend Analysis By Claim, 2021 to 2025
- Absolute $ Opportunity Analysis By Claim, 2026 to 2036
- Global Market Analysis and Forecast, By Sales Channel, 2021 to 2036
- Introduction / Key Findings
- Historical Market Size Value (USD Million) Analysis By Sales Channel, 2021 to 2025
- Current and Future Market Size Value (USD Million) Analysis and Forecast By Sales Channel, 2026 to 2036
- Direct to industrial bakeries
- Ingredient distributors
- Foodservice & artisan supply
- Online B2B
- Y-o-Y Growth Trend Analysis By Sales Channel, 2021 to 2025
- Absolute $ Opportunity Analysis By Sales Channel, 2026 to 2036
- Global Market Analysis and Forecast, By Region, 2021 to 2036
- Introduction
- Historical Market Size Value (USD Million) Analysis By Region, 2021 to 2025
- Current Market Size Value (USD Million) Analysis and Forecast By Region, 2026 to 2036
- North America
- Western Europe
- East Asia
- South Asia and Pacific
- Market Attractiveness Analysis By Region
- North America Market Analysis and Forecast, By Country, 2021 to 2036
- Historical Market Size Value (USD Million) Trend Analysis By Market Taxonomy, 2021 to 2025
- Market Size Value (USD Million) Forecast By Market Taxonomy, 2026 to 2036
- By Country
- United States
- Canada
- By Product Type
- By Form
- By Application
- By Claim
- By Sales Channel
- By Country
- Market Attractiveness Analysis
- By Country
- By Product Type
- By Form
- By Application
- By Claim
- By Sales Channel
- Key Takeaways
- Western Europe Market Analysis and Forecast, By Country
- Historical Market Size Value (USD Million) Trend Analysis By Market Taxonomy, 2021 to 2025
- Market Size Value (USD Million) Forecast By Market Taxonomy, 2026 to 2036
- By Country
- United Kingdom
- Germany
- France
- By Product Type
- By Form
- By Application
- By Claim
- By Sales Channel
- By Country
- Market Attractiveness Analysis
- By Country
- By Product Type
- By Form
- By Application
- By Claim
- By Sales Channel
- Key Takeaways
- East Asia Market Analysis and Forecast, By Country
- Historical Market Size Value (USD Million) Trend Analysis By Market Taxonomy, 2021 to 2025
- Market Size Value (USD Million) Forecast By Market Taxonomy, 2026 to 2036
- By Country
- China
- Japan
- South Korea
- By Product Type
- By Form
- By Application
- By Claim
- By Sales Channel
- By Country
- Market Attractiveness Analysis
- By Country
- By Product Type
- By Form
- By Application
- By Claim
- By Sales Channel
- Key Takeaways
- South Asia and Pacific Market Analysis and Forecast, By Country
- Historical Market Size Value (USD Million) Trend Analysis By Market Taxonomy, 2021 to 2025
- Market Size Value (USD Million) Forecast By Market Taxonomy, 2026 to 2036
- By Country
- India
- Australia
- Rest of world aggregate
- By Product Type
- By Form
- By Application
- By Claim
- By Sales Channel
- By Country
- Market Attractiveness Analysis
- By Country
- By Product Type
- By Form
- By Application
- By Claim
- By Sales Channel
- Key Takeaways
- Key Countries Market Analysis
- United States
- Pricing Analysis
- Market Share Analysis, 2025
- By Product Type
- By Form
- By Application
- By Claim
- By Sales Channel
- Canada
- Pricing Analysis
- Market Share Analysis, 2025
- By Product Type
- By Form
- By Application
- By Claim
- By Sales Channel
- Germany
- Pricing Analysis
- Market Share Analysis, 2025
- By Product Type
- By Form
- By Application
- By Claim
- By Sales Channel
- United Kingdom
- Pricing Analysis
- Market Share Analysis, 2025
- By Product Type
- By Form
- By Application
- By Claim
- By Sales Channel
- France
- Pricing Analysis
- Market Share Analysis, 2025
- By Product Type
- By Form
- By Application
- By Claim
- By Sales Channel
- India
- Pricing Analysis
- Market Share Analysis, 2025
- By Product Type
- By Form
- By Application
- By Claim
- By Sales Channel
- China
- Pricing Analysis
- Market Share Analysis, 2025
- By Product Type
- By Form
- By Application
- By Claim
- By Sales Channel
- Japan
- Pricing Analysis
- Market Share Analysis, 2025
- By Product Type
- By Form
- By Application
- By Claim
- By Sales Channel
- South Korea
- Pricing Analysis
- Market Share Analysis, 2025
- By Product Type
- By Form
- By Application
- By Claim
- By Sales Channel
- Australia
- Pricing Analysis
- Market Share Analysis, 2025
- By Product Type
- By Form
- By Application
- By Claim
- By Sales Channel
- United States
- Market Structure Analysis
- Competition Dashboard
- Competition Benchmarking
- Market Share Analysis of Top Players
- By Regional
- By Product Type
- By Form
- By Application
- By Claim
- By Sales Channel
- Emerging Startups
- Innovation Benchmarking
- Competition Analysis
- Competition Deep Dive
- Gruma, S.A.B. de C.V.
- Overview
- Product Portfolio
- Profitability by Market Segments
- Sales Footprint
- Strategy Overview
- Marketing Strategy
- Product Strategy
- Channel Strategy
- Grain Craft
- Archer Daniels Midland Company
- Cargill, Incorporated
- GoodMills Group (GoodMills Innovation)
- Bunge Global SA
- King Arthur Baking
- Grupo Minsa, S.A.B. de C.V.
- Limagrain Ingredients
- Bob's Red Mill
- Gruma, S.A.B. de C.V.
- Case Studies
- Success Stories
- Recent Developments
- Competition Deep Dive
- Assumptions & Acronyms Used
List of Tables
- Table 1: Global Market Value (USD Million) Forecast by Region, 2021 to 2036
- Table 2: Global Market Value (USD Million) Forecast by Product Type, 2021 to 2036
- Table 3: Global Market Value (USD Million) Forecast by Form, 2021 to 2036
- Table 4: Global Market Value (USD Million) Forecast by Application, 2021 to 2036
- Table 5: Global Market Value (USD Million) Forecast by Claim, 2021 to 2036
- Table 6: Global Market Value (USD Million) Forecast by Sales Channel, 2021 to 2036
- Table 7: North America Market Value (USD Million) Forecast by Country, 2021 to 2036
- Table 8: North America Market Value (USD Million) Forecast by Product Type, 2021 to 2036
- Table 9: North America Market Value (USD Million) Forecast by Form, 2021 to 2036
- Table 10: North America Market Value (USD Million) Forecast by Application, 2021 to 2036
- Table 11: North America Market Value (USD Million) Forecast by Claim, 2021 to 2036
- Table 12: North America Market Value (USD Million) Forecast by Sales Channel, 2021 to 2036
- Table 13: Western Europe Market Value (USD Million) Forecast by Country, 2021 to 2036
- Table 14: Western Europe Market Value (USD Million) Forecast by Product Type, 2021 to 2036
- Table 15: Western Europe Market Value (USD Million) Forecast by Form, 2021 to 2036
- Table 16: Western Europe Market Value (USD Million) Forecast by Application, 2021 to 2036
- Table 17: Western Europe Market Value (USD Million) Forecast by Claim, 2021 to 2036
- Table 18: Western Europe Market Value (USD Million) Forecast by Sales Channel, 2021 to 2036
- Table 19: East Asia Market Value (USD Million) Forecast by Country, 2021 to 2036
- Table 20: East Asia Market Value (USD Million) Forecast by Product Type, 2021 to 2036
- Table 21: East Asia Market Value (USD Million) Forecast by Form, 2021 to 2036
- Table 22: East Asia Market Value (USD Million) Forecast by Application, 2021 to 2036
- Table 23: East Asia Market Value (USD Million) Forecast by Claim, 2021 to 2036
- Table 24: East Asia Market Value (USD Million) Forecast by Sales Channel, 2021 to 2036
- Table 25: South Asia and Pacific Market Value (USD Million) Forecast by Country, 2021 to 2036
- Table 26: South Asia and Pacific Market Value (USD Million) Forecast by Product Type, 2021 to 2036
- Table 27: South Asia and Pacific Market Value (USD Million) Forecast by Form, 2021 to 2036
- Table 28: South Asia and Pacific Market Value (USD Million) Forecast by Application, 2021 to 2036
- Table 29: South Asia and Pacific Market Value (USD Million) Forecast by Claim, 2021 to 2036
- Table 30: South Asia and Pacific Market Value (USD Million) Forecast by Sales Channel, 2021 to 2036
List of Figures
- Figure 1: Global Market Pricing Analysis
- Figure 2: Global Market Value (USD Million) Forecast 2021-2036
- Figure 3: Global Market Value Share and BPS Analysis by Product Type, 2026 and 2036
- Figure 4: Global Market Y-o-Y Growth Comparison by Product Type, 2026-2036
- Figure 5: Global Market Attractiveness Analysis by Product Type
- Figure 6: Global Market Value Share and BPS Analysis by Form, 2026 and 2036
- Figure 7: Global Market Y-o-Y Growth Comparison by Form, 2026-2036
- Figure 8: Global Market Attractiveness Analysis by Form
- Figure 9: Global Market Value Share and BPS Analysis by Application, 2026 and 2036
- Figure 10: Global Market Y-o-Y Growth Comparison by Application, 2026-2036
- Figure 11: Global Market Attractiveness Analysis by Application
- Figure 12: Global Market Value Share and BPS Analysis by Claim, 2026 and 2036
- Figure 13: Global Market Y-o-Y Growth Comparison by Claim, 2026-2036
- Figure 14: Global Market Attractiveness Analysis by Claim
- Figure 15: Global Market Value Share and BPS Analysis by Sales Channel, 2026 and 2036
- Figure 16: Global Market Y-o-Y Growth Comparison by Sales Channel, 2026-2036
- Figure 17: Global Market Attractiveness Analysis by Sales Channel
- Figure 18: Global Market Value (USD Million) Share and BPS Analysis by Region, 2026 and 2036
- Figure 19: Global Market Y-o-Y Growth Comparison by Region, 2026-2036
- Figure 20: Global Market Attractiveness Analysis by Region
- Figure 21: North America Market Incremental Dollar Opportunity, 2026-2036
- Figure 22: Western Europe Market Incremental Dollar Opportunity, 2026-2036
- Figure 23: East Asia Market Incremental Dollar Opportunity, 2026-2036
- Figure 24: South Asia and Pacific Market Incremental Dollar Opportunity, 2026-2036
- Figure 25: North America Market Value Share and BPS Analysis by Country, 2026 and 2036
- Figure 26: North America Market Value Share and BPS Analysis by Product Type, 2026 and 2036
- Figure 27: North America Market Y-o-Y Growth Comparison by Product Type, 2026-2036
- Figure 28: North America Market Attractiveness Analysis by Product Type
- Figure 29: North America Market Value Share and BPS Analysis by Form, 2026 and 2036
- Figure 30: North America Market Y-o-Y Growth Comparison by Form, 2026-2036
- Figure 31: North America Market Attractiveness Analysis by Form
- Figure 32: North America Market Value Share and BPS Analysis by Application, 2026 and 2036
- Figure 33: North America Market Y-o-Y Growth Comparison by Application, 2026-2036
- Figure 34: North America Market Attractiveness Analysis by Application
- Figure 35: North America Market Value Share and BPS Analysis by Claim, 2026 and 2036
- Figure 36: North America Market Y-o-Y Growth Comparison by Claim, 2026-2036
- Figure 37: North America Market Attractiveness Analysis by Claim
- Figure 38: North America Market Value Share and BPS Analysis by Sales Channel, 2026 and 2036
- Figure 39: North America Market Y-o-Y Growth Comparison by Sales Channel, 2026-2036
- Figure 40: North America Market Attractiveness Analysis by Sales Channel
- Figure 41: Western Europe Market Value Share and BPS Analysis by Country, 2026 and 2036
- Figure 42: Western Europe Market Value Share and BPS Analysis by Product Type, 2026 and 2036
- Figure 43: Western Europe Market Y-o-Y Growth Comparison by Product Type, 2026-2036
- Figure 44: Western Europe Market Attractiveness Analysis by Product Type
- Figure 45: Western Europe Market Value Share and BPS Analysis by Form, 2026 and 2036
- Figure 46: Western Europe Market Y-o-Y Growth Comparison by Form, 2026-2036
- Figure 47: Western Europe Market Attractiveness Analysis by Form
- Figure 48: Western Europe Market Value Share and BPS Analysis by Application, 2026 and 2036
- Figure 49: Western Europe Market Y-o-Y Growth Comparison by Application, 2026-2036
- Figure 50: Western Europe Market Attractiveness Analysis by Application
- Figure 51: Western Europe Market Value Share and BPS Analysis by Claim, 2026 and 2036
- Figure 52: Western Europe Market Y-o-Y Growth Comparison by Claim, 2026-2036
- Figure 53: Western Europe Market Attractiveness Analysis by Claim
- Figure 54: Western Europe Market Value Share and BPS Analysis by Sales Channel, 2026 and 2036
- Figure 55: Western Europe Market Y-o-Y Growth Comparison by Sales Channel, 2026-2036
- Figure 56: Western Europe Market Attractiveness Analysis by Sales Channel
- Figure 57: East Asia Market Value Share and BPS Analysis by Country, 2026 and 2036
- Figure 58: East Asia Market Value Share and BPS Analysis by Product Type, 2026 and 2036
- Figure 59: East Asia Market Y-o-Y Growth Comparison by Product Type, 2026-2036
- Figure 60: East Asia Market Attractiveness Analysis by Product Type
- Figure 61: East Asia Market Value Share and BPS Analysis by Form, 2026 and 2036
- Figure 62: East Asia Market Y-o-Y Growth Comparison by Form, 2026-2036
- Figure 63: East Asia Market Attractiveness Analysis by Form
- Figure 64: East Asia Market Value Share and BPS Analysis by Application, 2026 and 2036
- Figure 65: East Asia Market Y-o-Y Growth Comparison by Application, 2026-2036
- Figure 66: East Asia Market Attractiveness Analysis by Application
- Figure 67: East Asia Market Value Share and BPS Analysis by Claim, 2026 and 2036
- Figure 68: East Asia Market Y-o-Y Growth Comparison by Claim, 2026-2036
- Figure 69: East Asia Market Attractiveness Analysis by Claim
- Figure 70: East Asia Market Value Share and BPS Analysis by Sales Channel, 2026 and 2036
- Figure 71: East Asia Market Y-o-Y Growth Comparison by Sales Channel, 2026-2036
- Figure 72: East Asia Market Attractiveness Analysis by Sales Channel
- Figure 73: South Asia and Pacific Market Value Share and BPS Analysis by Country, 2026 and 2036
- Figure 74: South Asia and Pacific Market Value Share and BPS Analysis by Product Type, 2026 and 2036
- Figure 75: South Asia and Pacific Market Y-o-Y Growth Comparison by Product Type, 2026-2036
- Figure 76: South Asia and Pacific Market Attractiveness Analysis by Product Type
- Figure 77: South Asia and Pacific Market Value Share and BPS Analysis by Form, 2026 and 2036
- Figure 78: South Asia and Pacific Market Y-o-Y Growth Comparison by Form, 2026-2036
- Figure 79: South Asia and Pacific Market Attractiveness Analysis by Form
- Figure 80: South Asia and Pacific Market Value Share and BPS Analysis by Application, 2026 and 2036
- Figure 81: South Asia and Pacific Market Y-o-Y Growth Comparison by Application, 2026-2036
- Figure 82: South Asia and Pacific Market Attractiveness Analysis by Application
- Figure 83: South Asia and Pacific Market Value Share and BPS Analysis by Claim, 2026 and 2036
- Figure 84: South Asia and Pacific Market Y-o-Y Growth Comparison by Claim, 2026-2036
- Figure 85: South Asia and Pacific Market Attractiveness Analysis by Claim
- Figure 86: South Asia and Pacific Market Value Share and BPS Analysis by Sales Channel, 2026 and 2036
- Figure 87: South Asia and Pacific Market Y-o-Y Growth Comparison by Sales Channel, 2026-2036
- Figure 88: South Asia and Pacific Market Attractiveness Analysis by Sales Channel
- Figure 89: Global Market - Tier Structure Analysis
- Figure 90: Global Market - Company Share Analysis
Frequently Asked Questions
How big is the masa harina market in 2026?
Future Market Insights estimates the global masa harina market valuation at USD 357.8 million in 2026, advancing from USD 328.0 million in 2025 across industrial and retail packaging ingredient channels.
What is the forecast size and CAGR of the masa harina market through 2036?
Global masa harina market is projected to reach USD 854.8 million by 2036, expanding at a 9.1% CAGR from 2026 to 2036 and generating USD 497.0 million in incremental revenue.
Which Product Type segment leads the masa harina market?
Standard grade leads the Product Type segment with a 43.0% share in 2026 of global product type demand.
Which Form segment captures the largest share of masa harina sales?
Powder / dry leads the Form segment with a 42.0% revenue share in 2026, favored for ambient storage stability and lower freight weight than wet masa paste. liquid formats formats.
How does Bread & rolls perform within the masa harina Application segment?
Bread & rolls accounts for 31.0% of the Application segment in 2026 across pastries and extruded snacks snacks corn snacks.
Which countries record the fastest growth in the masa harina market?
Within the UAE, leads national growth at a10.2% CAGR from 2026 to 2036, followed by Saudi Arabia at 9.9% and South Korea at 9.6%, whereas the USA remains the largest market by value at USD 136.0 million in 2026.
What nutritional and food-safety benefits does nixtamalized masa harina provide?
Controlled alkaline steeping in calcium hydroxide lowers aflatoxin B1 levels by 81% to 86% while raising bioavailable calcium by 808.22%, and permits folic acid fortification at up to 0.7 milligrams per pound.
Which companies lead the global masa harina competitive landscape?
Leading companies include Gruma, S.A.B. de C.V., Grain Craft, Archer Daniels Midland Company, Cargill, Incorporated, GoodMills Group, Bunge Global SA, Grupo Minsa, Limagrain Ingredients, King Arthur Baking, and Bob's Red Mill.
Preview the report firsthand - request a free sample
Get SampleGet the brochure for pricing and purchase details.
Get PDF
